Optical self-energy of superconducting Pb in the THz region
Abstract
New THz data on the optical conductivity of Pb are presented as well as a detailed Eliashberg analysis with particular emphasis on phonon-assisted processes not included in a BCS approach. Consideration of the optical self-energy instead of the conductivity itself helps highlight the differences with BCS predictions. Predicted coherence peaks are observed in the optical scattering rates. Impurities enhance the optical effective mass at zero frequency by an order of magnitude and induce a large peak at twice the gap in agreement with theory. This work illustrates the usefulness of the optical self-energy for the analysis of data.
pacs:
74.25.Gz,74.20.Fg,74.25.Nf,74.25.KcI Introduction
Optical properties of superconducting Pb have been measured in the past by several groups, including Palmer and Tinkhampalmer , who compared their data with BCS predictions. Joyce and Richardsjoyce saw phonon structure in the absorptivity and Farnworth and Timuskfarnworth analysed similar data to recover the electron-phonon spectral density . This latter work was based on approximate equations for the conductivity derived by Allenallen from Fermi golden rule considerations. Good agreement with the tunneling-derived electron-phonon spectral density was foundmcmillan . More elaborate theories of the conductivity based on the Eliashberg equations and a Kubo formula for the current-current correlation function were formulated by Namnam and further elaborated upon in many placesschrieffer including Scalapinoscalapino and Marsiglio and Carbottemarsigliorev ; marsiglio . In this paper we report new high quality THz measurements on Pb. In addition to the new data, we provide a detailed theoretical analysis based on numerical solutions of the Eliashberg equations with the known mcmillan ; rowell . We emphasize particularly the phonon-assisted processes not included in BCS and describe deviations that these processes introduce. BCS deals only with the coherent part of the single particle Green’s function. In Pb, the electron-phonon mass renormalization factor . In this case, only of the spectral weight resides in the coherent part and is found in the incoherent part which describes the phonon-assisted processes.
II Methods
The Pb films are deposited onto the (0001) surface of a single-crystalline sapphire substrate held at room temperature. Four-terminal resistance measurements on films of 30, 50, and 480 nm in thickness show the superconducting transitions around 7.2K with the width of mK, indicating little degradation in from the bulk. The present TDTS (Time Domain TeraHertz Spectroscopy) measurementsNuss1998 are carried out with the use of a commercial spectrometer (RT-20000, Tochigi Nikon Co. Ltd) based on standard transmission techniques, covering the frequency range of 0.15-2.0 THz. The real part and the imaginary part of the optical conductivity are directly evaluated by numerically analyzing both the amplitude and phase of transmitted terawaves through the substrate (0.5 mm in thickness) with and without the film. The data will be presented for the 50 nm film most systematically studied.
For a correlated electron system, specifically here a coupled, electron-phonon system, it has become standard practice to represent the optical conductivity [with , the temperature, and , the photon energy] in terms of an optical self-energy in analogy to the quasiparticle self-energy which is introduced to include interactions in the one-particle Green’s function. By definition,
| (1) |
where is the plasma frequency. The imaginary part of the optical self-energy gives the optical scattering rate and its real part gives the optical effective mass () according to . Further, is the optical mass renormalization . Here, is the bare electron mass. Traditionally, it has been common to display in optical papers the real and imaginary part of but in the recent literature, it has been recognized that much can be learned from the scattering rate and effective mass renormalization, particularly for comparison with quasiparticle properties. In terms of
| (2) | |||||
| (3) |
The Drude conductivity is recovered when all interactions are neglected and only impurity scattering is included through a frequency and temperature independent scattering rate . In this case, the real part of which must be related to its imaginary part by Kramers-Kronig is zero. For coupling to a single oscillator of energy in the normal state at zero temperatureCSH
| (4) |
where is the coupling between electrons and phonons and
| (5) |
For , , the quasiparticle electron-phonon mass renormalization. In this model, has two parts. One part is a delta function at coming from the region in (4) where there is no scattering. If impurity scattering is included, the -function broadens into a Lorentzian
| (6) |
The second part which is finite only for is a boson-assisted part:
| (7) |
Further, if we approximate in (6) by , its zero frequency limit which is exact for small , we obtain a coherent Drude part
| (8) |
with optical spectral weight of and effective scattering rate of . The remaining spectral weight is to be found in the incoherent piece (7) and is which follows on application of the optical sum rule
| (9) |
III Results
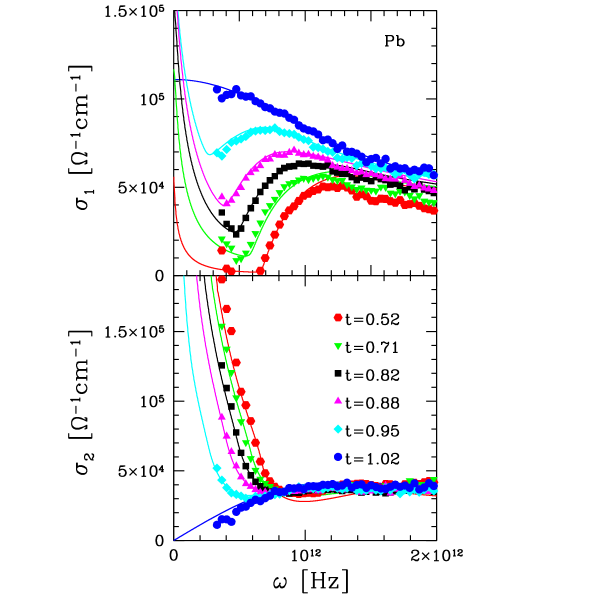
In Fig. 1, we present our experimental (points) and theoretical (lines) results for 6 temperatures as labelled by reduced temperature . In the top frame, we show the real part of the conductivity in versus up to a frequency of Hz while in the lower frame we show the imaginary part . For the real part, we note a kink in both data and theory at an intermediate frequency which decreases in frequency, with increasing temperature. This arises because there are two separate absorption processes possible. At the lowest frequencies there can be direct absorption from the thermally excited quasiparticles. This contribution provides a Drude-like peak to . At frequencies above twice the gap, direct absorption through the creation of two excitations out of the condenstate becomes possible. In addition, there is another incoherent phonon-assisted contribution to the absorption and this is the part of most interest in this work. However, it cannot easily be separated out of the real part of the conductivity. We will see that consideration of the optical self-energy defined in Eq. (1) helps in this regard. First, however, we note that the fit between theory and the data is very good at low frequency in all cases. We have used the data in the normal state () to determine the elastic scattering rate and the plasma frequency . Turning next to the imaginary part of shown in the lower frame of Fig. 1, we note the same level of agreement and the points for which are in the normal state also show good agreement with the theory. In general, the superconducting properties of Pb, while very different from those predicted by BCS, have been remarkably well-described by Eliashberg theorycarbotte over a broad range of experiments and our new data shown here poses no exception. This is important given that in the past, it is has been argued that vertex corrections and other aspects of electromagnetic theory were needed to understand the data in Pb and yet this appears not to be the case here. With this level of agreement between theory and data, we should now be able to proceed to test for more subtle effects due to the phonon-assisted processes in the absorption.
To see separately, more clearly, the role of the coherent absorption processes included in BCS theory and described by the coherent part of the electron Green’s function , and the incoherent phonon-assisted processes described by the incoherent part of , it is convenient to deal with the real and imaginary parts of the optical self-energy defined in Eq. (1). Equations (2) and (3) are for the optical scattering rate and effective mass, respectively. These are shown in Fig. 2.
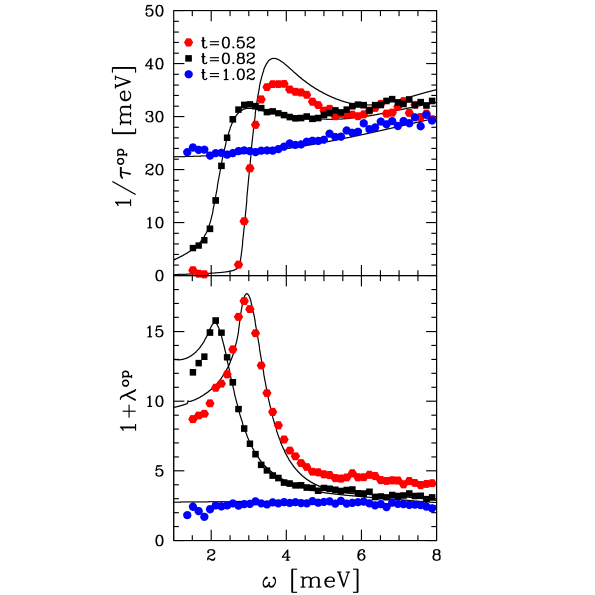
The top frame gives and the bottom at three temperatures. To agree with the experimental data it was necessary to include an impurity scattering rate of 22 meV. This is the only scattering that would be included in a BCS theory for which the normal state conductivity would be a pure Drude form. The optical scattering rate corresponding to this Drude is a constant flat line independent of frequency and temperature. We see clearly in the curve for the normal state that significant deviations from this constant occur. These are due to the boson-assisted processes which become even more important as the frequency is increased beyond the range of the data shown. This is shown in the top frame of Fig. 3, where we present our theoretical results over an extended frequency range up to 36 meV, well beyond the end of the phonon spectrum. For clarity, only the (superconducting state) and (normal state) curves are shown.
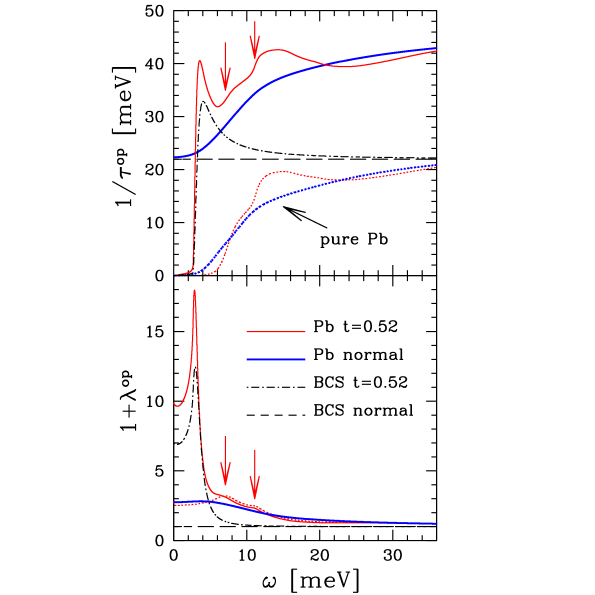
Starting with the normal state (thick blue curve), we note a large deviation from the horizontal dashed black line at 22 meV for elastic impurity scattering. The additional frequency-dependent scattering, due to boson-assisted processes, adds on to according to Eq. (4) (in the case of a delta function spectral density). For this contribution will saturate at (see Eq. (4)) even for a distributed spectrum.
Turning next to the superconducting state (thin red curve, top frame), we see larger boson structures with the vertical arrows indicating the transverse and longitudinal peaks in the phonon frequency distribution of Pb shifted by . These are preceded by a coherence peak in the region above which reflects the increased density of final states for scattering in the superconducting as compared with normal state. This curve is strikingly different from the dot-dashed black curve which would apply to a BCS superconductor. An interesting comparison is offered in the dotted curves which were also calculated with the Pb spectrum, but without residual scattering, i.e. . An important point to note is that no coherence peak is seen in the dotted thin red curve because this is an impurity effect, but at higher frequencies the dotted curve is very close to the solid one once it is displaced upward by 22 meV. This holds exactly for the normal state data, blue dotted (pure) and solid (with residual scattering). Returning to the lower frame of Fig. 2, we show the optical effective mass renormalization . The solid blue dots apply to the normal state at just above . Note that as which is just slightly larger than the zero temperature quasiparticle mass renormalization for Pb, which is 1.55. This is expected since it is known that the mass renormalization increases slightly with increasing temperature. Furthermore, the normal state effective mass has only a small frequency dependence predicted and this is observed. There is no dependence on impurity scattering as it drops out of this curve. (This fact can be understood simply. The Kramers-Kronig (KK) transform of a constant is zero so that a constant scattering rate corresponds to no mass renormalization.) This is in striking contrast to the superconducting state for which impurities profoundly alter the optical curves. This is seen in the other two curves for (red hexagons) and (black squares). Note first the very large peaks which occur at twice the gap edge . These peaks have not been emphasized before. They would not be there in the clean case (no impurities). Their origin is easily understood from our results for the scattering rate shown in the top frame. We see the sharp, almost vertical, rise in at with the energy scale of the rise given by the value of meV. The KK transform of a step at is a logarithm with a singularity at . The larger the step, the larger the log singularity. Of course, here we do not quite have a vertical step and hence the corresponding peak in the effective mass is smeared. Another feature to note is the limit of . We note that Eq. (3) can be rewritten as
| (10) |
and that in the superconducting state in the limit of we get
| (11) |
where is the electron density in the normal state and is the superfluid density at temperature . For , direct strong-coupling calculations of show that it is very nearly equal to which leads to , same as for the normal state, and reflects the fact that only the coherent part of the optical conductivity participates in the superfluid condensation. Returning to Eq. (10), one can verify that in the normal state, substitution of the Drude form (8) again gives as we expect. If impurities are included, as we have done in our work, is no longer but in the dirty limit has instead the approximate form (in renormalized BCS)marsigliorev
| (12) |
for where , which gives . The exact numerical result (Fig. 2, bottom frame) is 9.5 at . Most of the difference can be assigned to the small reduction in between and .
In the lower frame of Fig. 3, we show additional theoretical results on the optical effective mass which range over a larger frequency interval beyond that covered by the THz data. The dot-dashed black curve is the BCS result (for meV) while the solid thin red curve includes as well the incoherent phonon-assisted Holstein processes. We see clearly in this curve an image of the Pb phonon frequency distribution with transverse and longitudinal phonon peaks shifted by indicated by vertical arrows. The thin red dotted lines were obtained for pure Pb (i.e. is set equal to zero and the only source of scattering comes from the inelastic part described by ). In this case there is no peak in at twice the gap but at higher frequencies the dotted and solid curves agree. For the normal state at , the solid thick blue curve applies. Note that for larger than a few times the phonon energy, normal and superconducting curves merge and all tend toward 1, i.e. as . For BCS in the normal state, for all as shown by the long-dashed curve.
IV A Sum Rule
Recently, there have been several discussions of sum rules on in the literaturemarsiglio02 ; chubukov ; abanov . In particular, it was noted that there exists a differential sum rule on the difference in optical scattering rate between the superconducting and normal state. Defining the partial sum as
| (13) |
it can be shownchubukov that for any value of and . The energy scale for arriving at the asymptotic limit is set by even in the dirty limit. As defined, in BCSchubukov is negative and has its maximum absolute value at after which it begins to decrease towards zero, but always remaining negative. Our results for the case of Pb are shown in Fig. 4 and deviate significantly from the BCS behaviour just described.
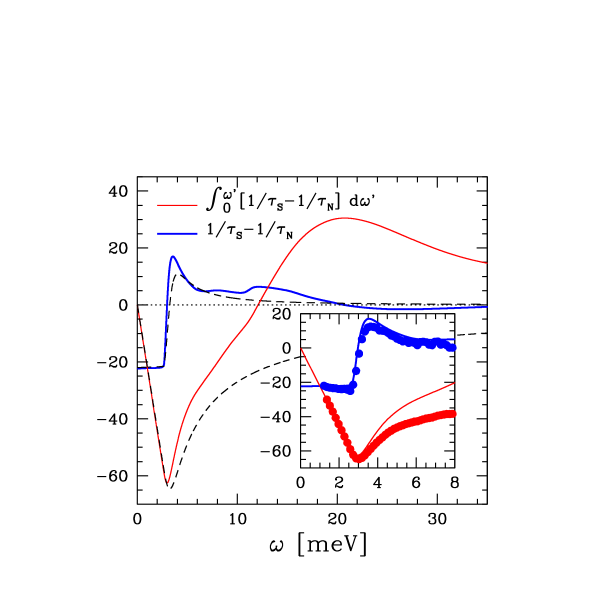
The solid thick blue curve gives the result for at and shows a rapid increase through 0 at twice the gap, after which a coherence peak is seen followed by boson structure beyond which the curve crosses the axis again. The solid thin red curve is the result for the partial sum . The dashed black curves are the BCS results for comparison. The crossing of the horizontal axis at a frequency slightly above the end of the phonon spectrum in the case for Pb (thin red curve) is due to the inelastic scattering processes and is not seen in the BCS curve. Note also the large positive peak.
V Conclusions
We have presented new THz data on the optical conductivity of Pb and compared them with Eliashberg results with an emphasis on phonon-assisted (Holstein) processes not part of BCS. We find that these show up most clearly in the optical self-energy rather than in the conductivity itself. In particular, the impurity component of the total scattering is seen directly in the optial scattering rate as a large constant which can easily be subtracted out to reveal directly the phonon-assisted part. In the normal state impurity scattering drops out of the optical effective mass leaving only phonon renormalizations which show excellent agreement between theory and experiment. By contrast, in the superconducting state, the impurities provide a large renormalization of the zero frequency effective mass and cause a peak to appear at twice the gap in the optical mass which we predict here and observe in the experiment.
Acknowledgements.
We thank S. Goshima, M. Mori, T. Suzuki and H. Matsui for valuable assistance and advice in TDTS experiments. The experimental work at Sendai has been supported by Grants-in-Aid for Scientific Research (09440141 and 15201019) from the Ministry of Education, Culture, Sports, Science and Technology, Japan. This work has also been supported by the Natural Science and Engineering Council of Canada (NSERC) and the Canadian Institute for Advanced Research (CIFAR).References
- (1) L. H. Palmer and M. Tinkham, Phys. Rev. 165, 588 (1969).
- (2) R. R. Joyce and P. L. Richards, Phys. Rev. Lett. 24, 1007 (1970).
- (3) B. Farnworth and T. Timusk, Phys. Rev. B 10, 2799 (1974); ibid. 14, 5119 (1976).
- (4) P. B. Allen, Phys. Rev. B 3, 305 (1971).
- (5) W.L. McMillan and J.M. Rowell in Superconductivity, Edited by R.D. Parks (Marcel Decker, Inc., New York, 9169) Vol. 1, p. 449.
- (6) S. B. Nam, Phys. Rev.156, 470 (1967).
- (7) J.R. Schrieffer, Theory of Superconductivity, (W.A. Benjamin, New York, 1964).
- (8) D.J. Scalapino in Superconductivity, Edited by R.D. Parks (Marcel Decker, Inc., New York, 9169) Vol. 1, p. 449.
- (9) F. Marsiglio and J.P. Carbotte in Physics of Conventional and Unconventional Superconductors, Edited by K. H. Bennemann and J. B. Ketterson (Springer-Verlag, Berlin, 2002) vol. 1, p. 233; F. Marsiglio, J. P. Carbotte, A. Puchkov, and T. Timusk, Phys. Rev. B 53, 9433 (1996).
- (10) F. Marsiglio and J.P. Carbotte, Australian J. Phys. 50, 975 (1997); ibid. 1011, (1997).
- (11) J.M. Rowell and W.L. McMillan, Phys. Rev. Lett. 16, 453 (1966).
- (12) M.C. Nuss and J. Orenstein, in Millimeter and Submillimeter Wave Spectroscopy of Solids ed. G. Grüner (Springer-Verlag, Berlin Heidelberg, 1998) Ch. 2, pp. 7-50.
- (13) J.P. Carbotte, Rev. Mod. Phys. 62, 1027 (1990).
- (14) J. P. Carbotte, E. Schachinger, and J. Hwang, Phys. Rev. B 71, 054506 (2005).
- (15) F. Marsiglio, J. P. Carbotte,and E. Schachinger, Phys. Rev. B 65, 014515 (2001).
- (16) A. V. Chubukov, Ar. Abanov, and D. N. Basov, Phys. Rev. B 68, 024504 (2003).
- (17) Ar. Abanov and A. V. Chubukov, Phys. Rev. Lett. 88, 217001 (2002).