Observatoire de Besançon
Institut UTINAM – UMR CNRS 6213
BP 1615
25010 Besançon Cedex
France
11email: rousselot@obs-besancon.fr
174P/Echeclus: a strange case of outburst††thanks: Based on observations collected at the European Southern Observatory, Chile: ESO N∘ 71.C-0092(A), 276.C-5042(B) and 278.C-5046(A).
Abstract
Context. More than ten Centaurs are now known to have cometary activity at large heliocentric distance (i.e. 5-13 AU). Among these objects, 174P/Echeclus which showed cometary activity at 13 AU from the Sun, is a unique case, because of: (i) the amplitude of its outburst, (ii) the source of cometary activity that appears distinct from Echeclus itself.
Aims. This paper aims at investigating the physical conditions that have led to this unusual outburst. The purpose is also to quantify this phenomenon and to provide observational constraints for its modeling.
Methods. We use observations from different telescopes, performed before, during, and after the outburst. We performed the main observations on March 23 and 30, 2006, with the 8.2-m ESO Very Large Telescope and FORS 1 instrument. They consist of visible images and spectra.
Results. Our main results are: (i) a cometary source distinct from Echeclus itself that presents a brightness distribution compatible with a diffuse source; (ii) a total dust production rate Q and a parameter cm; (iii) no emission lines (CN and C2) can be detected in the visible range; (iv) the upper limits for the CN and C2 production rates are and molecules.s-1 respectively; (v) we detected no Echeclus’ satellite before the outburst up to ; (vi) the upper limit for the object generating the coma is about 8 km in diameter; (vi) and we detected no cometary activity one year later, in March 2007.
Key Words.:
Comets: general - Comets: individual: 174P/Echeclus - Kuiper Belt - Solar system: general1 Introduction
Centaurs, defined to have their perihelion outside of Jupiter (5.2 AU) and semimajor axis inside of Neptune (30.0 AU), have unstable orbits and have been extracted from the transneptunian objects (TNOs) population through perturbations by Neptune. They represent probably an intermediate stage in the process that transforms a TNO to a short-period comet (horner:2004). Observations of cometary activity on these objects, always located at large heliocentric distances, are very useful for a better understanding of the physical relationship between Kuiper belt objects (KBOs) and comets. So far only a few Centaurs or TNOs classified as scattered disk objects (SDOs) have presented unambiguous evidence of cometary activity.
The first Centaur known to present cometary activity was Chiron. kowal:1977 discovered this object and initially classified it as an asteroid. tholen:1988 suggested, on the basis of non-asteroidal brightness variations, that some kind of cometary activity could occur on this object. meech:1989 were the first authors to present a direct detection of Chiron’s coma. This object has a semimajor axis a=13.67 AU and a perihelion distance q=8.45 AU. It is considered a transition object between TNOs and Jupiter family comets.
Some other objects with orbital elements that classified them as Centaurs have been reported to have a cometary activity. They are classified as comets. They are: 39P/Oterma (discovered in 1943); 29P/Schwassmann-Wachmann 1 (discovered in 1927); C/2000 B4 (165P/LINEAR) (kusnirak:2000); C/2001 M10 (NEAT) (lawrence:2001); C/2001 T4 (166P/NEAT) (pravdo:2001); C/2004 PY42 (167P/CINEOS), initially repertoried as 2004 PY42 (romanishin:2005); P/2004 A1 (LONEOS) (skiff:2004); P/2005 S2 (Skiff); P/2005 T3 (Read) (read:2005); and 174P/Echeclus (initially repertoried as (60558) 2000 EC98, see below).
Two TNOs have also been reported by some authors to have cometary activity. choi:2003 reported cometary activity for the SDO (29981) 1999 TD10 but other observations with larger telescopes (rousselot:2003; mueller:2004) detected nothing for this object. Hainaut et al. (2000) presented a change in the lightcurve of the TNO (19308) 1996 TO66 that could possibly be interpreted as the result of cometary activity.
This paper presents new observational data of 174P/Echeclus. This Centaur was discovered by the Spacewatch program on March 3, 2000 (marsden:2000) and initially labelled (60558) 2000 EC98. Table 1 presents the orbital elements of this Centaur. Different observers have published obervational data – mainly photometric in nature – related to this target. They have even searched for cometary activity without any success despite a very sensitive search of up to magnitude 27/arcsec2 (rousselot:2005a; lorin:2007).
| a (AU) | e | q (AU) | Q (AU) | i |
| 10.772 | 0.456 | 5.85 | 15.69 | 4.3 |
On December 30, 2005, a surprising cometary outburst was discovered with the 5-m Mount Palomar Observatory telescope (choi:2006). This outburst corresponded to a change in the overall visual magnitude from about 21 to about 14. At that time (60558) 2000 EC98 was located at 13.07 AU to the Sun and was subsequently renamed with a cometary designation: 174P/Echeclus. Subsequent observations revealed that the coma did not appear to be directly associated with the nucleus (choi:2006b).
To study this outburst, we applied for Director’s Discretionary Time at the 8.2-m Very Large Telescope (VLT) of the European Southern Observatory (ESO) in March 2006. The aim of these observations was to investigate in more detail this phenomenon by using optical imaging and spectroscopy. One year later (March 2007) we conducted complementary observations with the 3.5-m New Technology Telescope of ESO.
In Sect. 2 the observational data are described. Sects. 3 and 4 present our analysis of the images obtained, Sect. 5 the analysis of the spectroscopic data, and Sect. 6 is a discussion related to this phenomenon.
2 Observations
We first performed observations of 174P/Echeclus with the 8.2-m VLT of ESO with the Focal Reducer / Low Dispersion Spectrograph 1 (FORS 1) instrument. This instrument is equipped with a 22k Tektronix CCD, thinned and anti-reflection coated (24 m pixel). It was used both in direct imaging and standard resolution mode and in longslit spectroscopy mode. These modes provide a scale of 0.2 arcsec/pix.
A total of 3 hours of service mode observations were allocated to our program. We split these observations to two different observing runs, in order to monitor the evolution of the coma. Table 2 presents the observing circumstances. The seeing was about 0.4 arcsec for the first observing night and 0.6 for the second one. We obtained the long slit spectroscopy data with a 1.3 arcsec slit centered on Echeclus and oriented in the motion direction (very close to the solar direction). The spectral range covered was 345-590 nm (chosen to cover the CN and C2 Swan bands wavelengths) with a spectral resolution of 600.
One year later we managed to obtain complementary observing time with the 3.5-m New Technology Telescope (NTT) of ESO. These observations, conducted in service mode with the direct imaging camera SUperb-Seeing Imager (SUSI 2), consisted in imaging Echeclus in the R, B, and V-band for one hour. Table 2 also presents the observing circumstances for these observations, which we obtained, unfortunately, during a nonphotometric night.
| UT start | R | Mode | Filter | Exposure time (s) | Instrument | ||
|---|---|---|---|---|---|---|---|
| 2006 Mar. 23, 06:59:52 | 12.92 | 11.96 | 1.25 | IMG | R | 3120 s | FORS 1 |
| 2006 Mar. 23, 07:08:33 | 12.92 | 11.96 | 1.25 | IMG | V | 2145 s | FORS 1 |
| 2006 Mar. 23, 07:15:18 | 12.92 | 11.96 | 1.25 | IMG | B | 3145 s | FORS 1 |
| 2006 Mar. 23, 07:33:43 | 12.92 | 11.96 | 1.25 | LSS | 4585 s | FORS 1 | |
| 2006 Mar. 23, 08:23:51 | 12.92 | 11.96 | 1.25 | LSS | 3585 s | FORS 1 | |
| 2006 Mar. 30, 06:13:30 | 12.91 | 11.92 | 0.71 | IMG | R | 3120 s | FORS 1 |
| 2006 Mar. 30, 06:22:12 | 12.91 | 11.92 | 0.71 | IMG | V | 2145 s | FORS 1 |
| 2006 Mar. 30, 06:28:58 | 12.91 | 11.92 | 0.71 | IMG | B | 2145 s | FORS 1 |
| 2007 Mar. 24, 08:25:14 | 12.23 | 11.30 | 1.84 | IMG | R | 6125 s | SUSI 2 |
| 2007 Mar. 24, 08:40:59 | 12.23 | 11.30 | 1.84 | IMG | V | 6125 s | SUSI 2 |
| 2007 Mar. 24, 08:56:39 | 12.23 | 11.30 | 1.84 | IMG | B | 6125 s | SUSI 2 |
| 2007 Mar. 24, 09:12:30 | 12.23 | 11.30 | 1.84 | IMG | R | 4125 s | SUSI 2 |
SUSI 2 is equiped with two 2k4k CCDs providing a 5.5’5.5’ field of view. Because of the very small plate scale of the instrument (0.0805 arcsec/pixel) we used the 22 binned mode. To avoid any trailing due to the proper motion of the object the exposure time was limited to 125 s, corresponding to a displacement of 0.3 arcsec. We obtained most of the images with a Bessel R filter, for which the signal-to-noise is best.
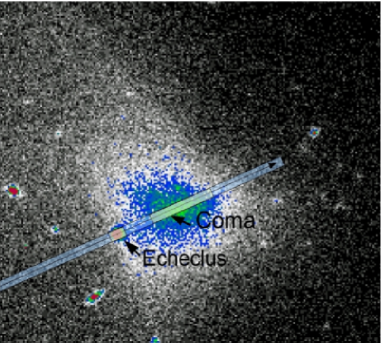
First, we preprocessed all the images obtained with FORS 1 (subtraction of the bias and division by a master sky flat-field). We specifically processed the images corresponding to the spectra to extract 1D spectra. First, we calibrated in wavelength, thanks to wavelength calibration lamp images. Second, we extracted two different 1D spectra from each image. The first one corresponded to Echeclus itself (11 lines, corresponding to 2.2 arcsec centered on Echeclus) and the second one to the center of the coma (41 lines corresponding to 8.2 arcsec on the coma). We extracted the sky background from the same image (far from the nucleus, in the solar direction) and we subtracted it from both spectra. Its intensity was dominant compared to the one of Echeclus and the coma. Figure1 presents the geometry of the slit on the target and the corresponding area of the extracted 1D spectra. We corrected the 1D spectra obtained above for atmospheric absorption and calibrated in absolute flux thanks to a spectrum of the spectrophotometric standard star EG274 observed twice during the observations. Finally, we median averaged the 7 different spectra.
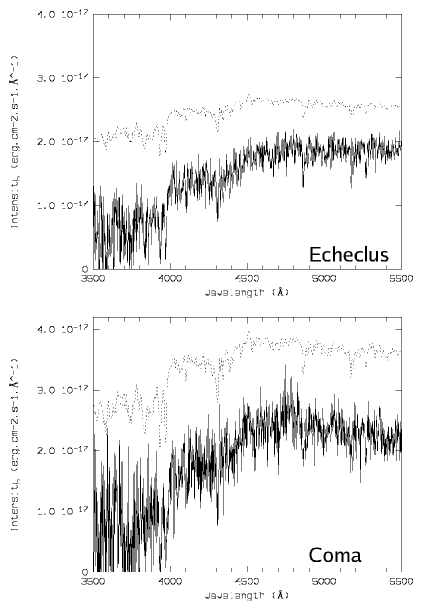
The final step in the data processing consisted of subtracting a solar spectrum convolved with a similar instrument response function (FWHM=7Å). The validity of the resulting solar spectrum was checked by using the fraunhofer lines appearing in the coma spectrum. We also checked the instrument response itself with the wavelength calibration, lamp emission lines. Because of the unknown reddening due to the light scattering by the dust particles in the coma this final step can only be correctly done in a limited part of the spectrum. For both spectral regions corresponding to CN and C2 emission lines (i.e. 3700-4000 and 4800-5200Å) the solar spectrum was normalized with the observational one before subtraction. Figure 2 presents an overall view of the averaged spectra obtained both for Echeclus itself and the coma.
We preprocessed the SUSI 2 images in a similar manner as the one used for FORS 1 images. We first subtracted a bias image computed as the average of five different bias images. A normalized flat-field, corresponding to a median-averaged series of dome flat-fields, has been used to perform the flat-field corrections.
3 March 2006 Imaging
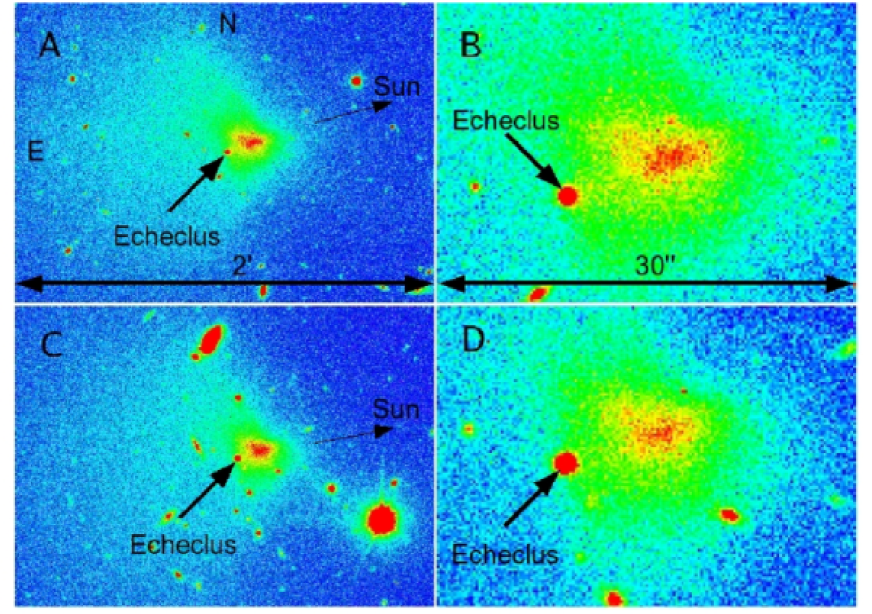
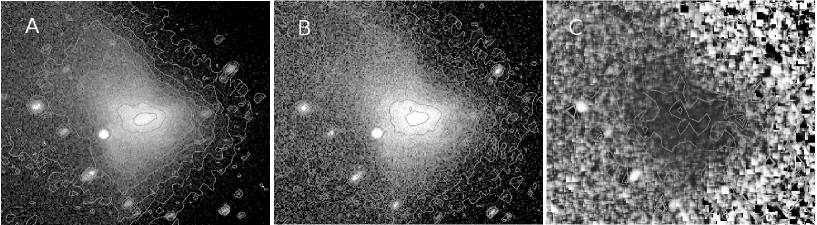
The images obtained by FORS 1 clearly reveal that the coma is distinct from Echeclus itself. Fig. 3 represents R-band images obtained on March 23 and 30, 2006. It can be seen that the apparent distance between the coma and Echeclus itself is roughly the same, i.e. about 60,000-70,000 km (8 arcsec).
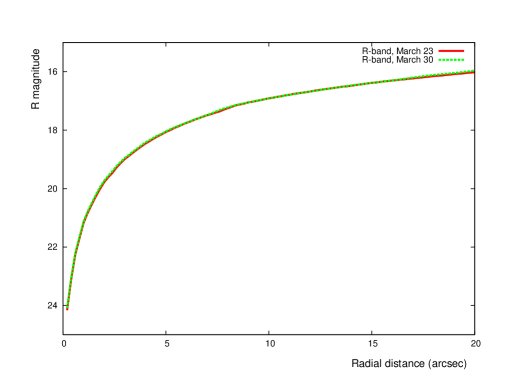
We computed the overall magnitude of the coma, by using standard star images and integrating all the flux in a square covering all the coma. This method provided acceptable results for the images obtained on March 23, because of the lack of bright stars superimposed on the coma. Table 3 presents our results. For the data obtained on March 30, the numerous stars and galaxies superimposed on the image of the coma prevented us from using a similar method. We compared the global apparent magnitude near the center of the coma for both observing nights (Fig. 4). Because there were no apparent differences, we conclude that there were no changes in the overall magnitudes on March 23 and March 30.
We have also computed the magnitude of Echeclus itself. This measure has been conducted, despite the presence of the coma around the object, by using a small radius to measure the flux and by measuring the sky background close to the object.The radius of the aperture used to measure the flux was 5 pixels and the sky background was measured in the 6 to 8 pixels annulus (with similar values for the standard stars). The results are presented in Table 3. These values can be compared to previous ones obtained before the outburst. According to rousselot:2005a, the average absolute magnitudes for the phase angle of the observations (1.25 and 0.71o) in the R-band are 9.30 and 9.25, respectively. Converted to apparent magnitude by taking into account the geocentric and heliocentric distances and by using the color indices, the average apparent magnitudes for March 23 and 30 should be, respectively: 20.24 (R), 20.75 (V), 21.51 (B), and 20.19 (R), 20.70 (V), 21.46 (B). With a lightcurve amplitude of 0.24 magnitude, these predicted apparent magnitudes are compatible with those appearing in Table 3. We conclude that the nuclear magnitude of Echeclus was unchanged during the 2005-2006 outburst: most or even all of the activity was associated with a separate source located within the coma condensation.
| band | coma magnitude | Echeclus magnitude (March 23) | Echeclus magnitude (March 30) |
|---|---|---|---|
| R | 14.40.2 | 20.130.1 | 20.230.1 |
| V | 14.90.2 | 20.690.1 | 20.780.1 |
| B | 15.90.3 | 21.540.1 | 21.650.1 |
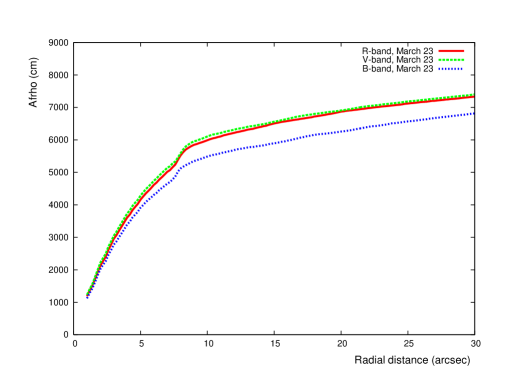
We have also analyzed the images in term of the parameter. ahearn:1984 introduced this parameter, which permit us to quantify the cometary activity level in a manner not too sensitive to the parameters used to quantify dust production rate (e.g. albedo or dust grain density). In this expression, represents the bond albedo, i.e. the ratio of the total scattered radiation to the total incident radiation (for isotropic scatterers if is the geometric albedo); is the filling factor of grains within the field of view and is the projected cometocentric distance. The filling factor is the total cross section of grains within the field of view divided by the area of the field of view. The parameter supposes a steady state coma created by a nucleus with a variation of the dust quantity (or number of dust particles) integrated along the line of sight and is supposed to be, more or less, independent of the aperture size used to measure it. We have used the formula presented in lorin:2007 for computing the parameter (and the standard star images) in the three different bands111We have used some slightly different magnitudes for the Sun than the one mentionned in this paper (see www.ucolick.org/ cnaw/sun.html), measured through R, V and B Bessel filters: -27.12 (R), -26.78 (V), and -26.14 (B). These magnitudes lead to the q values (lorin:2007) equal to , , and respectively. The total parameter (when integrating for the whole coma, with the R magnitude presented in Table 3) can be estimated to about 10,000 cm. This value is similar to the one computed by bauer:2006 on the basis of observations performed in R-band at the end of February 2006 during coordinated optical-infrared (Spitzer) observations of Echeclus.
Figure 5 presents the resulting profiles. The examination of these profiles reveals that the parameter is not constant with the radial distance but increases with it. The increase of with the radial distance could be interpreted – if observed only for March 23 – by a decrease of the dust production rate with time, the regions observed close to the center of the coma containing “younger” dust particles. The similar profiles obtained one week later (see Fig. 4) permit to discard this hypothesis and lead to the conclusion that this variation of the parameter with the cometocentric distance is due to a variation in the intensity that does not follow the intensity variation assumed by a nucleus releasing dust particles. The more plausible explanation for such a behavior is a steady state process (at least at the timescale of our observations) created by a diffuse source of dust. Such an interpretation is coherent with the general view provided by the different images.
In the case of a intensity variation for the intensity profile the parameter is more or less independent of because and (where , and are some constants and is the coma flux). In the case of our observations increases with because varies as with leading to with .
It is possible to use the global parameter to derive an approximate dust production rate by using this equation with (see lorin:2007 for more details):
| (1) |
We used the following parameters: grain radius m, volumetric mass kg.m-3 and geometric albedo . For the dust ejection velocity we used the formula m.s-1, with the heliocentric distance expressed in AU (delsemme:1982). These parameters lead to a total dust production rate of Q86 kg.s-1. Such a production rate can be compared to the upper limit obtained with our April 2001 observations (lorin:2007), which was 28 cm for Af and 0.45 kg.s-1 for the dust production rate Q (with similar parameters to the one mentioned above). The dust production rate has increased by at least a factor of 200 between 2001 and 2005 outburst. The fact that the dust is created by a diffuse source impacts the interpretation of the parameter in terms of the dust production rate. The above formula is based on a distribution. With a flatten dust distribution the dust production would be slightly smaller for a same value. The value provided above should be regarded, consequently, as an upper limit.
We have also tried to compute color ratios. We have subtracted the sky background for R-band and V-band data, divided by the exposure time and corrected for the zero point before computing the ratio. Figure 6 presents the ratio of the R-band to the V-band data (the one with the best signal-to-noise). It can be seen that the redenning increases with cometocentric distance. This color change is probably indicative of a grain fragmentation process. According to the Mie scattering theory, the light scattered by dust particles depends on the grain radius and the wavelength. If the grain size changes with cometocentric distance, the light scattered by the dust will be affected in a different manner at different wavelengths.
4 March 2007 Imaging
The images obtained with SUSI 2 on March 24, 2007 did not allow us to detect any cometary activity. Because no photometric standard star could be observed during the same night (nonphotometric night) we have used the predicted Echeclus average magnitude for calibrating the profile with absolute magnitudes. We base this prediction on the phase curve published by rousselot:2005a, and the heliocentric and geocentric distances, as well as the phase angle during the observations. Figure 7 presents the surface brightness profile of Echeclus obtained when all the R-band images are co-added (after centering). We compare this profile to the one of a star apprearing in the same field of view and adjusted in intensity. No differences can be detected up to the sky background, i.e. up to R27/arcsec2. We have used the method mentioned by jewitt:1984 to derive an order of magnitude of the maximum parameter that can be derived from these data. We have used the magnitude where the surface brightness profile reaches the sky background, i.e. about 27/arcsec2. From this magnitude we have derived a lower limit for the coma magnitude, if it exists, by using the formula: . In this formula, represents the diameter corresponding to the magnitude, i.e. 5 arcsec. These values lead to an upper limit for equal to about 75 cm. This upper limit can be compared to the one measured one year before (10,000 cm for the R-band, see above). The ratio is about 130. By using similar parameters and formulae as the one mentionned in Sect. 3 we derive an upper dust production rate kg.s-1.

.
5 Spectra
In the range covered by our spectra different emission bands corresponding to different radicals could be observed. Among these emission bands the more intense are CN (3880 Å) and C2 (Swan bands with the strongest one having a bandhead at 5165 Å). Because of the large heliocentric distance CN is expected to be dominant, if some emission bands are apparent. This is due to the fact that the ratio CN/C2 increases with heliocentric distance (ahearn:1981) because CN is less sensitive to the heliocentric distance. So far CN is also the only emission band detected in the visible range at large heliocentric distance (on Chiron, see bus:1991).
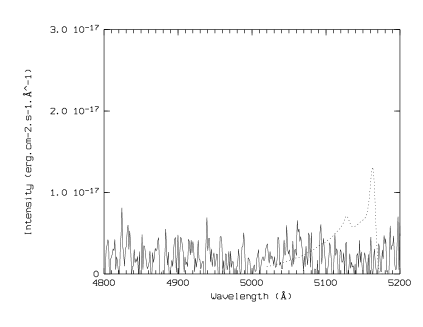
We have searched for C2 and CN emission bands. Figure 8 presents the observed spectra obtained in the 3700-4000 Å range (CN band), and Fig. 9 presents the 4800-5200 Å region (C2 bands) after subtraction of the solar spectrum. A theoretical spectrum of both CN and C2 emission bands has been superimposed on these spectra.
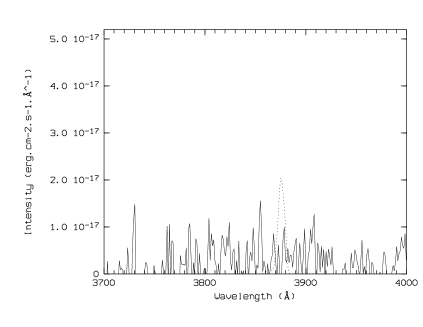
We computed the CN spectrum by using the model described in zucconi:1985. We computed the C2 spectrum with the model described in rousselot:2000 with transition moments atomic unit. Both spectra were computed for similar heliocentric distance and velocity (-3.097 km.s-1) and convolved with an instrument response function similar to that of FORS 1 in the mode used during our observations (7 Å of FWHM). As we’ve seen, no CN nor C2 emission lines are apparent. It is only possible to derive an upper limit for both of these species.
In the case of CN the brightest possible CN emission band can be estimated to have an intensity equal to about erg.cm-2.sÅ-1 (corresponding to a 4-sigma detection level). Taking into account the bandwidth this peak corresponds to 1.6 erg.cm-2.s-1 of the maximum possible flux for the CN band. Taking into account the fluorescence efficiency factor g of the CN band computed for such heliocentric distance and velocity (4.4 photon.molecule-1.s-1), and the geocentric distance (11.962 AU), this leads to a maximum number of CN radicals inside the slit of about 2.9.
This number can be related to a production rate. Such a calculation can only be approximate, because of the unknown parameters in such a model. The production rate would probably not be constant with time because it is an outburst, the velocity of the daughter radical is unknown, and the phenomenon is probably not isotropic. We have used a Haser’s model, nevertheless, to make a rough estimate of the production rate. For this model, which supposes a steady state process, we have used the following parameters: (i) a parent molecule scalelength km (at 1 AU); (ii) a daughter scalelength km (based on waniak:2007); and (iii) a CN average expansion velocity equal to the dust ejection velocity, taken equal to 465.R (delsemme:1982), Rh being the heliocentric distance expressed in AU. With these parameters and the slit size, we compute that the maximum possible CN parent molecule prodution rate is Q molecules.s-1.
This result can be compared to the other procution rates of CN parent molecules measured in other comets. For example it is similar to the one observed in Halley’s comet in November 1985 (almeida:1992) or, to consider a more similar case, to the detected CN on Chiron (bus:1991). In both cases the absolute overall magnitude of the object was fainter than the magnitude of Echeclus. For Echeclus, the overall magnitudes presented in Table 3 lead to an absolute magnitude of V4, brighter than Halley’s comet’s absolute magnitude (close to 5 in November 1985) and the one of Chiron (close to 6 when CN was detected). The CN radicals, if present in the coma of Echeclus, are consequently underrepresented compared to the dust when compared to the “usual” comets.
For the C2 radical similar calculations lead to Q molecules.s-1. This value is based on a g factor equal to 5.710-4 photon.s-1.molecule-1 for the Swan bands sequence at the heliocentric distance of Echeclus (see Fig. 9) and an overall maximum flux of 6.5 erg.cm-2.s-1 (based on a maximum intensity of erg.cm-2.sÅ-1).
Like the CN radical, the value of Qmax is similar to the values observed in Halley’s comet from November 1985, ground-based observations (almeida:1992), which had a fainter absolute magnitude than for Echeclus. Consequently the gas-to-dust ratio is much lower than in the cometary comae (if molecular species are present in the Echeclus’ coma).
6 Discussion
The event that happened to Echeclus looks like a cometary outburst. Some other planetary bodies are now known to have suffered a similar event at large heliocentric distance (above 5 AU), nevertheless this outburst presents unusual characteristics that deserve a more detailed discussion: (i) it is unique by its amplitude (about 7 magnitudes); (ii) the heliocentric distance is important for this type of event (12.9 AU); (iii) the coma appears distinct from the object itself for a long time (at least several months); and (iv) the brightness distribution is compatible with a diffuse source. Two different hypotheses might explain these characteristics: (i) the coma is created by a fragment ejected from Echeclus, or (ii) it is created by a previously unknown satellite.
We examine the first hypothesis (a fragment ejected from Echeclus) in more detail. First, no point-like object appears in this coma. From this observational fact, it is possible to derive an upper limit for a point-like object that would be responsible for this cometary activity. We have added the image of a point-like object in the center of the coma with a two-sigma intensity (compared to the standard deviation of the intensity in this area). This intensity corresponds to a magnitude of 25 (R-band). This magnitude, with a geometric albedo of 0.04, corresponds to a diameter of 8.3 km for the considered geocentric and heliocentric distances. With a 1-sigma detection level and a geometric albedo of 0.1 the upper limit for the diameter would be 3.6 km.
The diameter of Echeclus is estimated to be 83.6 km, and its visual geometric albedo to 3.83% (stansberry:2007). These upper limits for a fragment seems to be realistic and of the order of magnitude for a cometary nucleus. The problems raised by a fragment are: (i) the fact that the surface brightness variation does not seem compatible with a point-like source (it does not follow a 1/ law); and (ii) the event responsible for the ejection of this fragment. The point (i) probably implies a fragmentation process, as already pointed out by the color changes with cometocentric distance. Perhaps the matter ejected from the nucleus is more similar to a swarm of dust particules than to an ice fragment.
We also examine the hypothesis of a previously unknown satellite more carefully. With reasonable parameters, i.e. a diameter of 83.6 km, a volumetric mass of 1000 kg.m-3, and a semi-major axis of 60 000 km (the minimum possible distance, because it is the projected distance on the sky), the third Kepler’s law implies an orbital period P20 years. This period could be shorter in the case of a highly eccentric orbit with a smaller semi-major axis, but such an eccentricity would be very unusual. A larger semi-major axis cannot be excluded and would lead to a longer period. In any case, the order of magnitude of such a period is compatible with an apparently motionless object on a timescale of a week.
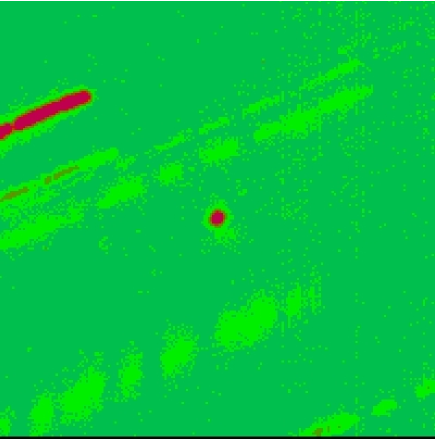
It is also possible to examine the data obtained before the outburst. The best are those obtained with the ESO 3.6-m telescope on April 10, 11 and 12, 2003 (see rousselot:2005a for more details). We have coadded all these data (total integration time of 7.5 hours) and could not find any evidence of a satellite up to (Fig. 10). The apparent magnitude at the time of the observations corresponds to an absolute magnitude of 14.5, i.e. to an upper diameter limit of 7 km (with a R geometric albedo of 0.04). Such an upper limit is compatible with the one derived from the coma itself.
If the cometary activity presently observed is created by a satellite, two issues remain unexplained: (i) what is the origin of the outburst (collision ?); and (ii) why does it appear as a diffuse source ? Other investigators (weissman:2006) have also pointed out the apparent random motion of this source on the timescale of several months, on the basis of their own observations. If such a random motion is confirmed it would exclude the satellite hypothesis.
Finally, the more realistic explanation remains that Echeclus has ejected a fragment. The reason for this ejection remains unclear, and is still to be investigated in more detail. This fragment has probably suffered a disintegration process.
The mechanism responsible for the outburst is probably not a simple impact that would have thrown off dust particules because it would not have lasted several months and some changes would have been apparent at the timescale of a week. As for other similar events observed at large heliocentric distances, a more complex process probably occured. It can be either a CO-driven activity or driven by an amorphous crystalline phase transition for water ice. The onset of activity was probably triggered by an unknown external phenomenon because it did not occur at the smallest heliocentric distance. It is also important to point out that the 2007 observations, which did not permit to detect any activity, were performed at a smaller heliocentric distance.
7 Conclusions
The Centaur (60558) Echeclus, renamed 174P/Echeclus after the discovery of an important cometary outburst, has been observed with FORS 1 at VLT. The main conclusions of our observations are:
The source of cometary activity appears distinct from Echeclus itself (about 8 arscec, corresponding to a projected distance of about 60,000-70,000 km), and stable at the timescale of a week.
The brightness distribution of this source does not follow that of a cometary coma created by a point-like source (cometary nucleus). It look likes a diffuse source.
No cometary emission lines can be detected in the visible range (345-590 nm). The upper detection limit computed for the CN and C2 emission bands, when compared to the overall brightness of the phenomenon, leads to a significantly lower gas-to-dust ratio for Echeclus when compared to the comets observed close to the Sun.
The global Af parameter is equal to about 10,000 cm (R-band, observations of March 23, 2006), corresponding to a global magnitude of 14.40.2. These parameters do not significantly change for the observations conducted on March 30, 2006.
Our observations performed one year later with SUSI 2 at NTT on March 24, 2007, did not permit to detect any cometary activity, despite a smaller heliocentric distance. These observations lead to cm. The phenomenon observed in 2006 seems to be, up to now, unique.
Acknowledgments
The author is grateful to Jean-Marc Zucconi for modeling the CN spectrum.