Cometary activity at 25.7 AU: Hale–Bopp 11 years after perihelion11affiliation: Based on data obtained at the Siding Spring Observatory
Abstract
Eleven years after its perihelion, comet C/1995 O1 (Hale-Bopp) is still active. Between 2007 October 20 and 22, we detected a diffuse coma of 180 km in diameter with a slight elongation toward the north-south direction. The integrated brightness was 2004 in , implying m and albedo dust surface km2. The coma was relatively red at mag, which is consistent with that of the dust in other comets. The observed properties and the overall fading in brightness between 10 AU and 26 AU follow the predicted behaviour of CO-driven activity. This is the most distant cometary activity ever observed.
1 Introduction.
Long-period comets experience little solar exposure and heating, which means they can be used to reveal conditions that existed during the formation and early evolution of the solar system (Delsemme 1977; Lowry & Fitzsimmons 2005). The main evidence supporting this argument is that the post-perihelion activity decreases fast after the cut-off of water sublimation at 3 AU (Fernández 2005), and then the activity usually stops until the next apparition. A few exceptional comets, however, displayed activity far beyond 3 AU, which can be explained by the sublimation of CO, but the processes involved are not well understood (Mazzotta Epifani et al. 2007). Because of this, cometary activity at large heliocentric distances has raised a considerable interest recently, addressing the question of how intact the matter in comets is (Lowry et al. 1999). For example, dust activity throughout the entire orbit could result in a continuous resurfacing of the nucleus, while the surface composition could also be altered. The observed diversity of nucleus colors (Luu 1993; Jewitt 2002) may indicate that this is indeed the case. On the other hand, comets with disguised distant activity will have larger mass loss rate per orbit than we estimate, leading to overestimated comet lifetimes (Lowry et al. 1999; Mazzotta Epifani et al. 2007) and underestimated replenishment rate of the zodiacal dust (Liou et al. 1995).
In recent years, a number of studies reported on short-period comets active between 3 and 7 AU (e.g. Lowry et al. 1999; Lowry & Fitzsimmons 2001, 2005; Lowry & Wiessman 2003; Snodgrass et al. 2006, 2008; Mazzotta Epifani et al. 2006, 2007). These surveys aimed at the investigation of the bared nucleus, but a surprisingly high number of comets showed comae and even dust tails at large ( heliocentric distances, where volatile sublimation is expected to be low. The activity of some long period comets is similar, with ocassionally long dust tails (Szabó et al. 2001, 2002), while 11 Centaur objects are also known with cometary activity (see e.g. Rousselot 2008 and references therein). Chiron is known to be active at solar distances between 8 and 14 AU (Meech et al. 1997), and was seen to display considerable outgassing near aphelion (at 17.8–18.8 AU) between 1969 and 1977 (Bus et al. 2001). Meech et al. (2004) found that the Oort-cloud comet C/1987 H1 (Shoemaker) displayed an extensive tail at all distances between 5 and 18 AU, which is, as of this writing, the most distant example of cometary activity.
Discovered at 7.2 AU from the Sun, C/1995 O1 (Hale–Bopp) has been a prime target for cometary studies. In prediscovery images it had a faint coma 04 in diameter and a total magnitude of 18 (McNaught & Cass 1995), while the dust production rate was kg/s (Fulle et al. 1998) at a solar distance of 13.1 AU. At 7.0 AU, NIR absorption of water ice was detected (Davies et al. 1997). At that time the activity was driven by CO production (Biver et al. 1996, Jewitt et al. 1996), which switched to a water-driven activity at around 3 AU (Biver et al. 1997, Weaver et al. 1997). Approaching the 0.9 AU perihelion distance, the dust production rate was kg/s (Jewitt & Matthews, 1999). The size distribution of the dust, especially in the jets, showed a dominance of m grains, smaller than in any other comets. This was indicated by the unprecedentedly large superheat ( between 1.5–2 [Hayward et al. 2000] or 1.5–1.8 [Grün et al. 2001]), and the scattering albedo and polarization (Hayward et al. 2000). The water production was molecule/s, the largest value ever observed. The dust to gas ratio was very high, between 5 and 10, regardless of the solar distance (Colom et al. 1997, Lisse et al. 1997, Weaver et al. 1999). The production rates observed post-perihelion were similar to those observed pre-perihelion (Capria et al. 2002), foreshadowing long-lasting distant activity. We have indeed detected evidence for cometary activity at 25.7 AU from the Sun; this Letter presents our major findings based on broadband imaging in late 2007.
2 Observations
New observations were taken with the 2.3 m ANU telescope at the Siding Spring Observatory on 2007 October 20, 21 and 22. The solar distance of the comet was 25.7 AU. We took 9240 s exposures in Johnson-Cousins filters with a 22 binned image scale of 067/pixel. The seeing was 20–25 on the three nigths (see Table 1 for exposure data and ephemerides).
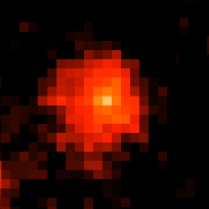
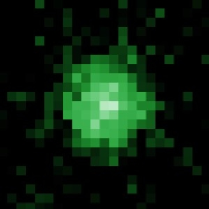
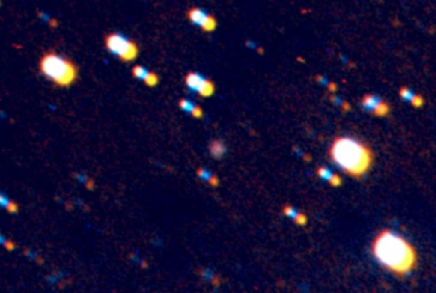
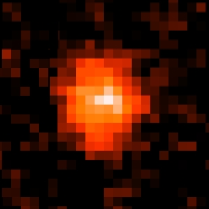
The images were corrected in a standard fashion, including bias and flat-field correction and fringing correction of the images. Every night we aligned and co-added the images by fitting a coordinate grid to the stars, yielding a “star field” image for photometric calibrations. The images were then re-aligned with respect to the proper motion of the comet, to get untrailed “comet” images. In this step, the MPC ephemerides at the time of each observation were used to match the individual frames. Fig. 1 shows the “comet” image on 2007 October 21. The estimated size of the coma is 180 km, slightly elongated north/southward (Fig. 2).
2.1 Photometry
A good proxy to the dust content inside the coma is its brightness, which we have measured by aperture photometry in a single aperture of 14″ across. On October 21, the comet and field stars were calibrated with all-sky photometry using the SA 98 field of Landolt (1992), observed between airmasses 1.17 and 1.65 (Hale–Bopp was at ). Due to the slow apparent motion, we could use the same field stars as local standards on the other two nights as well. The measured brightnesses on October 21 were , . This corresponds to cm, according to the definition by A’Hearn et al. (1984). For comparison, this value is twice as large as that for 29P/Schwassmann-Wachmann 1 in outburst (Szabó et al. 2002), and 3 times larger than for 174P/Echeclus in outburst (Rousselot, 2008).
2.2 Morphology
The observed brightness can be converted to albedo dust surface, (Eddington, 1910), which is the cross section of reflecting particles (, in m2) in the aperture, multiplied by the geometric albedo in the photometric band. It is calculated as
| (1) |
where , the apparent brightness of the Sun, and the phase coefficient is usually assumed to be 0.04. Substituting the measured total brightness yields km2. For comparison, this cross section is 450 times larger than that of the dust cloud ejected in the Deep Impact experiment (e.g. Milani et al. 2007). After calibrating the image flux, the azimuthally averaged comet profile was determined from surface photometry. From this the local filling factor of the dust, , can directly be expressed by replacing with the surface brightness:
| (2) |
that is the measured surface brightness relative to that of a reflecting surface with 1.0 albedo. We found that the surface brightness was 203 in the inner coma, corresponding to , which remained above in the inner 70 000 km (Fig. 3).
3 Discussion
As we describe below, the observations are consistent with a CO-driven activity. Following Fernández (2005), the thermal equilibrium of the absorbed radiation, the emitted radiation and the latent heat lost by sublimation can be written as
| (3) |
where is the radius of the nucleus, is the temperature, is the fraction of the active area, is the gas production rate in molecules/m2/s, and is the latent heat loss per one molecule. CO molecules deposited on CO ice (e.g. inclusions) and CO molecules deposited on H2O can sublimate at large solar distances, due to their high volatility. By neglecting the CO ice inclusions, CO is condensed on water ice, for which J/molecule (Delsemme 1981), and (Mukai et al. 2001). The heat loss of such a nucleus is plotted in Fig. 4 for different values of and as a function of temperature.
The equivalent temperature of a freely sublimating ice globe () at 25.7 AU is 48.0 K, which is slightly less than 54.8 K for a blackbody (), due to the sublimation of molecules/m2/s. This corresponds to molecule/s. If the active area covers 1% of the surface, the equilibrium temperature is 53.1 K, molecule/s/m2, molecule/s. The production rate and the temperature just slightly depend on , thus we can get a reasonable estimate assuming . The thermal velocity of the gas is m/s, which is enough to carry off small dust grains ( is the mass of one CO molecule). The acting drag force where is the size of the dust particle. Particles are carried off if the drag force exceeds the gravitation and are the density of the nucleus and the dust particle, respectively. Thus, the maximum radius of the escaping dust particles is
| (4) |
For an order-of-magnitude estimate we assumed kg/m3 (Capria et al. 2002), kg/m3, km (Meech et al. 2004) or km (Fernández, 2000), leading to m, and s kg/s in the case of the km nucleus and s kg/s if km.
With a more sophisticated model (the surface is dominated by water ice instead of CO on water, the majority of CO is present in inclusions, crystallization heats the nucleus, the nucleus rotates), Capria et al. (2002) predicted molecule/s (equivalent to kg/s) at 25 AU (see Fig. 4 in their paper). Assuming that the dust loading remained high (1–10), the total dust production ranges from 230 to 2300 kg/s. For example, if 500 kg/s dust is produced in the form of 1 m-sized particles, the projected area is 0.25 km2. Assuming a 0.05 albedo results in a 12,000 m2 excess of every second. With these assumptions, the nucleus can produce the observed amount of matter in the coma within 5 days. The measured radius of the coma and the time-scale of dust production needed gives a measure of dust ejection velocity as km days m/s, which is consistent with the thermal gas velocity derived at 25.7 AU.
This self-consistent picture is also supported by the brightness variation of Hale–Bopp between 10 AU and 26 AU. In Fig. 5, we plot the observed brightness of Hale–Bopp (collected from ICQ and MPC bulletins) against the solar distance. For comparison, data for 6 dynamically young Oort-comets are also plotted (Meech et al. 2004). Hale–Bopp was consistently 3–5 magnitudes brighter than these Oort-comets at all distances 15 AU. Beyond that, other comets quickly disappeared as opposed to Hale–Bopp, which kept its slow rate of fading. We also show a theoretical light curve predicted from the CO production curve by Capria et al. (2002), after scaling with and a constant dust loading. The overall agreement indicates that the distant brightness change is consistent with a CO-driven activity.
An alternative explanation of the present activity of Hale–Bopp could be that the light halo is not a real coma but a preserved debris tail (e.g. Jenniskens et al. 1997; Sekanina et al., 2001). Comets with periods over a few thousand years are unlikely to preserve dense debris tail, but, as Lyytinen & Jenniskens (2003) remarks, giant comets such as Hale–Bopp can be exception. At the current position, the orbital path of Hale–Bopp is almost parallel to the line of sight, with only 5∘ inclination and a solar phase angle of 2.2∘. Thus, a hypothetical thin, 1–2 million km long debris tail would appear as a 100–200 thousand km long “tail” in projection, which is approximately the diameter of the light halo around Hale–Bopp. However, this scenario is not likely, because the optically detected dust trails are all very thin, only 10–20 km wide, and their projected images always appear as a thin feature pointing out of the nucleus (Ishuguro et al. 2007; Sarugaku et al. 2007). Our observation of a nearly spherical light halo, with the nucleus approximately in the center, is not compatible with such a dust trail.
4 Conclusion
Comet Hale–Bopp has been the single most significant comet encountered by modern astronomy and 11 years after perihelion it still displays fascinating phenomena. The detected activity can be well explained by theoretical models invoking CO sublimation at large heliocentric distances. Compared to other young Oort-cloud comets, the long-term behaviour of Hale–Bopp seems to suggest genuine differences beyond the difference in nucleus size.
The main results of this paper can be summarized as follows:
-
1.
We detected cometary activity of Hale–Bopp at 25.7 AU, which is the most distant activity detection so far.
-
2.
Our analysis indicates that the extrapolation of the Capria et al. (2002) model works very well for the distant Hale–Bopp, which confirms the physical assumptions of this model.
-
3.
Further observations with 8 m-class telescopes can help constrain the presence of gas in the coma, effects of superheat due to small dust particles, and, ultimately, the cessation of mass loss processes in Hale–Bopp.
References
- (1) A’Hearn, M.F. et al., 1984, AJ, 89, 579
- (2) Biver, N. et al., 1996, Nature, 380, 137
- (3) Biver, N. et al., 1997, Science, 275, 1915
- (4) Bus, S.J., A’Hearn, M.F., Bowell, E., Stern, S.A., 2001, Icarus, 150, 94
- (5) Capria, M.T., Coradini, A., De Sanctis, M.C., 2002, EMP, 90, 217
- (6) Colom, P., Gérard, E, Crovisier, J., Bockelée-Morvan, D., Biver, N., Rauer, H., 1997, EMP, 78, 37
- (7) Davies, J.K. et al., 1997, Icarus, 127, 238
- (8) Delsemme, A.H., 1977, in: Comets, Asteroids, Meteors, (ed. Delsemme, A.H.), Univ. Toledo, Ohio, p. 3
- (9) Delsemme, A.H., 1981, in: Comets (ed. Wilkening, L.L.), Univ. Arizona Press, Tucson, p. 85
- (10) Eddington, A.S., 1910, MNRAS, 70, 442
- (11) Fernández, J.A., 2005, Comets, Astrophysics and Space Library, Springer, Dordrecht, NL
- (12) Fernández, Y.R., 2000, EMP, 89, 3
- (13) Fulle, M., Cremonese, G., Böhm, C., 1998, AJ, 116, 1470
- (14) Grün, E. et al., 2001, A&A, 377, 1098
- (15) Hayward, T.L., Hanner, M.S., Sekanina, Z., 2000, ApJ, 538, 428
- (16) Ishiguro, M. et al., 2007, Icarus, 189, 169
- (17) Jenniskens, P., Betlem, H., de Lignie, L.M., 1997, ApJ, 479, 441
- (18) Jewitt, D., 2002, AJ, 123, 1039
- (19) Jewitt, D. et al., 1996, Science, 271, 1110
- (20) Jewitt, D., Matthews, H., 1999, AJ, 117, 1056
- (21) Landolt, A.U., 1992, AJ, 104, 340
- (22) Liou, J.C., Dermott S.F., Xu Y.L., 1995, P&SS, 43, 717
- (23) Lisse, C.M. et al., 1997, EMP, 78, 251
- (24) Lowry, S.C., Fitzsimmons, A., Cartwright I.M., Williams, I.P., 1999, A&A, 349, 649
- (25) Lowry, S.C., Fitzsimmons, A., 2001, A&A, 365, 204
- (26) Lowry, S.C., Weissman P.R., 2003, Icarus, 164, 492
- (27) Lowry, S.C., Fitzsimmons, A., 2005, MNRAS, 358, 641
- (28) Luu, J.X., 1993, Icarus, 104, 138
- (29) Lyytinen, E., Jenniskens, P., 2003, Icarus, 162, 443
- (30) Mazzotta Epifani, E., Palumbo, P., Capria, M.T., Cremonese, G., Fulle, M., Colangeli, L., 2006, A&A, 460, 935
- (31) Mazzotta Epifani, E., Palumbo, P., Capria, M.T., Cremonese, G., Fulle, M., Colangeli, L., 2007, MNRAS, 381, 713
- (32) McNaught, R.H., Cass, C.P., 1995, IAU Circ., 6198
- (33) Meech, K.J., Buie, M.W., Samarasinha, N.H., Mueller, B.E.A., Belton, M.J.S., 1997, AJ, 113, 844
- (34) Meech, K.J., Hainaut, O.R., Marsden, B.G., 2004, Icarus, 170, 463
- (35) Milani, G.A. et al., 2007, Icarus, 187, 276
- (36) Mukai, T. et al., 2001, in: Interplanetary dust (ed. Grünn, E., Gustafson, B.A., Dermott, S.F., Fechtig, H.), Springer, Heidelberg, p. 445
- (37) Rousselot, P., 2008, A&A, in press
- (38) Sarugaku, Y. et al., 2007, PASJ, 59, L25
- (39) Sekanina, Z., Hanner, M. S., Jessberger, E. K., Fomenkova, M. N., 2001, in: Interplanetary dust, (ed. Grünn, E., Gustafson, B.A., Dermott, S.F., Fechtig, H.), Springer, Heidelberg, p. 90
- (40) Snodgrass, C., Lowry, S.C., Fitzsimmons, A., 2006, MNRAS, 373, 1590
- (41) Snodgrass, C., Lowry, S.C., Fitzsimmons, A., 2008, MNRAS, accepted, arXiv:0712.4204
- (42) Szabó, Gy.M., Csák, B., Sárneczky, K., Kiss, L.L., 2001, A&A, 374, 712
- (43) Szabó, Gy.M., Kiss, L.L., Sárneczky, K., Sziládi, K., 2002, A&A, 384, 702
- (44) Weaver, H.A. et al., 1997, Science, 275, 1900
- (45) Weaver, H.A. et al., 1999, Icarus, 141, 1
| Date (UT) | RA | Dec | R [AU] | [AU] | E | V exp (s) | S(″) | R exp (s) | S(″) | |||
|---|---|---|---|---|---|---|---|---|---|---|---|---|
| 2007-Oct-20 | 04 11 58.98 | 86 27 28.7 | 280.76 | 70.31 | 25.75 | 25.86 | 82.69 | 2.20 | — | — | 9240 | 2.5 |
| 2007-Oct-21 | 04 09 56.22 | 86 28 46.5 | 280.76 | 70.31 | 25.76 | 25.87 | 82.37 | 2.20 | 9240 | 2.0 | 9240 | 2.1 |
| 2007-Oct-22 | 04 07 53.57 | 86 30 04.2 | 280.76 | 70.31 | 25.77 | 25.88 | 81.98 | 2.20 | — | — | 9240 | 2.2 |
Oct 20 Oct 21
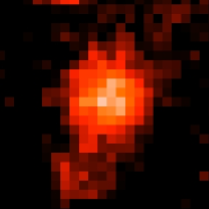
Oct 22 Oct 21, V