B. Aubert
M. Bona
Y. Karyotakis
J. P. Lees
V. Poireau
X. Prudent
V. Tisserand
A. Zghiche
Laboratoire de Physique des Particules, IN2P3/CNRS et Université de Savoie, F-74941 Annecy-Le-Vieux, France
J. Garra Tico
E. Grauges
Universitat de Barcelona, Facultat de Fisica, Departament ECM, E-08028 Barcelona, Spain
L. Lopez
A. Palano
M. Pappagallo
Università di Bari, Dipartimento di Fisica and INFN, I-70126 Bari, Italy
G. Eigen
B. Stugu
L. Sun
University of Bergen, Institute of Physics, N-5007 Bergen, Norway
G. S. Abrams
M. Battaglia
D. N. Brown
J. Button-Shafer
R. N. Cahn
R. G. Jacobsen
J. A. Kadyk
L. T. Kerth
Yu. G. Kolomensky
G. Kukartsev
G. Lynch
I. L. Osipenkov
M. T. Ronan
K. Tackmann
T. Tanabe
W. A. Wenzel
Lawrence Berkeley National Laboratory and University of California, Berkeley, California 94720, USA
C. M. Hawkes
N. Soni
A. T. Watson
University of Birmingham, Birmingham, B15 2TT, United Kingdom
H. Koch
T. Schroeder
Ruhr Universität Bochum, Institut für Experimentalphysik 1, D-44780 Bochum, Germany
D. Walker
University of Bristol, Bristol BS8 1TL, United Kingdom
D. J. Asgeirsson
T. Cuhadar-Donszelmann
B. G. Fulsom
C. Hearty
T. S. Mattison
J. A. McKenna
University of British Columbia, Vancouver, British Columbia, Canada V6T 1Z1
M. Barrett
A. Khan
M. Saleem
L. Teodorescu
Brunel University, Uxbridge, Middlesex UB8 3PH, United Kingdom
V. E. Blinov
A. D. Bukin
A. R. Buzykaev
V. P. Druzhinin
V. B. Golubev
A. P. Onuchin
S. I. Serednyakov
Yu. I. Skovpen
E. P. Solodov
K. Yu. Todyshev
Budker Institute of Nuclear Physics, Novosibirsk 630090, Russia
M. Bondioli
S. Curry
I. Eschrich
D. Kirkby
A. J. Lankford
P. Lund
M. Mandelkern
E. C. Martin
D. P. Stoker
University of California at Irvine, Irvine, California 92697, USA
S. Abachi
C. Buchanan
University of California at Los Angeles, Los Angeles, California 90024, USA
J. W. Gary
F. Liu
O. Long
B. C. Shen
G. M. Vitug
Z. Yasin
L. Zhang
University of California at Riverside, Riverside, California 92521, USA
H. P. Paar
S. Rahatlou
V. Sharma
University of California at San Diego, La Jolla, California 92093, USA
C. Campagnari
T. M. Hong
D. Kovalskyi
M. A. Mazur
J. D. Richman
University of California at Santa Barbara, Santa Barbara, California 93106, USA
T. W. Beck
A. M. Eisner
C. J. Flacco
C. A. Heusch
J. Kroseberg
W. S. Lockman
T. Schalk
B. A. Schumm
A. Seiden
M. G. Wilson
L. O. Winstrom
University of California at Santa Cruz, Institute for Particle Physics, Santa Cruz, California 95064, USA
E. Chen
C. H. Cheng
D. A. Doll
B. Echenard
F. Fang
D. G. Hitlin
I. Narsky
T. Piatenko
F. C. Porter
California Institute of Technology, Pasadena, California 91125, USA
R. Andreassen
G. Mancinelli
B. T. Meadows
K. Mishra
M. D. Sokoloff
University of Cincinnati, Cincinnati, Ohio 45221, USA
F. Blanc
P. C. Bloom
W. T. Ford
J. F. Hirschauer
A. Kreisel
M. Nagel
U. Nauenberg
A. Olivas
J. G. Smith
K. A. Ulmer
S. R. Wagner
University of Colorado, Boulder, Colorado 80309, USA
R. Ayad
Now at Temple University, Philadelphia, PA 19122, USA
A. M. Gabareen
A. Soffer
Now at Tel Aviv University, Tel Aviv, 69978, Israel
W. H. Toki
R. J. Wilson
Colorado State University, Fort Collins, Colorado 80523, USA
D. D. Altenburg
E. Feltresi
A. Hauke
H. Jasper
M. Karbach
J. Merkel
A. Petzold
B. Spaan
K. Wacker
Universität Dortmund, Institut für Physik, D-44221 Dortmund, Germany
V. Klose
M. J. Kobel
H. M. Lacker
W. F. Mader
R. Nogowski
J. Schubert
K. R. Schubert
R. Schwierz
J. E. Sundermann
A. Volk
Technische Universität Dresden, Institut für Kern- und Teilchenphysik, D-01062 Dresden, Germany
D. Bernard
G. R. Bonneaud
E. Latour
Ch. Thiebaux
M. Verderi
Laboratoire Leprince-Ringuet, CNRS/IN2P3, Ecole Polytechnique, F-91128 Palaiseau, France
P. J. Clark
W. Gradl
S. Playfer
A. I. Robertson
J. E. Watson
University of Edinburgh, Edinburgh EH9 3JZ, United Kingdom
M. Andreotti
D. Bettoni
C. Bozzi
R. Calabrese
A. Cecchi
G. Cibinetto
P. Franchini
E. Luppi
M. Negrini
A. Petrella
L. Piemontese
E. Prencipe
V. Santoro
Università di Ferrara, Dipartimento di Fisica and INFN, I-44100 Ferrara, Italy
F. Anulli
R. Baldini-Ferroli
A. Calcaterra
R. de Sangro
G. Finocchiaro
S. Pacetti
P. Patteri
I. M. Peruzzi
Also with Università di Perugia, Dipartimento di Fisica, Perugia, Italy
M. Piccolo
M. Rama
A. Zallo
Laboratori Nazionali di Frascati dell’INFN, I-00044 Frascati, Italy
A. Buzzo
R. Contri
M. Lo Vetere
M. M. Macri
M. R. Monge
S. Passaggio
C. Patrignani
E. Robutti
A. Santroni
S. Tosi
Università di Genova, Dipartimento di Fisica and INFN, I-16146 Genova, Italy
K. S. Chaisanguanthum
M. Morii
Harvard University, Cambridge, Massachusetts 02138, USA
R. S. Dubitzky
J. Marks
S. Schenk
U. Uwer
Universität Heidelberg, Physikalisches Institut, Philosophenweg 12, D-69120 Heidelberg, Germany
D. J. Bard
P. D. Dauncey
J. A. Nash
W. Panduro Vazquez
M. Tibbetts
Imperial College London, London, SW7 2AZ, United Kingdom
P. K. Behera
X. Chai
M. J. Charles
U. Mallik
University of Iowa, Iowa City, Iowa 52242, USA
J. Cochran
H. B. Crawley
L. Dong
V. Eyges
W. T. Meyer
S. Prell
E. I. Rosenberg
A. E. Rubin
Iowa State University, Ames, Iowa 50011-3160, USA
Y. Y. Gao
A. V. Gritsan
Z. J. Guo
C. K. Lae
Johns Hopkins University, Baltimore, Maryland 21218, USA
A. G. Denig
M. Fritsch
G. Schott
Universität Karlsruhe, Institut für Experimentelle Kernphysik, D-76021 Karlsruhe, Germany
N. Arnaud
J. Béquilleux
A. D’Orazio
M. Davier
J. Firmino da Costa
G. Grosdidier
A. Höcker
V. Lepeltier
F. Le Diberder
A. M. Lutz
S. Pruvot
P. Roudeau
M. H. Schune
J. Serrano
V. Sordini
A. Stocchi
W. F. Wang
G. Wormser
Laboratoire de l’Accélérateur Linéaire, IN2P3/CNRS et Université Paris-Sud 11, Centre Scientifique d’Orsay, B. P. 34, F-91898 ORSAY Cedex, France
D. J. Lange
D. M. Wright
Lawrence Livermore National Laboratory, Livermore, California 94550, USA
I. Bingham
J. P. Burke
C. A. Chavez
J. R. Fry
E. Gabathuler
R. Gamet
D. E. Hutchcroft
D. J. Payne
C. Touramanis
University of Liverpool, Liverpool L69 7ZE, United Kingdom
A. J. Bevan
K. A. George
F. Di Lodovico
R. Sacco
M. Sigamani
Queen Mary, University of London, E1 4NS, United Kingdom
G. Cowan
H. U. Flaecher
D. A. Hopkins
S. Paramesvaran
F. Salvatore
A. C. Wren
University of London, Royal Holloway and Bedford New College, Egham, Surrey TW20 0EX, United Kingdom
D. N. Brown
C. L. Davis
University of Louisville, Louisville, Kentucky 40292, USA
K. E. Alwyn
N. R. Barlow
R. J. Barlow
Y. M. Chia
C. L. Edgar
G. D. Lafferty
T. J. West
J. I. Yi
University of Manchester, Manchester M13 9PL, United Kingdom
J. Anderson
C. Chen
A. Jawahery
D. A. Roberts
G. Simi
J. M. Tuggle
University of Maryland, College Park, Maryland 20742, USA
C. Dallapiccola
S. S. Hertzbach
X. Li
E. Salvati
S. Saremi
University of Massachusetts, Amherst, Massachusetts 01003, USA
R. Cowan
D. Dujmic
P. H. Fisher
K. Koeneke
G. Sciolla
M. Spitznagel
F. Taylor
R. K. Yamamoto
M. Zhao
Massachusetts Institute of Technology, Laboratory for Nuclear Science, Cambridge, Massachusetts 02139, USA
S. E. Mclachlin
P. M. Patel
S. H. Robertson
McGill University, Montréal, Québec, Canada H3A 2T8
A. Lazzaro
V. Lombardo
F. Palombo
Università di Milano, Dipartimento di Fisica and INFN, I-20133 Milano, Italy
J. M. Bauer
L. Cremaldi
V. Eschenburg
R. Godang
R. Kroeger
D. A. Sanders
D. J. Summers
H. W. Zhao
University of Mississippi, University, Mississippi 38677, USA
S. Brunet
D. Côté
M. Simard
P. Taras
F. B. Viaud
Université de Montréal, Physique des Particules, Montréal, Québec, Canada H3C 3J7
H. Nicholson
Mount Holyoke College, South Hadley, Massachusetts 01075, USA
G. De Nardo
L. Lista
D. Monorchio
C. Sciacca
Università di Napoli Federico II, Dipartimento di Scienze Fisiche and INFN, I-80126, Napoli, Italy
M. A. Baak
G. Raven
H. L. Snoek
NIKHEF, National Institute for Nuclear Physics and High Energy Physics, NL-1009 DB Amsterdam, The Netherlands
C. P. Jessop
K. J. Knoepfel
J. M. LoSecco
University of Notre Dame, Notre Dame, Indiana 46556, USA
G. Benelli
L. A. Corwin
K. Honscheid
H. Kagan
R. Kass
J. P. Morris
A. M. Rahimi
J. J. Regensburger
S. J. Sekula
Q. K. Wong
Ohio State University, Columbus, Ohio 43210, USA
N. L. Blount
J. Brau
R. Frey
O. Igonkina
J. A. Kolb
M. Lu
R. Rahmat
N. B. Sinev
D. Strom
J. Strube
E. Torrence
University of Oregon, Eugene, Oregon 97403, USA
G. Castelli
N. Gagliardi
A. Gaz
M. Margoni
M. Morandin
M. Posocco
M. Rotondo
F. Simonetto
R. Stroili
C. Voci
Università di Padova, Dipartimento di Fisica and INFN, I-35131 Padova, Italy
P. del Amo Sanchez
E. Ben-Haim
H. Briand
G. Calderini
J. Chauveau
P. David
L. Del Buono
O. Hamon
Ph. Leruste
J. Malclès
J. Ocariz
A. Perez
J. Prendki
Laboratoire de Physique Nucléaire et de Hautes Energies, IN2P3/CNRS, Université Pierre et Marie Curie-Paris6, Université Denis Diderot-Paris7, F-75252 Paris, France
L. Gladney
University of Pennsylvania, Philadelphia, Pennsylvania 19104, USA
M. Biasini
R. Covarelli
E. Manoni
Università di Perugia, Dipartimento di Fisica and INFN, I-06100 Perugia, Italy
C. Angelini
G. Batignani
S. Bettarini
M. Carpinelli
Also with Universita’ di Sassari, Sassari, Italy
A. Cervelli
F. Forti
M. A. Giorgi
A. Lusiani
G. Marchiori
M. Morganti
N. Neri
E. Paoloni
G. Rizzo
J. J. Walsh
Università di Pisa, Dipartimento di Fisica, Scuola Normale Superiore and INFN, I-56127 Pisa, Italy
J. Biesiada
Y. P. Lau
D. Lopes Pegna
C. Lu
J. Olsen
A. J. S. Smith
A. V. Telnov
Princeton University, Princeton, New Jersey 08544, USA
E. Baracchini
G. Cavoto
D. del Re
E. Di Marco
R. Faccini
F. Ferrarotto
F. Ferroni
M. Gaspero
P. D. Jackson
M. A. Mazzoni
S. Morganti
G. Piredda
F. Polci
F. Renga
C. Voena
Università di Roma La Sapienza, Dipartimento di Fisica and INFN, I-00185 Roma, Italy
M. Ebert
T. Hartmann
H. Schröder
R. Waldi
Universität Rostock, D-18051 Rostock, Germany
T. Adye
B. Franek
E. O. Olaiya
W. Roethel
F. F. Wilson
Rutherford Appleton Laboratory, Chilton, Didcot, Oxon, OX11 0QX, United Kingdom
S. Emery
M. Escalier
A. Gaidot
S. F. Ganzhur
G. Hamel de Monchenault
W. Kozanecki
G. Vasseur
Ch. Yèche
M. Zito
DSM/Dapnia, CEA/Saclay, F-91191 Gif-sur-Yvette, France
X. R. Chen
H. Liu
W. Park
M. V. Purohit
R. M. White
J. R. Wilson
University of South Carolina, Columbia, South Carolina 29208, USA
M. T. Allen
D. Aston
R. Bartoldus
P. Bechtle
J. F. Benitez
R. Cenci
J. P. Coleman
M. R. Convery
J. C. Dingfelder
J. Dorfan
G. P. Dubois-Felsmann
W. Dunwoodie
R. C. Field
T. Glanzman
S. J. Gowdy
M. T. Graham
P. Grenier
C. Hast
W. R. Innes
J. Kaminski
M. H. Kelsey
H. Kim
P. Kim
M. L. Kocian
D. W. G. S. Leith
S. Li
B. Lindquist
S. Luitz
V. Luth
H. L. Lynch
D. B. MacFarlane
H. Marsiske
R. Messner
D. R. Muller
H. Neal
S. Nelson
C. P. O’Grady
I. Ofte
A. Perazzo
M. Perl
B. N. Ratcliff
A. Roodman
A. A. Salnikov
R. H. Schindler
J. Schwiening
A. Snyder
D. Su
M. K. Sullivan
K. Suzuki
S. K. Swain
J. M. Thompson
J. Va’vra
A. P. Wagner
M. Weaver
W. J. Wisniewski
M. Wittgen
D. H. Wright
H. W. Wulsin
A. K. Yarritu
K. Yi
C. C. Young
V. Ziegler
Stanford Linear Accelerator Center, Stanford, California 94309, USA
P. R. Burchat
A. J. Edwards
S. A. Majewski
T. S. Miyashita
B. A. Petersen
L. Wilden
Stanford University, Stanford, California 94305-4060, USA
S. Ahmed
M. S. Alam
R. Bula
J. A. Ernst
B. Pan
M. A. Saeed
S. B. Zain
State University of New York, Albany, New York 12222, USA
S. M. Spanier
B. J. Wogsland
University of Tennessee, Knoxville, Tennessee 37996, USA
R. Eckmann
J. L. Ritchie
A. M. Ruland
C. J. Schilling
R. F. Schwitters
University of Texas at Austin, Austin, Texas 78712, USA
J. M. Izen
X. C. Lou
S. Ye
University of Texas at Dallas, Richardson, Texas 75083, USA
F. Bianchi
D. Gamba
M. Pelliccioni
Università di Torino, Dipartimento di Fisica Sperimentale and INFN, I-10125 Torino, Italy
M. Bomben
L. Bosisio
C. Cartaro
F. Cossutti
G. Della Ricca
L. Lanceri
L. Vitale
Università di Trieste, Dipartimento di Fisica and INFN, I-34127 Trieste, Italy
V. Azzolini
N. Lopez-March
F. Martinez-Vidal
D. A. Milanes
A. Oyanguren
IFIC, Universitat de Valencia-CSIC, E-46071 Valencia, Spain
J. Albert
Sw. Banerjee
B. Bhuyan
K. Hamano
R. Kowalewski
I. M. Nugent
J. M. Roney
R. J. Sobie
University of Victoria, Victoria, British Columbia, Canada V8W 3P6
T. J. Gershon
P. F. Harrison
J. Ilic
T. E. Latham
G. B. Mohanty
Department of Physics, University of Warwick, Coventry CV4 7AL, United Kingdom
H. R. Band
X. Chen
S. Dasu
K. T. Flood
P. E. Kutter
Y. Pan
M. Pierini
R. Prepost
C. O. Vuosalo
S. L. Wu
University of Wisconsin, Madison, Wisconsin 53706, USA
Abstract
The properties of the resonance are investigated in the decay process.
The data sample was collected with the BABAR detector at
the SLAC PEP-II asymmetric-energy collider operating at center
of mass energies 10.58 and 10.54 GeV. The corresponding integrated
luminosity is approximately 230 fb-1.
The spin of the is established to be 3/2. The existence of an
-wave amplitude in the system is inferred, and its interference with the
amplitude provides the first clear demonstration of the Breit-Wigner phase motion
expected for the . The Legendre polynomial
moment indicates the presence of a significant -wave amplitude for mass values above 1.6 GeV/c2,
and a dip in the mass distribution at approximately 1.7 GeV/c2 is interpreted as due to coherent addition
of a contribution to this amplitude. This would imply for the .
Attempts at fitting the lineshape yield unsatisfactory results, and this failure is attributed to interference effects
associated with the amplitudes describing the and/or systems.
The is the only cascade resonance whose properties are reasonably well understood.
It decays 100% to and 4% to PDG2006 , and its
mass (PDG fit: MeV/c2) and width (PDG fit: MeV/c)
are reasonably well known PDG2006 .
A spin-parity analysis of data on the reactions
carried out by Schlein et al.ref:schlein
showed that (i.e., -wave) or (i.e., -wave) is favored, and that the data are
consistent with ;
however, they stated that spin is not required, and on this basis concluded that .
This conclusion was supported by Button-Schafer et al.ref:button
in a similar analysis.
Both experiments ruled out , but the claim that was not required
was the basis for the conclusion that .
In the present paper, the spin analysis procedures described in Ref. ref:omesp
are extended to the quasi-two-body decay ,
for which the invariant mass distribution exhibits a dominant signal cc .
Under the assumption that the has spin 1/2, it is established that the has spin 3/2.
On the basis of the analyses of Refs. ref:schlein ; ref:button ,
it follows that positive parity is established.
The data sample and event selection procedures are described
in Section II, and the spin measurement is
presented in Section III. In Section IV, the amplitude
structure in the region is investigated in
some detail, and this is followed by an examination of the
system at higher mass values in Section V. The
unsuccessful attempts at precise measurements of the mass
and width of the are presented in Section VI,
and their implications considered. Finally, the conclusions
drawn from this analysis are summarized in Section VII.
II THE BABAR DETECTOR AND EVENT SELECTION
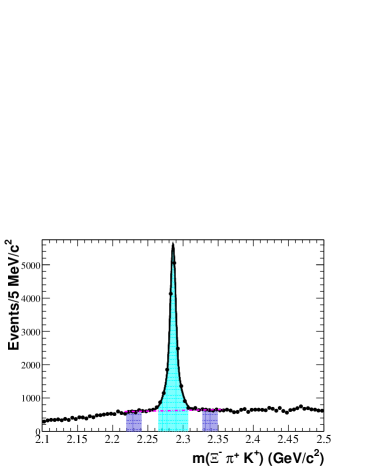
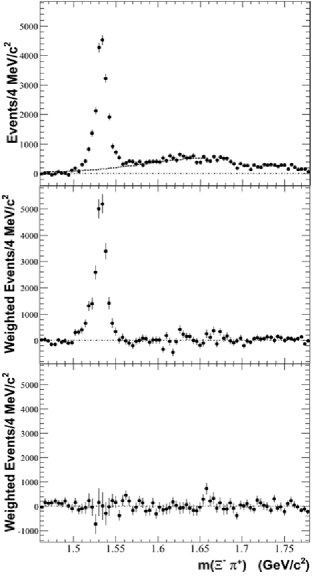
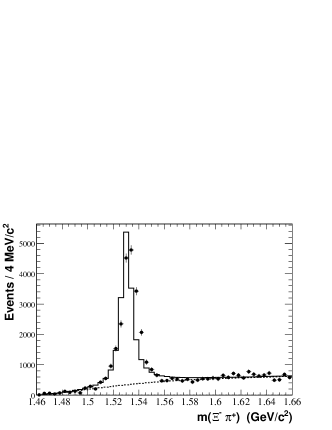
Figure 1: (a) The uncorrected
invariant mass spectrum.
The curve results from the fit described in the text. The dot-dashed line indicates the fitted background contribution.
The shaded areas delimit the signal (light area) and mass-sideband (dark area) regions.
(b) The uncorrected -mass-sideband-subtracted invariant mass projection for candidates.
In each figure, the points
with error bars represent the data.
The data sample used for this analysis was collected with the BABAR detector
at the PEP-II asymmetric-energy collider operating at center-of-mass (c.m.) energies 10.58 and
10.54 GeV, and corresponds to a total integrated luminosity of
about 230 fb-1.
Charged particles are detected with a five-layer, double-sided
silicon vertex tracker (SVT) and a 40-layer drift chamber (DCH) with a
helium-isobutane gas mixture, placed in a 1.5-T solenoidal field produced
by a superconducting magnet. The charged-particle momentum resolution
is approximately , where is the transverse momentum in GeV/c.
The SVT, with a typical
single-hit resolution of 10 m, measures the impact
parameters of charged-particle tracks in both the plane transverse to
the beam direction and along the collision axis.
Charged-particle types are identified from the ionization energy loss
(dE/dx) measured in the DCH and SVT, and from the Cherenkov radiation
detected in a ring-imaging Cherenkov device. Photons are
detected by a CsI(Tl) electromagnetic calorimeter with an
energy resolution .
The return yoke of the superconducting coil is instrumented with
resistive plate chambers for the identification and muons and the
detection of neutral hadrons.
The detector is described
in detail in Ref. ref:babar .
The selection of candidates requires
the intermediate reconstruction of events consistent with and
.
Particle identification (PID) selectors
based on specific energy loss () and Cherenkov angle measurements are used to identify
the proton, pion, and kaon final state tracks ref:babar .
Each intermediate state candidate
is required to have invariant mass within a window centered on the fitted peak position of the relevant distribution,
where is the mass resolution obtained from the fit.
A fit is then performed to the complete decay topology with the and candidates constrained
to their known mass values PDG2006 . The fit probability is required to be greater than 0.001 in order
to ensure simultaneous satisfaction of the topological and mass constraint requirements; this reduces combinatorial
background significantly and retains good signal efficiency.
Since each weakly-decaying intermediate state (i.e., hyperon) is long-lived,
an improvement of the signal-to-background ratio is
achieved by requiring that the decay vertex of each hyperon be
displaced from its point of origin in the direction of its momentum
vector.
The distance between the vertex and the
decay vertex in the plane perpendicular to the collision axis must
exceed 1.5 mm in the direction, and the distance between the and decay
vertices must exceed 1.5 mm in the direction of the momentum vector.
Finally, the momentum of the candidate in the c.m.
frame is required to be greater than GeV,
since it is found empirically that this significantly reduces combinatorial background.
The invariant mass spectrum of candidates which satisfy
these selection criteria
before efficiency correction is shown in Fig. 1(a).
A signal yield of events is obtained
from a fit which makes use of a signal function consisting of two Gaussians with a common center
and a linear background function to the mass region 2.225 - 2.360 GeV/c2. The
fit yields half-width-half-maximum 5.1 MeV/c2 and has chi-squared per degree of
freedom (/NDF) .
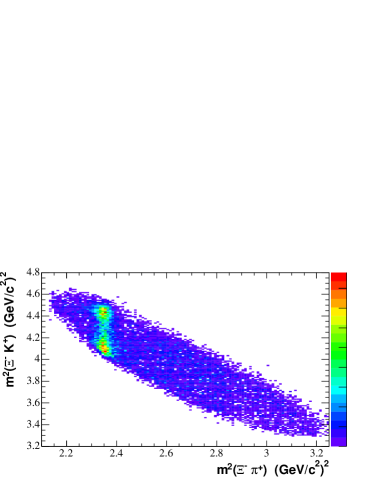
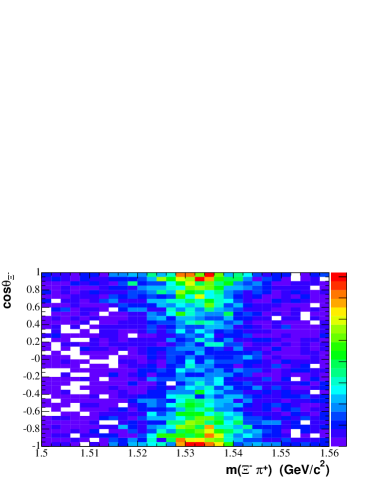
Figure 2: (a) The Dalitz plot of versus invariant mass-squared for the signal region.
(b) The corresponding rectangular Dalitz plot for the mass region. (The online version of this figure is in color.)
III SPIN MEASUREMENT
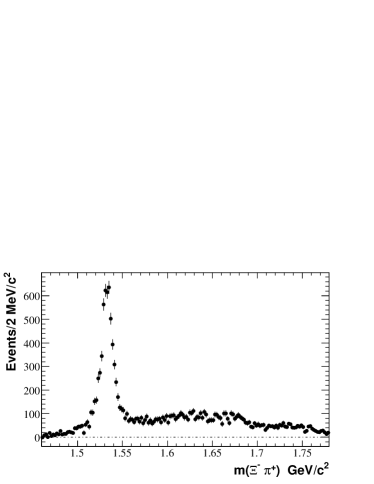
Figure 3: The efficiency-corrected -mass-sideband-subtracted
(a) ,
(b) and (c)
moments of the system invariant mass distribution for the signal region.
In (a) the dashed curve represents the estimated background contribution in the region, obtained as
described in the text.
The Dalitz plot for (Fig. 2) is dominated by the contribution from
, where is a strong decay.
There is evidence for only one resonant structure, seen as the clear band at the nominal mass squared of
the .
The background events in the signal region of Fig.1(a) are
represented by the events from the combined
sideband regions indicated in this figure, which correspond
to the same mass range sig . A corrected distribution associated
with the signal is obtained by subtraction (bin-by-bin) of the
corresponding distribution for the sidebands from that for
the signal region. This procedure is described as
“sideband subtraction”, and assumes linear mass dependence
of the background.
The sideband-subtracted projection of the invariant mass
for the signal region of Fig. 1 (a) is shown in Fig. 1 (b).
The helicity
formalism ref:form ; ref:form2 is applied to the quasi-two-body decay
in order to examine the implications of various spin hypotheses
for the angular distribution of the from decay, under the assumption
that the mass region is dominated by a single spin state.
As in Ref. ref:omesp , it is assumed that the spin of the charm baryon is 1/2.
The choice of spin quantization axis along
the direction of the in the charm baryon rest-frame (r.f.) has the result that
the inherits the spin
projection of the charm baryon, since any orbital angular momentum in the charm baryon decay has no projection in this direction.
It follows that, regardless of the spin of the , the density matrix which describes the sample is
diagonal, with non-zero values only for the spin projection elements,
i.e., the helicity of the can take only the values . Since the final state and
have spin values 1/2 and 0, respectively, the net final state helicity also can take only the values .
The helicity angle is defined as the angle between the direction of the in the r.f. of the
and the quantization axis.
Following the formalism of Ref. ref:omesp , the angular distribution of the is then given by the total intensity,
(1)
where the () are the diagonal density matrix elements
inherited from the charm baryon, and the sum is over all initial and final helicity states.
The transition matrix element
represents the coupling of the to the final state,
is an element of the Wigner rotation matrix ref:form3 , and the
denotes complex conjugation.
The resulting angular distribution integrated
over is obtained for spin hypotheses , and , respectively, as follows:
(2)
(3)
(4)
The coefficient of the asymmetric term,
is zero as a consequence of parity conservation in the strong decay of to ,
which implies .
It should be noted that Eqs. 2-4 do not depend on any assumption as to
the parity of the .
The normalized angular distribution of the obtained from Eq. 1, and
expressed explicitly in Eqs. 2-4 for and 5/2, respectively, can be written in general as
(5)
where , the value of each expansion coefficient depends on ,
and, if is odd,
The Legendre Polynomials satisfy
(6)
(i.e., where is a
spherical harmonic function),
so that
(7)
For a data distribution containing events, the left-hand side
of Eq. 7 is approximately equal to
since for large , the sum over the observed events provides a good approximation to the integral;
throughout this paper, this summation is termed “the moment”
or simply ‘the moment” of the data.
Each assumption for defines , so that for and the
are calculable.
For , with the corresponding
values , and , respectively.
The relation
(8)
implies that the number
of signal events in a given mass interval
is well-approximated if each event is given weight
(9)
after efficiency correction eff and background subtraction.
Since the angular distribution shown in Fig. 2(b) is clearly not flat, spin 1/2 is ruled out.
In order to test the hypothesis, each event is given a weight
().
Figure 3(a) shows the distribution of the moment
which is just the efficiency-corrected distribution corresponding to Fig. 1(b) (the average efficiency is %).
The and moments are shown in
Figs. 3(b) and 3(c), respectively.
Figure 3(b) indicates that spin 3/2 is strongly favored, as essentially all of the signal is retained.
In contrast, the moment shown in Fig. 3(c)
is consistent with zero in the signal region, so that spin 5/2 is clearly ruled out.
The results for (not shown) are similar to those of Fig 3(c).
In order to quantify these results, the region GeV/c2 is defined as the signal
region. The dashed curve of Fig. 3(a) corresponds to a fit
to the region GeV/c2 with the signal region excluded;
the fit function is a third order polynomial multiplied by phase space.
This yields an estimated signal of events.
For Figs. 3(b) and (c), the moment sums for the signal region are and
, respectively. Clearly, is the only viable spin value.
It follows that, based on the results of Refs. ref:schlein ; ref:button (i.e., or ),
the present analysis, which shows that , also establishes positive parity, and that the system which results
from the decay is in a -wave orbital angular momentum state.
Here, and in Refs. ref:schlein ; ref:button , it is assumed that the
has positive parity PDG2006 .
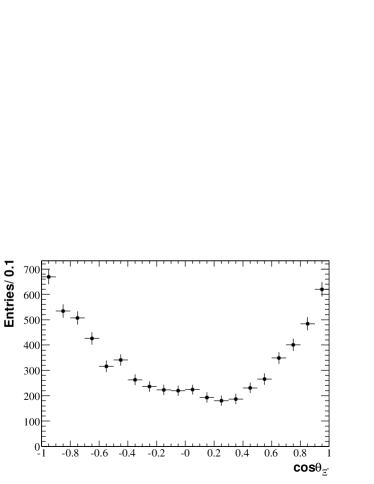
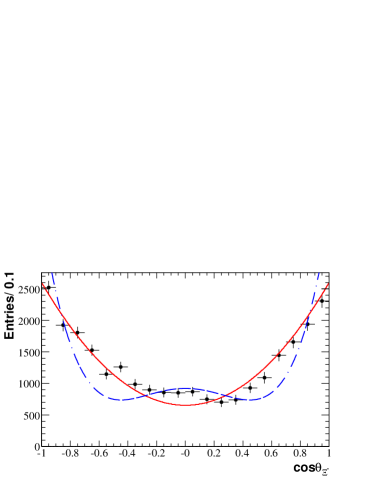
Figure 4: The cos distribution for data
in the
signal region (a) before, and (b) after, efficiency correction.
The solid (dashed) curve corresponds to the parametrization of the angular distribution for
the assumption of pure spin 3/2 (5/2).
IV THE MASS REGION
Although Fig. 3 clearly establishes spin 3/2 for the , the analysis of the system
described in the remainder of this paper indicates that a detailed understanding of the data is much less straightforward than
Fig. 3 might indicate.
If the momentum of the in the r.f. is denoted by , a
Breit-Wigner (BW) amplitude corresponding to orbital angular momentum should be proportional to the centrifugal barrier
factor blatt . The lineshape for a -wave BW should then be skewed toward high mass values.
However, the distribution of Fig. 3(b), which should represent the square of a -wave amplitude, appears
to be skewed toward low mass values, in contradiction of this expectation.
Furthermore, if the distribution in Fig. 3(a) is considered to
represent a sum of squares of amplitudes, for which that in Fig. 3(b) represents the contribution, their
difference would be expected to behave like the background distribution in Fig. 3(a) in the region. However, the
signal in Fig. 3(b) contains events more than that in
Fig. 3(a), as indicated above, so that when the former is subtracted from the latter, the residual
distribution exhibits a strong dip in the region, and even reaches negative values. This behavior is clearly at odds
with a simple interpretation of these distributions.
Moreover, the cos distribution in the signal
region indicates that a description in terms of a single
amplitude corresponding to a resonant structure is an over-simplification.
The mass-sideband-subtracted cos distribution for the signal
region (Fig. 4) exhibits a
predominantly quadratic behavior, which indicates clearly that the spin of the
is not 1/2. A function (solid curve of Fig. 4(b), the
parametrization of Eq. 3) which corresponds to for the fits the data best,
although there are clear deviations from the curve, and the fit confidence level (c.l.) is only 0.0003.
The fit with the parametrization which corresponds to (dashed curve, Eq. 4) is extremely poor, with c.l. ,
as would be expected from the projection of Fig. 3(c).
In addition, the distribution of Fig. 4(b) exhibits signs of forward-backward asymmetry.
The above symptoms indicate that a more complicated description is required if a quantitative
understanding of the system is to be achieved.
Strong interactions in the system may give rise to interference
between the resonant -wave amplitude and other
amplitudes. Evidence for interference is seen in the behavior of
the moment of the system as a function of invariant mass.
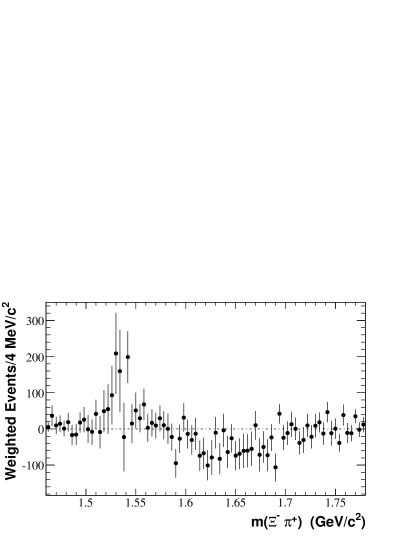
The distribution shown in Fig. 5 is consistent with the interference pattern resulting from the
rapid oscillation due to -wave BW phase motion
in the presence of an amplitude with small slowly varying relative phase;
the projection would then approximate the real part of the BW amplitude, as observed.
The oscillatory pattern seen in Fig. 5
is not observed for the high and low mass sideband regions,
which confirms that the pattern is indeed due to phase-motion in events produced from
signal candidates, and is not simply an artifact of combinatorial background.
As mentioned above, the moment for GeV/c2 behaves very much like the real part of
the BW amplitude, which suggests that the phase of the amplitude yielding the
interference effect is close to zero. The proximity of threshold, and the fact that the interference
is seen in the moment, suggest that the effect is due primarily to
the presence of an -wave amplitude.
\begin{picture}(0.0,0.0)\end{picture}
Figure 5: The efficiency-corrected moment of the system invariant mass distribution
corresponding to the signal region.
The distributions for the sideband regions are consistent with zero, and so are not subtracted.
If it is assumed that only total spin =1/2 and 3/2 amplitudes contribute,
and if the description is restricted to , and waves,
the following angular distribution for the
produced in decay is obtained:
(10)
where the amplitude notation is .
The angular structure associated with the terms (Eq. 10, first bracket) is identical to that associated
with the terms (Eq. 10, second bracket), i.e., there is a Minami ambiguity minami .
It follows that there are more unknown quantities than measurables, so that a complete set
of amplitudes cannot be extracted from the data.
However, since the is a resonance, it is reasonable to attribute the
moment behavior of Fig. 5 to the - interference term of Eq. 10; in addition,
-wave amplitudes would not be expected to be significant for mass values close to threshold, so that
a simple model which incorporates only and amplitudes might describe the data. This would imply that the
intensity distribution of Fig. 3(b) corresponds to only. However,
as discussed above, the difference in the distributions
of Figs. 3(a) and (b) dips strongly in the region, even reaching
negative values, and so cannot be described by .
This indicates that the data in the mass region
require a more complicated explanation.
V THE SYSTEM AT HIGHER MASS
The inclusion of a contribution (Eq. 10) does not solve the problem of the mass region described
at the end of Section IV, since Fig. 3(b)
then corresponds to and Fig. 3(a) to
.
If the model is extended to include a amplitude,
the Legendre Polynomial moments, –, are
expressed in terms of the amplitudes as follows:
(11)
(12)
(13)
(14)
(15)
These five equations involve nine unknown quantities (five amplitude
magnitudes and four relative phase angles), and so cannot be solved.
Additional input from polarization moments is required. Such an
analysis is beyond the scope of the present paper.
If we assume that the and amplitudes
can be ignored, Eqs. 11-15 can be solved in principle. However, as is
discussed below, even such a simplified model encounters difficulties in
the region.
\begin{picture}(0.0,0.0)\end{picture}
Figure 6: The efficiency-corrected
moment of the invariant mass distribution
for the signal region.
The distributions for the sideband regions are consistent with zero, and so are not subtracted.
In the context of this model, the absence of any significant moment
in Fig. 3(c) indicates via Eq. 15 that must be small. However,
since is large, interference might be seen in
the mass-dependence of the moment (Eq. 14). This is shown in Fig. 6, where small, but
significant, deviations from zero are in fact observed. Since there is
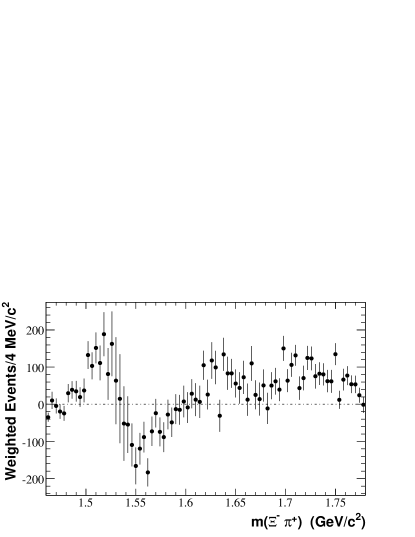
a interference contribution to Eq. 12, an improved
measure of the mass dependence of interference is
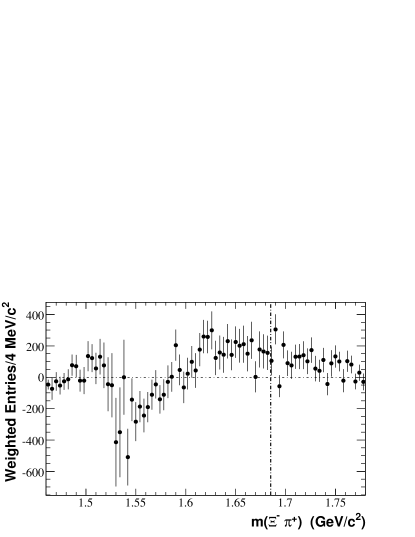
obtained by subtracting ( from . The
distribution is shown in Fig. 7,
and the dip in the mass region GeV/c2 of Fig. 5 has been removed by
this procedure. Before the region is examined in more
detail, the behavior of is considered in the mass
region above GeV/c2.
\begin{picture}(0.0,0.0)\end{picture}
Figure 7: The efficiency-corrected
moment of the system invariant mass distribution, corresponding to the signal region.
The dot-dashed line indicates the mass value PDG2006 .
The distributions for the sideband regions are consistent with zero, and so are not subtracted.
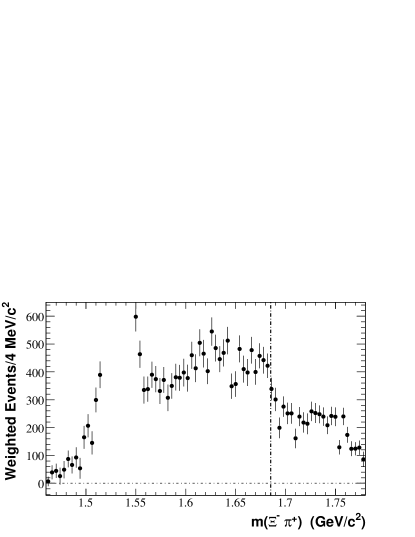
\begin{picture}(0.0,0.0)\end{picture}
Figure 8: The efficiency-corrected mass-sideband-subtracted
moment of the system invariant mass distribution for the signal region
(the distribution of Fig. 3(a) with the region suppressed).
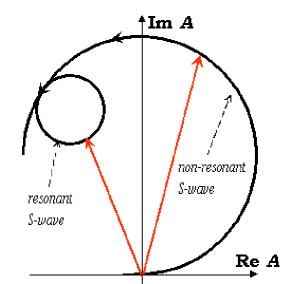
The vertical dot-dashed line indicates the mass value PDG2006 .Figure 9: A cartoon of an Argand diagram which
illustrates a possible cause for the dip in the invariant mass distribution
due to the presence of the .
It is interesting to consider this in comparison to the distribution
of Fig. 3(a) with the region suppressed (Fig. 8), which
shows a significant decrease in intensity at GeV/c2. As mentioned
previously, the behavior of the moment in the region
indicates a small amplitude with phase deg. relative to
the amplitude in order that closely resemble the real
part of the BW amplitude. If the amplitude
did not change significantly at higher mass values, the BW amplitude
would cause to approach zero from below with increasing mass.
Instead, passes through zero at GeV/c2 and remains positive
thereafter (Fig. 7). Since represents the projection of the
amplitude onto the amplitude, this means that the
phase is increasing significantly, is only 90 deg. behind the
phase at GeV/c2 where is , and continues to
increase at higher mass. The dip in the mass distribution of Fig. 8
is in the vicinity of the , which is known to have a
small coupling to adamovich .
This dip could occur as the result of the coherent addition of a small, resonant
amplitude to the slowly increasing amplitude,
as shown schematically by the cartoon of Fig. 9. Here the large circle
represents a slowly-varying non-resonant amplitude for which
the phase reaches 90 deg. at mass GeV/c2, relative to a
amplitude; the latter should be approximately aligned with the negative real axis
at this mass value. As the phase increases beyond 90 deg., the
projection on the amplitude [i.e., ] will increase as
seen in Fig. 7. The small circle represents the subsequent coherent
addition of a small resonant amplitude. The
resultant amplitude will then yield a dip in overall intensity in the
region with very little effect on the phase, and hence on
(cf. Fig. 7). The inference which can be drawn is that the decays strongly to
the system in an -wave orbital state, and hence that it
has spin-parity . As such, this represents the first
experimental information on the spin-parity of the .
Spin 1/2 is favored also by an analysis of the
Dalitz plot corresponding to the decay process thesis .
The behavior of the amplitude described above is remarkably
similar to that obtained for the -wave scattering
amplitude in the LASS experiment lass . There the slow, monotonic
increase in the -wave amplitude at low mass is described by an
effective range parametrization. The phase reaches deg. before
the coherent addition of a resonant contribution takes
effect, and the resultant amplitude decreases quickly almost to zero.
The main difference in the case is that the resultant amplitude
remains elastic (within error) up to threshold, so that the
decrease in -wave intensity is quite substantial. Since the
decays significantly via modes other than ,
a similar mechanism would be expected to yield less dramatic results, as is in fact observed in Fig. 8.
This similarity between and scattering amplitudes may be an example
of the proposed effective supersymmetry between mesons and baryons involving
the replacement of a light anti-quark in the meson by a light diquark to form
the related baryon Lipkin . For , the amplitudes describing
scattering are the same as for , and similarly those
describing scattering are proportional to those for scattering;
scattering is then converted to scattering by replacing the quark
in the with an diquark to obtain the . In Ref. Lipkin , the
effective symmetry is demonstrated by relating various baryon-baryon and meson-meson mass
differences with impressive precision. It seems reasonable to conjecture
that this symmetry might also be manifest in the dynamics of appropriately related meson-meson
and baryon-meson scattering processes.
VI THE LINESHAPE
In the region,
interference does in fact contribute to the
moment distribution in Fig. 3(b) (cf. Eq. 13), but not to the
distribution in Fig. 3(a) (cf. Eq. 11), so that the signal
in Fig. 3(b) might be larger than that in Fig. 3(a). In addition, this
contribution might distort the lineshape in Fig. 3(b), but should not
affect that in Fig. 3(a), which is obtained by integration over
cos. In order to test this conjecture, fits to the
distributions in Figs. 3(a) and 3(b) are performed in which the
lineshape is described by
(16)
where is a constant, is the momentum of the in the
r.f., and is the momentum of the in the
r.f.; is the orbital angular momentum in the
decay ( is chosen), and that in the decay (for
which ); , are Blatt-Weisskopf barrier factors blatt with
radius parameter , and, for example, ; GeV-1 ( f) is chosen lass .
The mass is , and
its mass-dependent total width, which consists of the sum of partial
widths to and . If the mass
differences between these modes are ignored, the mass-dependent total width is then
(17)
where is the width of the , and .
For the fits to the data of Fig. 3(a), an incoherent background
function of the form
(18)
is included also.
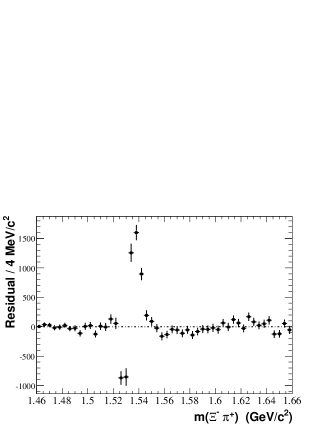
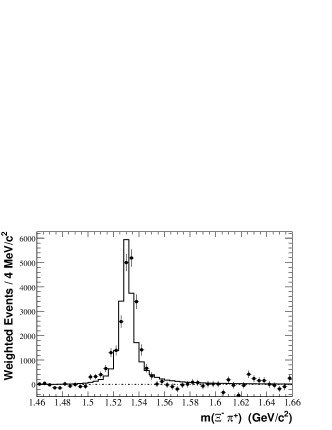
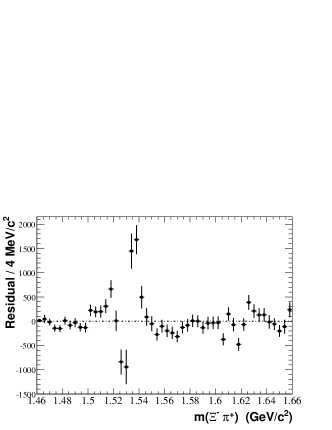
Figure 10: The efficiency-corrected
-mass-sideband-subtracted (a) and (c)
moment distributions for the system, for the signal region (solid dots).
The fits represented by the histograms are described in the text.
In (b) [(d)] the difference between the data points and the histogram in (a) [(c)] is shown.
In each fit, the fit function is convolved with a mass resolution
function consisting of two Gaussian distributions with a common center
and fixed fractional contributions, but with r.m.s. deviation values
which depend on invariant mass. For the resolution function, the resulting half-width-at-half-maximum
increases from MeV/c2 just above threshold, to MeV/c2 at
the , reaching MeV/c2 at GeV/c2, so that the
resolution in the signal region is excellent.
The degradation of the mass resolution with increasing mass should, if anything, cause the
observed lineshape to be slightly skewed toward high mass; it follows that this cannot be
the source of the skewing of the lineshapes of Figs. 3(a) and 3(b) toward low mass.
The convolution procedure takes quantitative account of the resolution behavior, but,
since the resolution is excellent, this has little impact on the description of the data.
The fit results with
mass and width fixed at their PDG values PDG2006 are shown
in Fig. 10. In Figs. 10(a) and 10(c), the dots represent the data
of Figs. 3(a) and 3(b), respectively, while the histograms represent the
mass-resolution-smeared fit functions integrated over the corresponding
mass intervals. The fit residuals (data histogram) are shown in Figs. 10(b)
and 10(d), respectively. These show similar very large systematic
deviations from zero, and the fits have correspondingly poor
c.l. values ( and , respectively). With
the mass and width parameters free in the fits, the c.l. values are
still poor, and the values obtained differ significantly from the PDG
values (e.g., MeV/c2 and MeV for
Fig. 10(a)). If the Blatt-Weisskopf radius parameter is allowed to be free,
an acceptable fit to the mass distribution is not obtained
(c.l. ), the residuals still show systematic deviations from
zero, and the mass and width values obtained still differ significantly
from their PDG values. Similarly, the fit to the moment mass dependence
with mass, width and radius parameters free remains poor (c.l.
); in addition, the radius parameter increases to
GeV-1 (which is equivalent to the use of an -wave Breit-Wigner)
in an attempt to reproduce the observed lack of skewing
toward high mass expected for a -wave decay. Since the -wave nature of the decay has been
establised, this is certainly an
unacceptable result.
As a check of the signal parametrization of Eq. 16, this
function (with GeV-1) has been used in fits to the published
mass distributions from four of the experiments london ; kirsch ; borenstein ; baltay used to obtain
the PDG mass and width values PDG2006 . These are Hydrogen Bubble Chamber
experiments, and each mass distribution is obtained as the projection
of the Dalitz plot for the reaction (Ref. kirsch
uses some additional contributions). The analysis samples are small
(125, 350, 324, and 1313 events, respectively), and the details of
the fit functions used in Refs. london ; kirsch ; borenstein ; baltay are not made clear.
It is found that
the non-resonant background contributions are well-described using only
the phase space factor of Eq. 18, and Eq. 16, convolved with
a Gaussian of r.m.s. deviation specified for each experiment, is used to represent the
signal. Good c.l. values are obtained, and the resulting weighted
average mass ( MeV/c2) and width ( MeV) values
agree well with those from the PDG PDG2006 . This indicates that
the choice of signal and background functions is not the reason for
the poor-quality fits to the data of Fig. 10. Furthermore, since no
significant improvement in fit quality is observed in going from
the fit to the fit, it follows that the difficulty
in fitting the former cannot be attributed to the presence of an
interference contribution, since this would not be
present for the latter.
This striking failure to describe the most obvious feature of the
Dalitz plot leads to the conclusion that a satisfactory description of the observed
(), cos) distribution cannot be obtained in terms of
amplitudes pertaining solely to the system. The
difficulties probably result from overlap and interference effects involving amplitudes associated with the
and/or the systems (if the possibility of direct three-body decay is ignored).
The system has , and has been observed to have only an -wave amplitude, which varies slowly with mass
in the relevant region ( GeV/c2). It seems unlikely that such an amplitude could lead to significant
distortion of the mass and dependences of the system,
but the relevant quantitative analysis has not yet been attempted.
In contrast, the system could have contributions from high-mass or
resonant structures in the region of overlap with the ( GeV/c2, cf. Fig. 2(a)).
Very little is known about such states or their couplings to PDG2006 , and
there is no clear evidence for their presence in the Dalitz plots of Fig. 2.
Indeed the only “evidence” for such contributions is the failure of the description of the
region solely in terms of amplitudes in the present analysis.
This seeming impasse might benefit from analyses of related decay processes, such as
or ,
although these may suffer from their own particular complications related to other quasi-two-body modes.
VII CONCLUSION
In conclusion, the analysis of the Legendre Polynomial moments of the system which
result from data on the decay
has established quite clearly, on the basis of Figs. 3 (b) and 3 (c),
that the hyperon resonance has spin 3/2. In conjunction with previous
analyses ref:schlein ; ref:button ,
this also definitively establishes positive parity, and hence that the is a resonance.
However, comparison of the moment to the mass distribution,
and fits to the angular decay distribution
in the region,
indicate that it is necessary to include other amplitudes in order to obtain a
complete description of the data. In particular, the
observation of a moment exhibiting oscillatory behavior in the
region indicates the need for an amplitude, while providing first evidence for the
expected rapid BW phase motion of the amplitude.
However, a simple model incorporating only these amplitudes and a amplitude is
ruled out because of the failure to describe the
lineshape. The presence of the amplitude at high mass,
and the behavior of the mass distribution at GeV/c2, suggest
that a resonant amplitude may be adding
coherently to this amplitude, thus leading to the inference of
spin-parity for the .
It appears that a quantitative description of the lineshape,
and indeed of the entire Dalitz plot, must incorporate these features together
with amplitude contributions associated with the and/or
the systems. An analysis of this complexity will be performed
when the full BABAR data
sample (integrated luminosity approximately 500 fb-1) is available.
VIII ACKNOWLEDGEMENTS
We are grateful for the
extraordinary contributions of our PEP-II colleagues in
achieving the excellent luminosity and machine conditions
that have made this work possible.
The success of this project also relies critically on the
expertise and dedication of the computing organizations that
support BABAR.
The collaborating institutions wish to thank
SLAC for its support and the kind hospitality extended to them.
This work is supported by the
US Department of Energy
and National Science Foundation, the
Natural Sciences and Engineering Research Council (Canada),
the Commissariat à l’Energie Atomique and
Institut National de Physique Nucléaire et de Physique des Particules
(France), the
Bundesministerium für Bildung und Forschung and
Deutsche Forschungsgemeinschaft
(Germany), the
Istituto Nazionale di Fisica Nucleare (Italy),
the Foundation for Fundamental Research on Matter (The Netherlands),
the Research Council of Norway, the
Ministry of Education and Science of the Russian Federation,
Ministerio de Educación y Ciencia (Spain), and the
Science and Technology Facilities Council (United Kingdom).
Individuals have received support from
the Marie-Curie IEF program (European Union) and
the A. P. Sloan Foundation.
References
(1)
W.-M. Yao et al. (PDG2006), J.Phys. G:Nucl.Part.Phys. 33, 1 (2006).
(2)
P. Schlein et al., Phys. Rev. Lett. 11, 167 (1963).
(3)
J. Button-Shafer et al., Phys. Rev. 142, 883 (1966).
(4)
The BABAR Collaboration,
B. Aubert et al., Phys. Rev. Lett. 97, 112001 (2006).
(5)
The use of charge conjugate reactions is implied throughout this paper.
(6)
B. Aubert et al., Nucl. Instr. Meth. A479, 1 (2002).
(7)
The signal and low- and high-mass-sideband regions correspond to [2.265,2.307], and
[2.223,2.244], [2.328,2.349] GeV/c2, respectively.
(8)
M. Jacob and G. C. Wick, Ann. Phys. 7, 404 (1959).
(9)
S. U. Chung, CERN Yellow Report, CERN 71-8 (1971).
(10)
E. Wigner, Gruppentheories, Freidrich Vieweg und Sohn, Braunschweig (1931);
Group Theory, Academic Press, New York (1959).
(11)
Each selected event is weighted by the inverse value of its calculated efficiency, which is parametrized
as a function of cos and using signal Monte Carlo events.
(12)
J. M. Blatt and V. F. Weisskopf, Theoretical Nuclear Physics, John Wiley and Sons (1952).
(13)
S. Minami, Theor. Phys. 11, 213 (1954).
(14)
M.I. Adamovich et al., Eur. Phys. J. C5, 621 (1998).