Understanding the 8 P relationship on sub-arcsecond scales in Luminous Infrared Galaxies
Abstract
This work explores in detail the relation between the 8 and the Pa emissions for 122 H ii regions identified in a sample of 10 low- LIRGs with nearly constant metallicity (). We use Gemini/T-ReCS high-spatial resolution (pc for the average distance of 60 Mpc of our sample) mid-infrared imaging (at m or m) together with HST/NICMOS continuum and Pa images. The LIRG H ii regions extend the vs. relation found for H ii knots in the high-metallicity SINGS galaxies by about two orders of magnitude to higher luminosities. Since the metallicity of the LIRG sample is nearly constant, we can rule out this effect as a cause for the scatter seen in the relationship. In turn, it is attributed to two effects: age and PAH features. The / ratio, which varies by a factor of ten for the LIRG H ii regions, is reproduced by a model with instantaneous star formation and ages ranging from 4 to 7.5 Myr. The remaining dispersion around the model predictions for a given age is probably due to differential contributions of the PAH features (the m, in our case) to the m emission from galaxy to galaxy.
Subject headings:
galaxies: nuclei — galaxies: star clusters — galaxies: starburst — infrared: galaxies1. Introduction
The m luminosity is potentially one of the most interesting star formation rate (SFR) indicators as it can be used for sources identified in deep infrared (IR) Spitzer/MIPS surveys at 24 which at z 2 corresponds to rest-frame 8 emission. The MIPS m (or IRAS m) luminosities appear to be well correlated with the number of ionizing photons as derived from extinction corrected Pa and H luminosities at least at high metallicities (Wu et al. 2005; Calzetti et al. 2005; Calzetti et al. 2007, Cal07 hereafter; Alonso-Herrero et al. 2006a, AAH06a hereafter). The situation for the m emission is less clear (Cal07, Alonso-Herrero et al. 2006b, AAH06b hereafter). In particular, AAH06b found that the individual H ii regions and the integrated emission of Luminous Infrared Galaxies (LIRGs, ) show a different behavior in the vs. relation, and suggested that only the integrated properties of galaxies should be used when calibrating the SFR in terms of the m luminosity (see also Wu et al. 2005). Recently Cal07 for H ii knots identified in the SINGS (Spitzer IR Nearby Galaxies Survey, Kennicutt et al. 2003) galaxies concluded that the larger scatter of the m vs. Pa relation is due to the combined effects of extinction, metallicity and the star formation history of the regions.
The emission in the 8 spectral region is produced by thermal continuum from hot dust as well as by Polycyclic Aromatic Hydrocarbon (PAH) feature emission. PAH are commonly observed in the MIR spectra of local (e.g., Roche et al. 1991; Lutz et al. 1998; Genzel et al. 1998; Brandl et al. 2006; Smith et al. 2007) and high- star-forming galaxies (Sajina et al. 2007). However, while the dust continuum emission as traced by the MIPS m emission is found to be more peaked in H ii regions, the m (mostly as PAH) emission arises from Photo-dissociation Regions (PDR) (Helou et al. 2004; Bendo et al. 2006; Povich et al. 2007; Lebouteiller et al. 2007). This implies that the PAH carriers can also be excited by the galaxy field radiation (Peeters et al. 2004; Tacconi-Garman et al. 2005) not directly associated with young ionizing stellar populations, explaining why the 8 emission appears to be more extended and diffuse than the H or Pa emission (Helou et al. 2004: Calzetti et al. 2005; AAH06b; Engelbracht et al. 2006). Consequently, aperture effects may have important implications when measuring the emission from individual star-forming regions.
In this work we further study the 8 emission at sub-arcsecond scales using observations obtained with the Thermal-Region Camera Spectrograph (T-ReCS; Telesco et al. 1998) on Gemini South of a sample of low- LIRGs (see also AAH06a, AAH06b). In particular, we explore the effects of the age and extinction of the individual star-forming regions on the 8 vs. Pa relation and how they may contribute to the observed scatter of the relation. We also compare our results with those of Cal07 for high-metallicity H ii knots in star-forming galaxies drawn from the SINGS sample. The paper is organized as follows: In §2, the sample, observations, and data reduction are presented. §3 describes the analysis of the data. The overall morphology of the LIRGs is presented in §4. §5 analyzes the / relationship in detail. The summary of the results is given in §6. We use , , and .
2. Observations and Data Reduction
2.1. The Sample
We have obtained MIR imaging of a total of ten LIRGs (see Table 1 for details) taken from the complete, volume-limited sample of local LIRGs defined by AAH06a. The full sample of AAH06a was drawn from the Revised Bright Galaxy Sample (Sanders et al. 2003) and selected such that the Pa emission line ( = 1.875 ) could be observed with the NICMOS F190N filter on the Hubble Space Telescope (HST). This restriction means that the full sample is limited to nearby galaxies (Mpc). The ten galaxies studied in this paper represent the majority of the LIRGs in the sample that can be observed from the southern hemisphere. Four galaxies were previously studied by AAH06b but are fully re-analyzed and included here for completeness and consistency. The metallicities of the sample, taken from Relaño et al. 2007 and Vacca & Conti 1992, are on average (see Table 1 for individual values).
2.2. MIR Imaging Observations
The MIR observations of the LIRGs were obtained with T-ReCS (Telesco et al. 1998) on the Gemini South telescope during semesters 2005B, 2006A and 2006B (program IDs: GS-2005B-Q-10, GS-2006A-Q-7 and GS-2006B-Q-9, respectively). The data from the first semester were taken with the broad-band filter ( = 10.36 ; = 5.27 ), whereas data obtained in 2006 used the narrow-band Si-2 filter ( = 8.74 ; = 0.78 ). Detailed information about the observations is given in Table 2. The 320 240 pixel detector together with its 009 pixel-1 plate scale yield a field of view (FOV) of 28.5″ 21.5″. At the central wavelengths of the and Si-2 filter band-passes, the telescope/instrument system provides resolutions of 032 and 027, respectively. The observing conditions (seeing FWHM of , Table 2) indicate that the observations were almost diffraction limited.
The observations were done in a standard chop-nod mode to remove the time-variable sky background, telescope thermal emission, and the 1/f detector noise. The chop throw was 15 and the telescope nodding was performed every 30 s in all cases (see also Packham et al. 2005). The observations were divided in two datasets to avoid observing problems or a sudden change in weather conditions. We observed a Cohen standard star (appropriate for MIR observations, Cohen et al. 1999) for each galaxy to obtain the absolute flux calibration of the images. The standard star observations were always taken with the same instrument configuration and immediately before or after the target to minimize the difference in airmass and hence to reduce photometric uncertainties. The large-scale morphology of some of the targets made it necessary to rotate the detector along the major axis of the galaxy. In those cases the standard stars were observed with the same configuration.
2.3. Data Reduction Procedure
The data are stored automatically in savesets (indivisible subsets of data) that can be accessed for visual inspection for each chop/nod position. This allows to discard images affected by any type of instrumental noise pattern (e.g., narrow diagonal stripes of increased signal across the detector or over-variations of the background flux along the array or in between chop sets). There were no bad savesets in our case. Next, the backgrounds were removed and the galaxy images coadded to obtain a single image of the target. This was done for both datasets in which the observation was divided (see above). These and the following procedures were also applied to the standard star.
We applied a flat-field image for each dataset which was constructed using the average of all the sky pointings taken at each chop integration. The target datasets were then averaged in a single image from which the residual background flux was subtracted. This step requires a special treatment because the final images with long integration times can suffer from a residual noise pattern that introduces low-level flux variations along the short axis of the detector (broad wave-like horizontal stripes). To subtract the residual background, the image was first fitted to a 2D plane with a fitting procedure that iteratively rejects outliers 2.25 above/below this plane. At the same time, preselected locations with galaxy emission were masked out. Pixels within these areas with 1.5 fluxes above/below the 2D fit were not used in following steps. Next, each row of this 2D-subtracted, masked image was smoothed and fitted to a 1D spline. By combining all these 1D fits, a residual background 2D-image was created and subtracted from the object image. All these steps improve the quality of the final images and introduce no more than 10% uncertainty in the fluxes of the measured regions. The T-ReCS images were rotated to the north-east direction and convolved with a Gaussian kernel of = 1 pixel to accurately center the apertures on the faintest H ii regions (see §3.1).
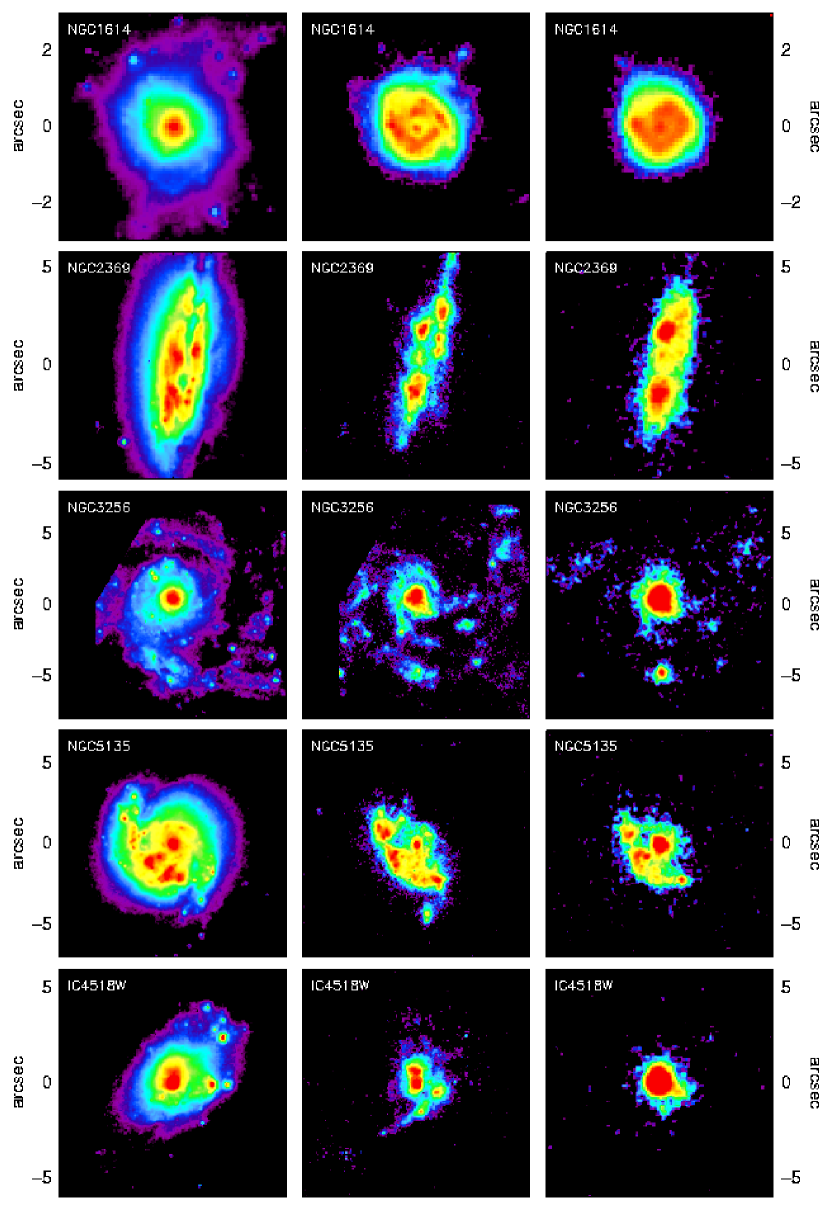
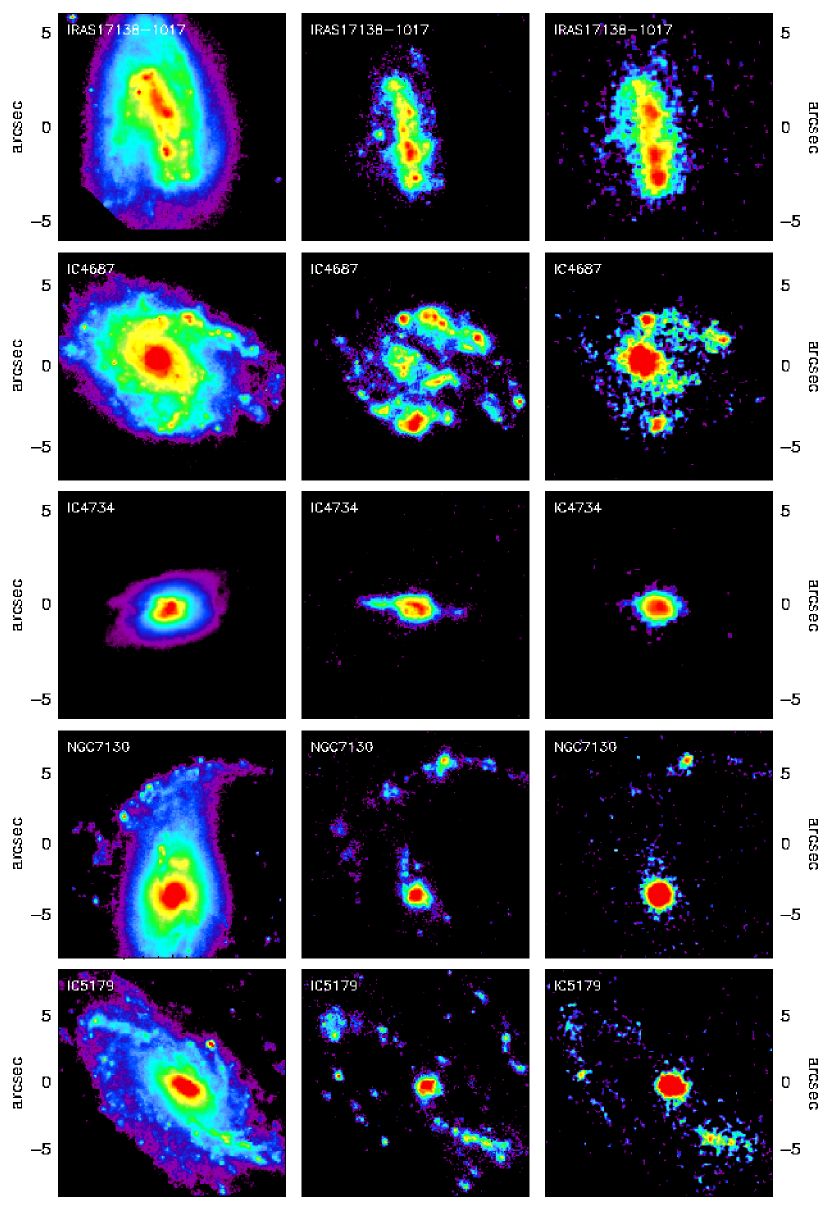
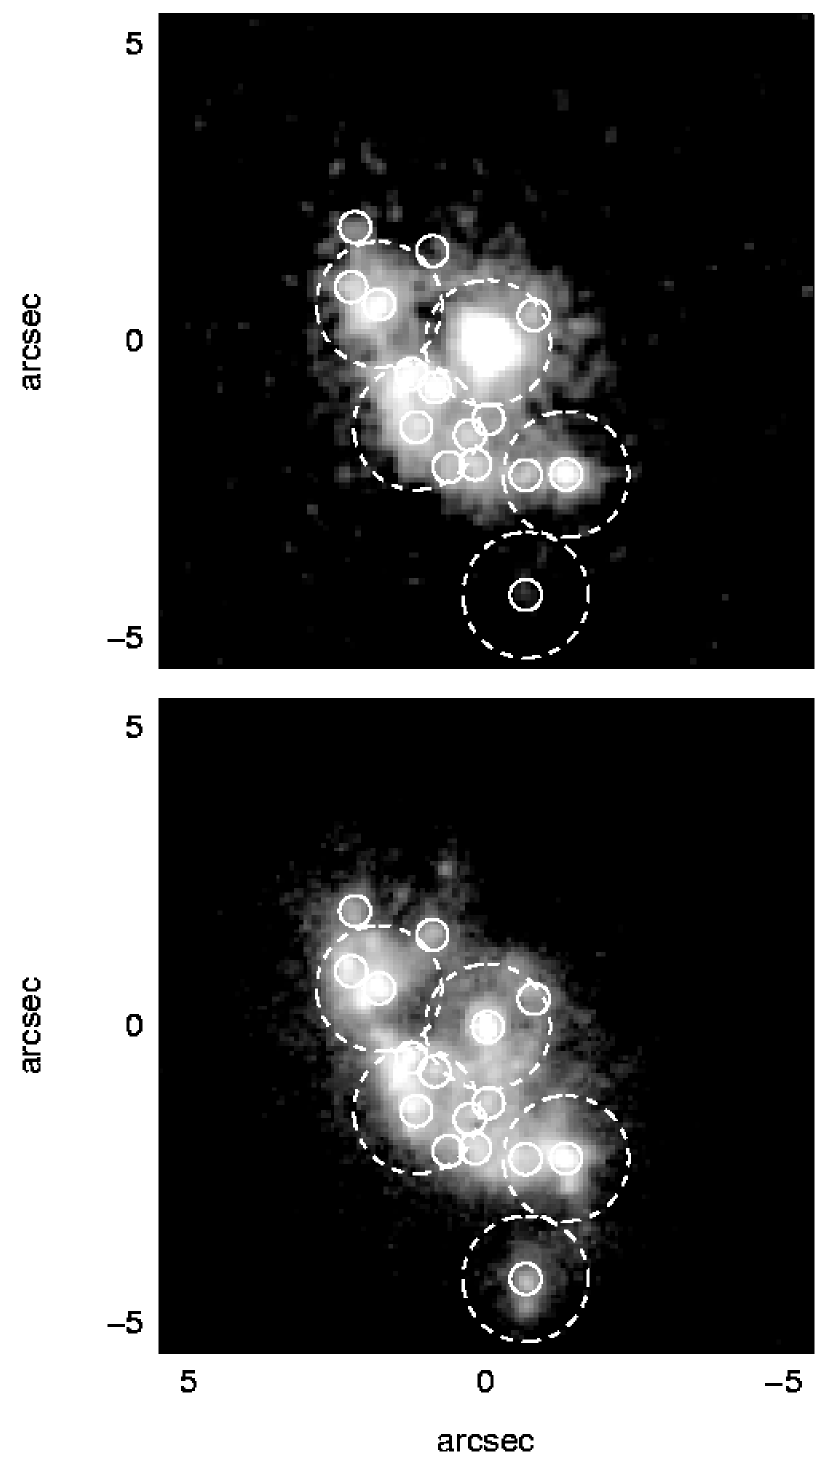
Fig. 1 shows fully reduced MIR images (right) of the sample together with the HST/NICMOS 1.6 continuum and Pa images.
2.4. Photometric calibration
The photometric calibration was obtained with the Cohen standard stars (Cohen et al. 1999). Since the Cohen stars have synthetic flux-calibrated spectra, by convolving the telescope throughput and filter bandpass with the spectra, one can obtain the flux of the standard stars in physical units. In addition, aperture photometry was performed on the standard stars to obtain the count rates, and the flux conversion factor was calculated as the ratio of both quantities. The photometric calibration is accurate to 10–15%.
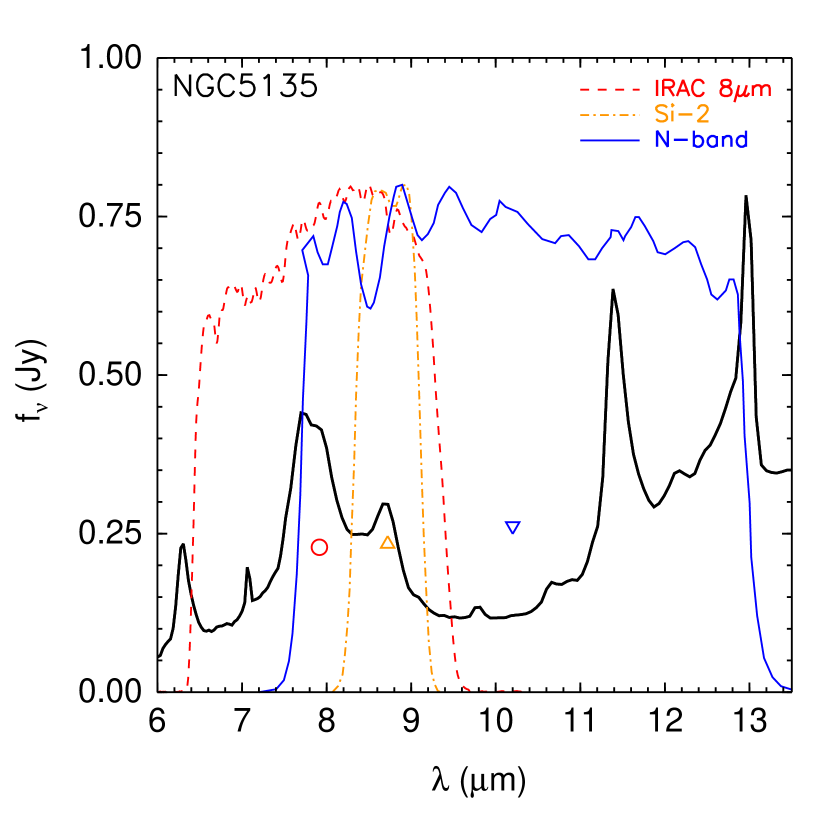
The need for a color correction for the broad filter flux densities was explored. This factor would account for the difference in the spectral slope of the standard stars and those of our galaxies. While the MIR spectrum of a star is similar to that of the Rayleigh-Jeans part of a black body, the spectrum of an H ii region or a nucleus may differ significantly. In order to quantify this difference, we used the /IRS spectra of several LIRGs of the sample classified as H ii-like (NGC 1614, NGC 3256 and IRAS 17138-1017). We normalized their integrated N-band flux densities to those of the T-ReCS reference standard stars observed for flux calibrating each galaxy. Next, the spectra were convolved with the same T-ReCS configuration used for the observations, and the N-band flux densities of the spectra were calculated. Then, they were compared with those of the standards. The differences were within 5%. Given the uncertainties of the method, we decided not to correct the flux density of the H ii regions for this color difference. The same approach was employed for calculating the correction factor of an AGN spectrum. We used a power-law function of , with , to represent its MIR emission (Weedman et al. 2005), and obtained a factor of 1.15. The MIR flux densities of the two Sy2 (NGC 5135, IC 4518W) and one LINER/Sy (NGC 7130) nuclei in the sample observed with the N-band filter were corrected by this factor. This kind of color correction is not necessary for the Si-2 filter as it is relatively narrow.
Since the galaxies were observed with two different MIR filters, we investigated whether a conversion factor between the -band and the Si-2 filter flux densities was needed. To do so, we used the /IRS low-resolution spectra of several H ii-classified LIRGs of our sample (NGC 1614, NGC 3256, IRAS 17138-1017, and IC 4734) integrated over their central (10″ 3.7″) regions. We verified that, within a 10% uncertainty, the 8.7 and -band flux densities were equivalent. The same was assumed for our individual H ii regions. For the Sy nuclei we used a conversion factor [8.7 µm]/[-band] of 0.56 as done by AAH06b.
2.5. HST/NICMOS images
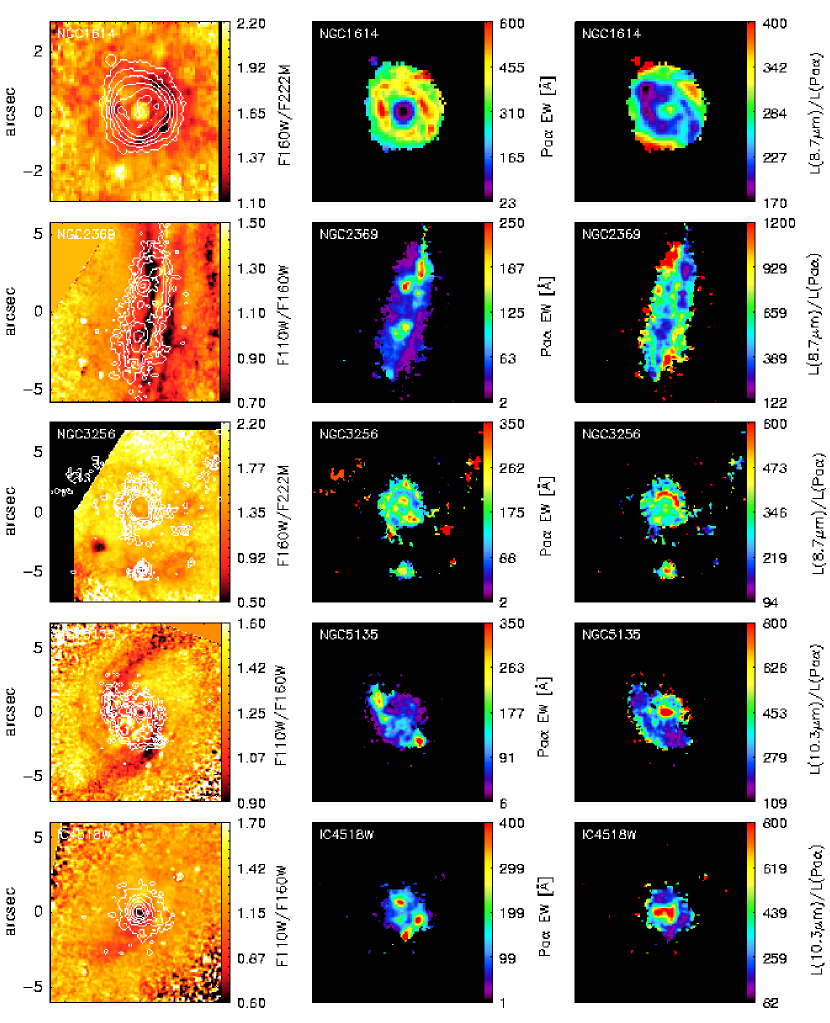
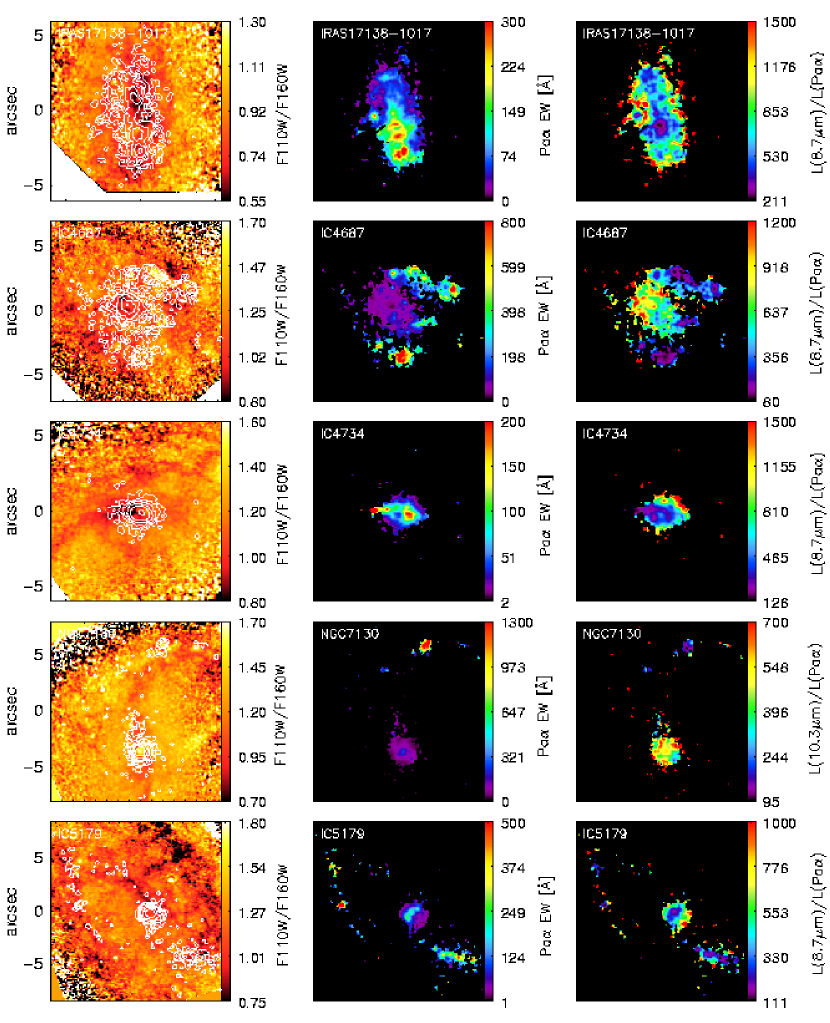
The sample of LIRG galaxies were observed with the NIC2 camera (pixel size of 0.075″) of NICMOS using two broad-band filters (F110W and F160W) and two narrow-band filters (F187N and F190N), except for two galaxies (NGC 1614 and NGC 3256) from the NICMOS GTO programs which were observed with the F160W and F222M filters (see Alonso-Herrero et al. 2001, 2002). The full description of the data reduction of the HST/NICMOS images can be found in AAH06. To compare the NICMOS images with the T-ReCS images we performed the following additional steps. The NICMOS images were: (1) rotated to the north-east orientation, (2) re-scaled to the pixel scale of the T-ReCS detector, (3) shifted to the same position as the MIR images, (4) smoothed with a Gaussian to match the MIR resolution (see Table 2), and (5) background subtracted. In addition, we constructed J/H (or H/K) ratio maps by dividing their F110W and F160W (or F160W and F222M) continuum images; Pa equivalent width (EW) maps by dividing the continuum-subtracted Pa images by their adjacent F187N continuum image; and MIR/Pa ratio maps by dividing the T-ReCS images by the continuum-subtracted Pa images. These maps are presented in Fig. 2 for our sample of galaxies.
3. Analysis and Results
3.1. Selection of the regions and aperture photometry
We identified the nucleus of each galaxy as the source with the highest MIR flux density. Although this is straightforward in most of the galaxies, there are two examples: NGC 2369 and IRAS 171381017, where the position of the nucleus is not clear from the NIR continuum images. For the selection of the H ii regions, first we visually identified them in the T-ReCS images. A second inspection was done in the Pa images to include sources with high hydrogen recombination line fluxes but low MIR emission. We finally rejected in both sets sources with integrated flux densities (see below) below 2 times the standard deviation of the background (i.e., a 2 threshold).
Except for some of the most luminous nuclei (NGC 5135, IC 4518W), the majority of the MIR sources appear extended. Therefore we used circular aperture photometry (instead of point source function fitting) to measure the flux densities of nuclei and star-forming regions of the LIRGs. We note that AAH06a measured the Pa emitting regions with variable apertures depending on the size of the H ii regions instead of with fixed apertures as done in this work. We explored the possibility of a contamination for underlying emission in the MIR images. However, the subtraction of a local background measurement from the flux densities of the H ii and nuclear regions resulted in negligible changes of the results of the paper. Therefore we decided to work with the values obtained without performing any local background subtraction because it might introduce additional uncertainties.
We chose to use three physical apertures for the photometry with radii of 75, 150 and 300 pc. The 75 pc radius aperture was used to take advantage of the high spatial resolution data and to obtain information about the H ii regions on the smallest scales. At the average distance of our sample ( 60 Mpc), the diameter of the smallest aperture corresponds to 052 (5.8 pixels), which is approximately 1.5 times the seeing of our observations (see Table 2). Thus, the centering errors (less than a half of a pixel) of the smallest aperture introduce 10% uncertainty in the measured flux densities of the regions (depending on their brightness).
The largest aperture was chosen to compare our results with those of Cal07 for the high-metallicity H ii knots of the SIGNS galaxies. They used a fixed angular aperture of 13″ in diameter. Almost half of the H ii knots in the high-metallicity SINGS sample are in galaxies located at distances between 8 and 10.5 Mpc. So using an average (weighed with the number of H ii knots) SINGS distance of 9.2 Mpc, their fixed 13″-diameter apertures correspond to approximately 580 pc. Our 150 pc-radius aperture is approximately intermediate between the small and the large apertures. In Fig. 3 we show an example of the physical areas covered by the smallest and largest apertures in one LIRG in our sample.
To avoid overlapping among the selected regions when performing aperture photometry, we sorted them in flux density and rejected those regions within 0.75 times the diameter of another selected region(s) with higher flux density. In addition to the 11 (AGN or H ii) nuclei (two in NGC 3256), the final number of H ii regions selected for photometry were 122, 84, and 49 for the apertures of , and 300 pc, respectively.
Tables 3 and 4 give a summary of the aperture photometry for the LIRG nuclei, as well as for the H ii regions, respectively, for both the smallest and largest apertures. Meaningful comparisons can be made with -based works since the conversion factor between the T-ReCS 8.7 and the /IRAC 8 -band flux densities is close to unity for these kinds of galaxies (10%; see Fig. 4 for an example). For this reason from now on we will use the term “8 ” when referring to both T-ReCS and IRAC m data. Finally, the 8.7 flux densities were converted to monochromatic fluxes. Taking into account all sources of uncertainty (calibration, photometry, and filter and color corrections, background estimation), the MIR photometry of the measurements have an accuracy of % (dex) and (dex) for the pc and pc apertures, respectively.
3.2. Aperture Effects
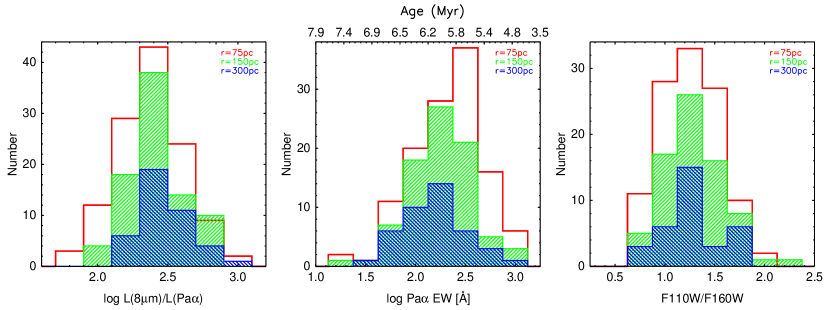
Since, as discussed in §1, in nearby galaxies the 8 emission appears more extended than the Pa (or H) emission it is important to explore the aperture effects on the measurements. Fig. 5 (left) shows the distribution of the observed (not corrected for extinction) / ratios for the three physical apertures. Although the peaks of the distributions are similar for all of them, there is a clear tendency for the width of the distributions to become broader for decreasing the aperture size. Moreover, the low end of the / distribution for the 75 pc radius aperture disappears for the large aperture distribution.
The behavior of the Pa EWs (Fig. 5, middle) is different, with the peaks of the distributions moving toward smaller EW for increasing physical apertures. This can be readily understood if the larger physical apertures progresively include more continuum emission not associated with the H ii regions and/or average together young and old H ii regions. This may also indicate that the typical sizes of the H ii regions of LIRGs are smaller than the largest physical aperture used here (see Alonso-Herrero et al. 2002, and e.g., Fig. 3).
Finally, the F110W/F160W distributions appear to be similar for the three physical apertures. That is, the selected H ii regions in our sample of LIRGS do not appear to have systematically redder NIR colors (that is, they do not appear to be more extincted; see below) than other regions in the central parts of the galaxies.
3.3. Comparison With Models
The HST/NICMOS imaging data can be compared with evolutionary synthesis models of stellar populations to derive some physical properties of the selected H ii regions and nuclei of the galaxies. We ran Starburst99 (SB99, version 5.2; Leitherer et al. 1999) for an instantaneous burst of 106 M⊙, Geneva tracks with high mass-loss rate (see Vázquez & Leitherer 2005), Kroupa initial mass function (exponents of 1.3 and 2.3 for 0.1 M⊙ M 0.5 M⊙ and 0.5 M⊙ M 120 M⊙ mass intervals, respectively), and solar metallicity. The model outputs were obtained with a 0.5 Myr step for starburst ages ranging from 0.5 to 10 Myr (older stellar populations are unlikely to be detected in Pa emission; see Alonso-Herrero et al. 2002 for a detailed discussion).
3.3.1 Ages
The EW of hydrogen recombination emission lines are a useful age indicator of young stellar populations. We compared the observed Pa EW with the model predictions to estimate the ages of the LIRG H ii regions. We note that the derived ages are upper limits to the real ages since the presence of an older underlying stellar population would increase the NIR continuum, thus ageing the region.
Fig. 5 (center) shows the distribution of the inferred ages as a function of the physical aperture. For the smallest aperture (pc), the majority of the LIRG H ii regions have ages ranging from 5.4 and 6.8 Myr, but star-forming regions as young as 4 Myr can be found. This is in agreement with findings for other LIRGs (Alonso-Herrero et al. 2002; Wilson et al. 2006; Díaz-Santos et al. 2007). When using a larger aperture, the ages inferred for the star-forming regions tend to be higher and only a few of them appear to be younger than 5.5 Myr (see discussion in §3.2).
3.3.2 Extinctions
If the age of the stellar populations is known (see above), one can compare the observed NIR continuum colors with the model predictions to get an estimate of the obscuration to the stars. To do so, the SB99 spectra were convolved (for all the starburst ages) with the corresponding NIR filter band-passes and telescope system throughput (F110W, F160W or F222M, depending on each galaxy) to obtain the flux densities predicted by the models at those wavelengths. Then, the synthetic colors (F110W/F160W or F160W/F222M) were interpolated to the ages of each H ii region (known beforehand) and compared with the observed values. The obscuration was calculated by using the Calzetti et al. (2000) extinction law with a foreground dust screen configuration. The derived extinctions were then used to correct the Pa luminosities for obscuration as well as the MIR emission (using Rieke & Lebofsky 1985 extinction law, since the Calzetti et al. law extends only up to the band). Note that because of the ages obtained from Pa EWs are upper limits to the real ages, the extinctions may be lower limits to the real ones.
Regarding the smallest aperture, the majority of the H ii regions show extinctions ranging from AV 4 to 8 mag (equivalent of Pa extinctions of A1.875μm 0.58–1.15 mag, Calzetti et al. 2000), although there are some regions with even higher values. The median value of the extinction for the H ii regions of our sample of LIRGs is mag. The obscuration to the stars inferred in this work are slightly higher than those estimated by AAH06a, but entirely attributable to the use of different models (AAH06a used the Rieke et al. 1993 models).
The extinction of the LIRG H ii regions are consistent with those derived for other LIRGs (Díaz-Santos et al. 2007, Pollack et al. 2007). The extinctions of the H ii knots of the SINGS galaxies (e.g., Calzetti et al. 2005; Cal07) are in agreement with the lower limit found for our H ii regions ( 3–4 mag), as expected if the obscuration increases with the SF rate, i.e., with Pa luminosity (Choi et al. 2006 from optical/MIR; Cal07 from NIR data). This is discussed in more detail in §5.2.3.
The derived extinctions of the nuclei are generally higher than those of the H ii regions in the majority of the LIRGs, except for NGC 1614 (which shows a very “blue” nucleus), IC 4687, IC 4734 and NGC 7130, all classified as H ii-type or LINER. The most extinguished region in our sample is the southern nucleus of NGC 3256 with an estimated extinction of 11.7 mag in agreement with findings of other authors (Kotilainen et al. 1996; Lira et al. 2002; AAH06a).
4. Sub-arcsecond Morphology: Overall Characteristics
Fig. 1 shows that the overall morphologies of the MIR emission and the Pa emission line of LIRGs are similar. The MIR and Pa emissions (which trace the ionizing stellar populations) are rather concentrated in H ii regions and knots with sizes of a few hundred pc, with half of the LIRG sample showing Pa only in the central kpc, and the other half with Pa emission extending over at least kpc (AAH06a for more details). In contrast, the morphology of the NIR continuum emission (which traces in general more evolved stellar populations, see Alonso-Herrero et al. 2002) differs substantially from that of Pa and the MIR, showing the presence of unresolved star clusters and diffuse emission over the whole NIC2 FOV.
A detailed inspection of the MIR and Pa images shows, however, that the spatial coincidence between them is not perfect. There exist examples of this in every galaxy (see Fig. 1, center and right panels), e.g.: the north-west part of NGC 2369, the southern nucleus of NGC 3256, an H ii region located to the south-east of the nucleus of NGC 5135, or the nuclear and some outer regions of IC 4687.
Fig. 2 already gives some hints about the possible causes giving rise to the observed differences between the MIR and the Pa emission. The distribution of the cold dust, as traced by the F110W/F160W (or F160W/F222M) ratio (left panel), does not seem to be correlated with the / maps (right) nor with the MIR emission itself (Fig. 1, right). This would suggest that the dust causing the extinction to the stars might not be related with the dust responsible of the MIR emission. On the contrary, the age, as traced by the Pa EW (center), appears to have an important role, with the youngest H ii regions being associated with the lowest m to Pa ratios. There are many good examples of this aswell, like the nuclear regions of NGC 1614 or NGC 3256 where youngest regions are also identified with “holes” in the / images. The nuclear region of IC 5179 also shows this behavior. There are some cases where this anti-correlation is not so clear. For example, the central region of IC 4687 on the other hand is not very old but show high values of the MIR/Pa ratio perhaps indicating, larger contribution of the 8.6 PAH feature to the 8 luminosity than in other galaxies, and/or higher extinction.
5. The 8 vs. Pa Relationship
In this section we explore in detail the LIRG m vs. Pa relation on different spatial scales, compare it with the work of Cal07 for the SINGS H ii knots, and discuss the mechanisms giving rise to the observed scatter.
5.1. The vs. Relation on Different Spatial Scales
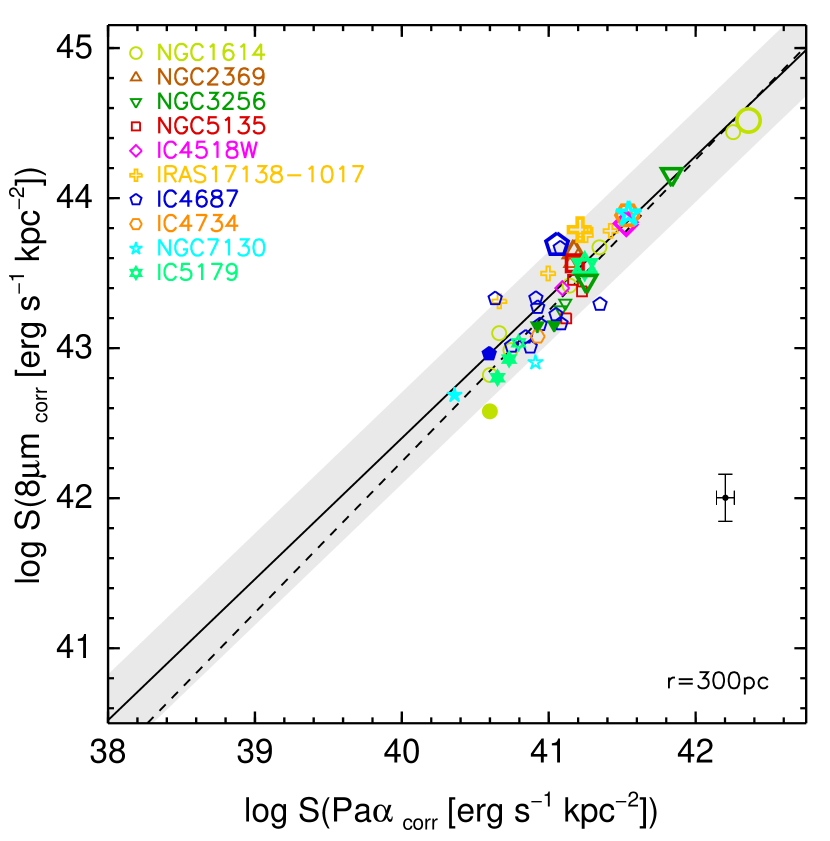
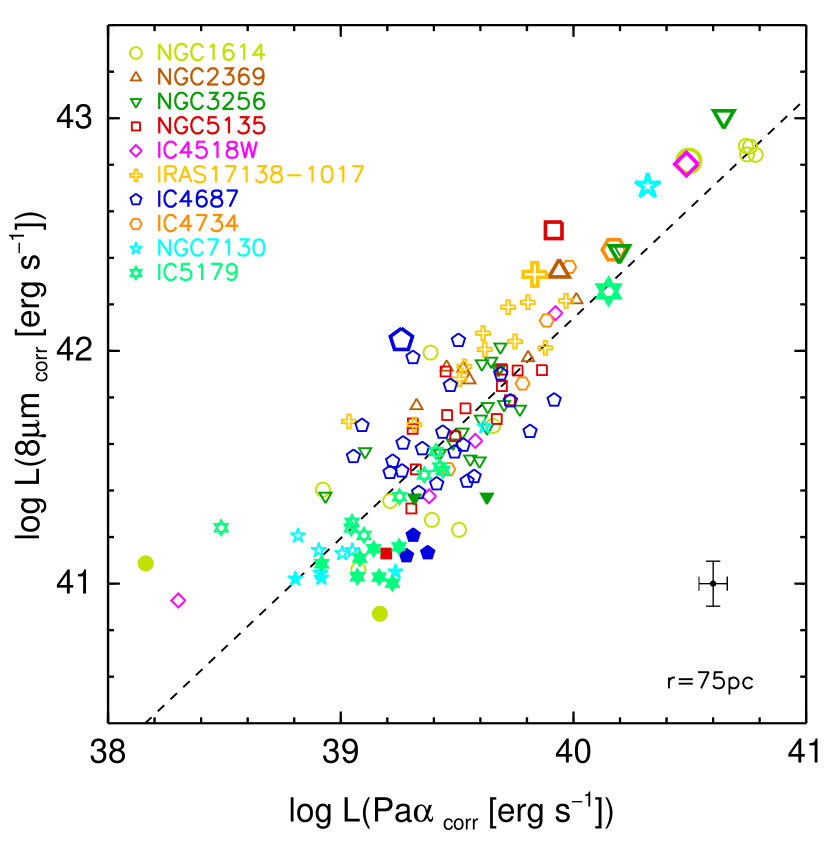
Fig. 6 shows that there is a good correlation between the m and Pa emissions for our sample of LIRG H ii regions when measured through the large aperture (pc). For an easier comparison with the work of Cal07 this figure is shown in units of luminosity surface density (LSD). It is clear from this figure that the LIRG H ii regions (which have 12 + log(O/H) 8.8; see Table 1) extend the correlation found by Cal07 for the SINGS high-metallicity (8.5 12 + log(O/H) 8.9) H ii regions by about two orders of magnitude above [erg s-1 kpc-2]. A least-square fit to our data indicates that the vs. relationship for the pc aperture is consistent with a unity slope (). The fitted slope is also consistent with that inferred for the SINGS high-metallicity knots (, see Cal07) and that for the integrated properties of galaxies (, see Wu et al. 2005). The LIRG H ii regions, however, seem to present a lower scatter (dex) around the fit than the SINGS H ii regions (dex, Cal07). We attribute the smaller scatter of our relation to the fact that we are using the same physical sizes, whereas the Cal07 aperture photometry is dictated by the angular resolution of their MIPS m images. Their fixed 13″-diameter aperture implies physical sizes of between pc and kpc for their high-metallicity sample although, as explained in §3.1, about half of their H ii regions are measured through a pc-diameter aperture.
The 8 vs. Pa relation holds when using our smallest physical aperture (see Fig. 7, pc), although with a slightly smaller slope () than, but compatible with, that derived for the large aperture. The main difference with the relation for the large aperture is the higher dispersion around the fit (dex), not surprising since the distribution of the observed MIR to Pa ratios is much broader for the small aperture (Fig. 5, §3.2). We note that this scatter is real, as the uncertainties associated with the background estimation are smaller for the pc aperture than for the pc aperture. The slight trend for the slope of the vs. relation to increase with the size of the aperture was already seen by AAH06b when comparing the relation for individual H ii regions and integrated emission.
The nuclei of LIRGs classified as an AGN (NGC 5135, IC 4518W, NGC 7130) departure from the correlations (see also AAH06b), and are located above the fitted relations. All of them show an excess of MIR emission with respect to their Pa luminosity. This could be attributed to an additional continuum emission due to hot dust heated by the AGN. This component would compensate the absence of PAH emission, whose carriers are know to be destroyed in the vicinity of a hard radiation fields, like in AGNs (Roche, P. F. & Aitken, D. K. ; Voit, G. M. ; Siebenmorgen, R., Krügel, E. & Spoon, H. W. W. ). Another explanation for this excess could be attributed to the uncertainty of the extinction corrections as they are based on stellar colors that may not be representative of those of an AGN. The regions identified as the nuclei of IRAS 17138-1017 and IC 4687 (both classified as H ii-type) also deviate from the mean trend. In both cases the most likely explanation is that the extinction has been underestimated.
5.2. What Causes the Scatter?
Some caveats should be taken into account when interpreting Figs. 6 and 7. Assuming that the stellar light component is negligible at m (for high-metallicities galaxies Cal07 found that the stellar contribution to the m emission is small), there are two main mechanisms contributing to the m emission. First, there is thermal continuum from hot dust heated by young stars (or an AGN). Obviously hot dust emission heated by an AGN is ruled out in H ii regions and H ii-like nuclei. The second contribution is from PAHs which could vary from galaxy to galaxy. For instance, Smith et al. (2007) found variations in the contribution of the 8.6 PAH feature to the total PAH luminosity (%) and the total IR luminosity ( 0.5–2%) among the SINGS star-forming galaxies.
Cal07 modeled the MIR (both m and m) vs. Pa empirical relations for the SINGS high-metallicity H ii knots with an instantaneous burst of 4 Myr, or equivalently constant star formation of 100 Myr, and an empirical relation between extinction and the Pa LSD. The deviations from the model prediction for the high-metallicity H ii knots are explained in terms of secondary effects such as the age of the stellar population and/or fixed extinction effects. Since the metallicity is almost constant among the LIRGs of the sample, we rule it out as the main cause of the scatter in the vs. relation. In the following subsections, we investigate the other effects for our sample of LIRG H ii regions.
5.2.1 The Age
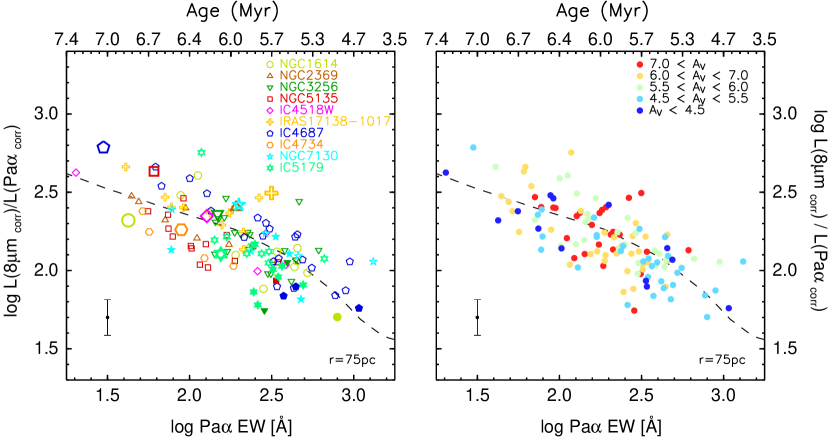
Fig. 8 (left) explores the dependence of the / ratio (corrected for extinction) on the age of the H ii regions identified in LIRGs. There is a clear tendency for the youngest H ii regions in our sample to show the lowest m/Pa ratios. This result is not subject to aperture effects since the same trend is observed if the large aperture is used, although somewhat diluted as the youngest H ii regions are averaged together with older regions and/or continuum regions (see Fig. 5, center). Another possibility would be that the extinction was systematically underestimated for the most obscured star-forming regions (Rigby & Rieke 2004). This does not seem to be the case, as there is no trend for the regions with high / ratios to correspond with H ii regions with the highest extinctions (see Fig. 8, right).
We can use the starburst models described in §3.3 to try and reproduce the trend seen in Fig. 8. Since in star forming galaxies the MIR monochromatic luminosities are related to their IR luminosities (e.g., Elbaz et al. 2002, Takeuchi et al. 2005; AAH06a), and in LIRGs the IR luminosity accounts for the majority of the bolometric luminosity, we can assume . The hydrogen recombination line fluxes are, in turn, directly related to the number of ionizing photons provided by SB99 (). Taken into account these considerations, the dashed line in Fig. 8 represents the evolution of the ratio as a function of the age of the starburst as predicted by SB99 and scaled to our data-points with a / ratio. The scaling factor was calculated by means of a least-square minimization method. As can be seen from this figure, the general trend is well reproduced by this simple model without any previous assumptions about the mechanisms producing the 8 emission. In fact, the mod¡el accounts for the observed variation (about one order of magnitude) of the / ratio as the starburst ages from 4 to 7.5 Myr.
5.2.2 PAH Contribution
Although the general tendency seen in Fig. 8 is accounted for by the age evolution of the star-forming regions, a significant (vertical) scatter remains (dex) around the model predictions for a given age. We propose that this scatter might be indeed caused by the different contribution of the 8.6 PAH (or PAHs, depending on the filter used) to the integrated IR emission of the galaxies. Fig. 8 (left) shows that the H ii regions of a given galaxy seem to follow the model prediction with the age, but different galaxies appear to be shifted along the vertical direction (see, for example, the H ii regions of NGC 5135 and those of IC 4687). This would suggest that the overall PAH emission could vary from galaxy to galaxy as a whole (as seen by Smith et al. 2007). There is also the possibility that the PAH spectra vary from H ii region to H ii region within a galaxy. However, Peeters et al. (2004) found that the variation of the m PAH feature of Galactic compact H ii regions is smaller than that observed in other galaxies.
As mentioned above, the dashed line in Fig. 8 shows the age evolution of the / ratio predicted by the model, scaled with a factor of dex (). This factor, that comes naturally from the data, can be interpreted as the mean contribution of the 8 luminosity (dust continuum + 8.6 PAH) to the in our LIRGs. For a sample of 59 star-forming galaxies of the SIGNS sample, Smith et al. (2007) showed that the contribution of the 8.6 PAH to the total (integrated) IR luminosity of these galaxies is in the range of 0.5 to 2%. Since our 8 luminosities account not only for the 8.6 PAH but also for the continuum emission, the 2.6% factor inferred above for our LIRGs is in agreement with their results. Moreover, the dispersion range of the 8.6 PAH intensity with respect to the among the SINGS galaxies, dex, is also in agreement with the (vertical) scatter seen in our data, suggesting the variation of the overall PAH emission field among the LIRGs as to be the main contributor to this scatter.
5.2.3 Extinction vs. Ionizing Flux
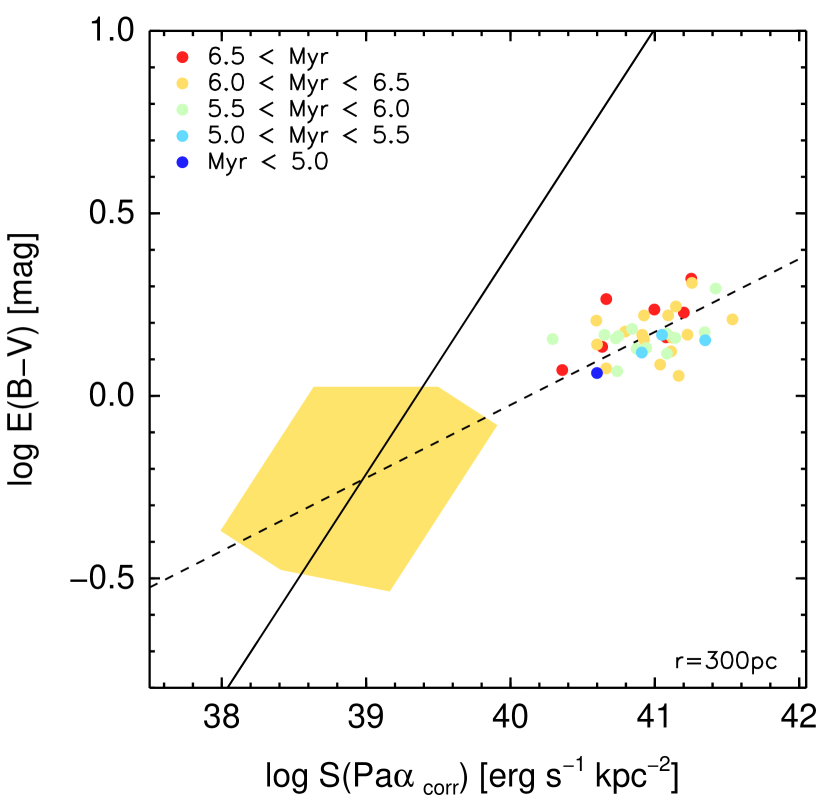
Although we find that the scatter of the / ratio is not related with a residual extinction effect (Fig. 8, right), Cal07 found that SINGS H ii knots with increasing Pa luminosities tend to show higher extinctions. Fig. 9, plotted in LSD units so that it can be directly compared with Fig. 12 of Cal07, shows that such tendency is present in our sample. We find however that the LIRG H ii regions do not follow the extrapolation of the best fit of Cal07, which lies well above (1 dex in E(B-V)) the location of our star-forming regions. We note that the tendency seen for the LIRG H ii regions appears to be consistent with an apparent flattening of the relation for the few data-points of Cal07 with erg s-1 kpc-1.
One possibility is that we are underestimating the extinctions, as they are derived from NIR colors. However, even if we assumed that (stars) 0.44 (gas) (Calzetti et al. 2000), this would imply a correction of only – 0.3 dex, which still would not put the LIRG H ii regions on the extrapolation of the Cal07 fit. In fact, the extrapolation of the Cal07 fit to our Pa LSD regime (erg s-1 kpc-1) would imply color excesses , i.e., visual extinctions mag (for a foreground dust configuration). In contrast, we have obtained relatively modest attenuations for our H ii regions in the range of 4–8 mag. AAH06 also used H/Pa and Pa/Br line ratios to calculate the extinction to the gas and found integrated (2″7″) values for the sample of LIRGs of 2–14 mag, still well below the values we would obtain from the extrapolation of the Cal07 fit.
6. Summary
In this paper we presented T-ReCS sub-arcsecond (FWHM) MIR (m or m) imaging observations of a sample of ten low- (Mpc) nearly solar metallicity () LIRGs, as well as HST/NICMOS continuum and Pa images. The main goal was to study in detail the vs. relationship for H ii regions in LIRGs on scales of a few hundred parsecs (FWHMpc for the average distance Mpc). We performed photometry of H ii regions through apertures with radii of pc (122 H ii regions), pc (84 H ii regions) and pc (49 H ii regions). The first aperture was chosen to take advantage of the high angular resolution afforded by T-ReCS and NICMOS. The large aperture is useful to compare our results with those of Cal07 for H ii regions in the high-metallicity SIGNS galaxies observed with Spitzer/IRAC at m.
We find that although the overall Pa (tracing the youngest ionizing stellar populations) morphologies of LIRGs are similar to those in the MIR, there are some differences on the pc scales. The morphological differences appear to be related to the age of the young stellar populations, with regions of low ratios showing large Pa EW. In general we do not find a relation between red NIR colors, which would indicate high extinction to the stars, and regions of high or low ratios.
On scales of pc the LIRG H ii regions extend the SINGS vs. relation by about two orders of magnitude (as already found by AAH06b) for Pa LSD above erg s-1 kpc-2. When studied on the small scales (pc) the relation holds, although with a slightly shallower slope and a greater (real) scatter around the fit (dex). Taking into account that our sample has a nearly constant metallicity, the scatter of this relation is explained in terms of the ages of the ionizing population and different PAH contributions. There is a tendency for the youngest H ii regions in our sample to show low ratios. Considering instantaneous star formation and assuming that , we naturally reproduce the observed ratios, which vary by a factor of ten, with ages ranging from 4 to 7.5 Myr. The residual dispersion around the model prediction is likely to be caused by the different contribution from galaxy to galaxy of the m PAH feature (in our case) to the 8 emission (and in general, to the IR luminosity), as observationally found by Smith et al. (2007) for the SINGS galaxies.
Although we see a trend for the LIRG H ii regions with the largest Pa LSD to show the highest extinctions to the stars, they do not follow the extrapolation of the relation between the color excess and the Pa LSD found by Cal07, which would imply extinctions in excess of mag. In contrast, they show relatively modest attenuations.
Acknowledgements
We thank the anonymous referee for useful comments and suggestions.
This work has been supported by the Plan Nacional del Espacio under
grant ESP2005-01480 and ESP20076-65475-C02-01. TDS acknowledges support
from the Consejo Superior de Investigaciones Científicas under
grant I3P-BPD-2004. This research has made use of the NASA/IPAC
Extragalactic Database
(NED), which is operated by the Jet Propulsion Laboratory, California
Institute of Technology, under contract with the National Aeronautics
and Space Administration, and of NASA’s Astrophysics Data System (ADS)
abstract service.
References
- Alonso-Herrero et al. (2001) Alonso-Herrero, A., Engelbracht, C. W., Rieke, M. J., Rieke, G. H., & Quillen, A. C. 2001, ApJ, 546, 952
- Alonso-Herrero et al. (2002) Alonso-Herrero, A., Rieke, G. H., Rieke, M. J., & Scoville, N. Z. 2002, AJ, 124, 166
- Alonso-Herrero et al. (2006b) Alonso-Herrero, A., Rieke, G. H., Rieke, M. J., Colina, L., Pérez-González, P. G., & Ryder, S. D. 2006b, ApJ, 650, 835 (AAH06a)
- Alonso-Herrero et al. (2006a) Alonso-Herrero, A., Colina, L., Packham, C., Díaz-Santos, T., Rieke, G. H., Radomski, J. T., & Telesco, C. M. 2006a, ApJ, 652, L83 (AAH06b)
- Bendo et al. (2006) Bendo, G. J., Dale, D. A., Draine, B. T., Engelbracht, C. W., Kennicutt, Jr., R. C., Calzetti, D. et al. 2006, ApJ, 652, 283
- Brandl et al. (2006) Brandl, B. R., Bernard-Salas, J., Spoon, H. W. W., Devost, D., Sloan, G. C., Guilles, S. et al. 2006, ApJ, 653, 1129
- Calzetti et al. (2000) Calzetti, D., Armus, L., Bohlin, R. C., Kinney, A. L., Koornneef, J., & Storchi-Bergmann, T. 2000, ApJ, 533, 682
- Calzetti et al. (2005) Calzetti, D., Kennicutt, Jr., R. C., Bianchi, L., Thilker, D. A., Dale, D. A., Engelbracht, C. W. et al. 2005, ApJ, 633, 871
- Calzetti et al. (2007) Calzetti, D., Kennicutt, R. C., Engelbracht, C. W., Leitherer, C., Draine, B. T., Kewley, L. et al. 2007, ApJ, 666, 870 (Cal07)
- Choi et al. (2006) Choi, P. I., Yan, L., Im, M., Helou, G., Soifer, B. T., Storrie-Lombardi, L. J. et al. 2006, ApJ, 637, 227
- Cohen et al. (1999) Cohen, M., Walker, R. G., Carter, B., Hammersley, P., Kidger, M., & Noguchi, K. 1999, AJ, 117, 1864
- Díaz-Santos et al. (2007) Díaz-Santos, T., Alonso-Herrero, A., Colina, L., Ryder, S. D., & Knapen, J. H. 2007, 661, 149
- Elbaz et al. (2002) Elbaz, D., Cesarsky, C. J., Chanial, P., Aussel, H., Franceschini, A., Fadda, D., & Chary, R. R. 2002, A&A, 384, 848
- Engelbracht et al. (2006) Engelbracht, C. W., Kundurthy, P., Gordon, K. D., Rieke, G. H., Kennicutt, R. C., Smith, J.-D. T. et al. 2006, ApJ, 642, L127
- Genzel et al. (1998) Genzel, R., Lutz, D., Sturm, E., Egami, E., Kunze, D., Moorwood, A. F. M. et al. 1998, ApJ, 498, 579
- Helou et al. (2004) Helou, G., Roussel, H., Appleton, P., Frayer, D., Stolovy, S., Storrie-Lombardi, L. et al. 2004, ApJS, 154, 253
- Kennicutt et al. (2003) Kennicutt, Jr., R. C., Armus, L., Bendo, G., Calzetti, D., Dale, D. A., Draine, B. T. et al. 2003, PASP, 115, 928
- Kotilainen et al. (1996) Kotilainen, J. K., Moorwood, A. F. M., Ward, M. J., & Forbes, D. A. 1996, A&A, 305, 107
- Lebouteiller et al. (2007) Lebouteiller, V., Brandl, B., Bernard-Salas, J., Devost, D., & Houck, J. R. 2007, ApJ, 665, 390
- Leitherer et al. (1999) Leitherer, C., Schaerer, D., Goldader, J. D., Delgado, R. M. G., Robert, C., Kune, D. F. et al. 1999, ApJS, 123, 3
- Levenson et al. (2004) Levenson, N. A., Weaver, K. A., Heckman, T. M., Awaki, H., & Terashima, Y. 2004, ApJ, 602, 135
- Lira et al. (2002) Lira, P., Ward, M., Zezas, A., Alonso-Herrero, A., & Ueno, S. 2002, MNRAS, 330, 259
- Lutz et al. (1998) Lutz, D., Spoon, H. W. W., Rigopoulou, D., Moorwood, A. F. M., & Genzel, R. 1998, ApJ, 505, L103
- Neff et al. (2003) Neff, S. G., Ulvestad, J. S., & Campion, S. D. 2003, ApJ, 599, 1043
- Packham et al. (2005) Packham, C., Radomski, J. T., Roche, P. F., Aitken, D. K., Perlman, E., Alonso-Herrero, A. et al. 2005, ApJ, 618, L17
- Peeters et al. (2004) Peeters, E., Spoon, H. W. W., & Tielens, A. G. G. M. 2004, ApJ, 613, 986
- Pollack et al. (2007) Pollack, L. K., Max, C. E., & Schneider, G. 2007, ApJ, 660, 288
- Povich et al. (2007) Povich, M. S., Stone, J. M., Churchwell, E., Zweibel, E. G., Wolfire, M. G., Babler, B. L. et al. 2007, ApJ, 660, 346
- Relaño et al. (2007) Relaño, M., Lisenfeld, U., Pérez-González, P. G., Vílchez, J. M., & Battaner, E. 2007, ApJ, 667, L141
- Rieke et al. (1993) Rieke, G. H., Loken, K., Rieke, M. J., & Tamblyn, P. 1993, ApJ, 412, 99
- (31) Roche, P. F. & Aitken, D. K. 1985, MNRAS, 215, 425
- Sajina et al. (2007) Sajina, A., Yan, L., Armus, L., Choi, P., Fadda, D., Helou, G., & Spoon, H. 2007, ApJ, 664, 713
- Sanders et al. (2003) Sanders, D. B., Mazzarella, J. M., Kim, D.-C., Surace, J. A., & Soifer, B. T. 2003, AJ, 126, 1607
- (34) Siebenmorgen, R., Krügel, E., & Spoon, H. W. W. 2004, A&A, 414, 123
- Smith et al. (2007) Smith, J. D. T., Draine, B. T., Dale, D. A., Moustakas, J., Kennicutt, Jr., R. C., Helou, G. et al. 2007, ApJ, 656, 770
- Takeuchi et al. (2005) Takeuchi, T. T., Buat, V., Iglesias-Páramo, J., Boselli, A., & Burgarella, D. 2005, A&A, 432, 423
- Tacconi-Garman et al. (2005) Tacconi-Garman, L. E., Sturm, E., Lehnert, M., Lutz, D., Davies, R. I., & Moorwood, A. F. M. 2005, A&A, 432, 91
- Telesco et al. (1998) Telesco, C. M., Pina, R. K., Hanna, K. T., Julian, J. A., Hon, D. B., & Kisko, T. M. 1998, in Presented at the Society of Photo-Optical Instrumentation Engineers (SPIE) Conference, Vol. 3354, Proc. SPIE Vol. 3354, p. 534-544, Infrared Astronomical Instrumentation, Albert M. Fowler; Ed., ed. A. M. Fowler, 534–544
- Vacca & Conti (1992) Vacca, W. D., & Conti, P. S. 1992, ApJ, 401, 543
- Vázquez & Leitherer (2005) Vázquez, G. A., & Leitherer, C. 2005, ApJ, 621, 695
- (41) Voit, G. M. 1992, MNRAS, 258, 841
- Weedman et al. (2005) Weedman, D. W., Hao, L., Higdon, S. J. U., Devost, D., Wu, Y., & Charmandaris, V. et al. 2005, ApJ, 633, 706
- Wilson et al. (2006) Wilson, C. D., Harris, W. E., Longden, R., & Scoville, N. Z. 2006, ApJ, 641, 763
- Wu et al. (2005) Wu, H., Cao, C., Hao, C.-N., Liu, F.-S., Wang, J.-L., Xia, X.-Y. et al. 2005, ApJ, 632, L79
| Galaxy | z | Dist | log LIR | Type | 12+log(O/H) |
|---|---|---|---|---|---|
| name | () | (Mpc) | (L⊙) | ||
| (1) | (2) | (3) | (4) | (5) | (6) |
| NGC 1614 | 0.01594 | 69.1 | 11.67 | H ii | 8.6a |
| NGC 2369 | 0.01081 | 46.7 | 11.14 | H ii | 8.9 |
| NGC 3256 | 0.00935 | 40.4 | 11.67 | H ii | 8.8 |
| NGC 5135 | 0.01369 | 59.3 | 11.27 | Sy2 | 8.7 |
| IC 4518W | 0.01573 | 68.2 | 11.09 | Sy2 | 8.6 |
| IRAS 17138-1017 | 0.01734 | 75.3 | 11.39 | H ii | 8.9 |
| IC 4687 | 0.01735 | 75.3 | 11.55: | H ii | 8.8 |
| IC 4734 | 0.01561 | 67.7 | 11.28 | H ii/L | 9.0 |
| NGC 7130 | 0.01615 | 70.1 | 11.39 | L/Sy | 8.8 |
| IC 5179 | 0.01142 | 49.3 | 11.20 | H ii | 8.9 |
Note. — (1) Galaxy; (2) Redshift (NED); (3) Distance as obtained with the cosmology: , , ; (4) Infrared luminosity as computed from fluxes (Sanders et al. 2003) and with the prospect given by Sanders & Mirabel (1996) (their Table 1); (5) Nuclear activity of the galaxy; (6) Oxygen abundance taken from Relaño et al. (2007) and a Vacca & Conti (1992)
| Galaxy | Filter | tint | Date | Seeing |
|---|---|---|---|---|
| name | (s) | (″) | ||
| (1) | (2) | (3) | (4) | (5) |
| NGC 1614 | Si-2 | 1680 | 09/16-30/2006 | 038 |
| NGC 2369 | Si-2 | 840 | 09/30/2006 | 038 |
| NGC 3256 | Si-2 | 300 | 03/04/2006 | 030 |
| NGC 5135 | 600 | 03/04/2006 | 031 | |
| IC 4518W | 1200 | 04/10-18/2006 | 033 | |
| IRAS 17138-1017 | Si-2 | 840 | 09/09/2006 | 041 |
| IC 4687 | Si-2 | 840 | 09/09/2006 | 031 |
| IC 4734 | Si-2 | 840 | 09/09/2006 | 031 |
| NGC 7130 | 600 | 09/18/2005 | 032 | |
| IC 5179 | Si-2 | 840 | 09/28/2006 | 033 |
Note. — (1) Galaxy; (2) Filter with which each galaxy was observed; (3) On-source integration time; (4) Date(s) of the observations; (5) Seeing (FWHM of the reference standard star)
| Galaxy | pc | pc | |||
|---|---|---|---|---|---|
| name | FWHM | MIR | Pa | MIR | Pa |
| (″) | (mJy) | (mJy) | (mJy) | (mJy) | |
| (1) | (2) | (3) | (4) | (3) | (4) |
| (m) filter | |||||
| NGC 5135 | 036 | 31 | 0.55 | 95 | 3.2 |
| IC 4518W | 039 | 38 | 0.96 | 118 | 3.9 |
| NGC 7130 | 045 | 38 | 1.27 | 148 | 5.5 |
| Si-2 (m) filter | |||||
| NGC 1614 | 063 | 28 | 2.19 | 346 | 34 |
| NGC 2369 | 060 | 16 | 0.80 | 95 | 4.1 |
| NGC 3256 | 047 | 109 | 6.57 | 427 | 27 |
| IRAS 17138-1017 | 083 | 6 | 0.20 | 47 | 1.4 |
| IC 4687 | … | 4 | 0.09 | 43 | 1.4 |
| IC 4734 | 090 | 10 | 0.70 | 80 | 4.7 |
| IC 5179 | 087 | 13 | 1.30 | 70 | 4.7 |
Note. — The flux densities presented in this table have not been corrected for extinction and are subject to the uncertainties explained in § 2. MIR -band flux densities are shown without the color correction applied (see § 2.4). (1) Galaxy; (2) FWHM of the region selected as the nucleus of the galaxy; the nucleus of IC 4687 is very diffuse so no FWHM could be measured; (3) and (4) Median MIR and Pa flux densities of the nuclei. The nuclei of NGC 5135 and IC 4518W appear as almost point sources in the MIR images (compare with Table 2). An aperture correction factor of 2 and 2.5, respectively, should be applied to the values of the smallest aperture if the flux densities of the point sources want to be obtained; Values of (3)–(4) are given for the smallest (pc) and largest apertures (pc).
| Galaxy | pc | pc | ||||
|---|---|---|---|---|---|---|
| name | # | MIR | Pa | # | MIR | Pa |
| (mJy) | (mJy) | (mJy) | (mJy) | |||
| (1) | (2) | (3) | (4) | (2) | (3) | (4) |
| (m) filter | ||||||
| NGC 5135 | 15 (1) | 3.7 | 0.29 | 3 | 42 | 3.2 |
| IC 4518W | 4 | 1.1 | 0.11 | 1 | 32 | 1.6 |
| NGC 7130 | 9 (4) | 0.6 | 0.05 | 2 (1) | 10 | 1.2 |
| Si-2 (m) filter | ||||||
| NGC 1614 | 13 (2) | 3.6 | 0.21 | 7 (1) | 14 | 0.9 |
| NGC 2369 | 6 | 6.8 | 0.49 | 2 | 84 | 4.0 |
| NGC 3256 | 20 (2) | 6.1 | 0.64 | 5 (2) | 58 | 5.3 |
| IRAS 17138-1017 | 11 | 2.8 | 0.13 | 4 | 34 | 1.3 |
| IC 4687 | 24 (3) | 1.3 | 0.08 | 12 (1) | 16 | 1.0 |
| IC 4734 | 4 | 4.8 | 0.30 | 2 | 44 | 2.9 |
| IC 5179 | 16 (7) | 1.6 | 0.16 | 3 (2) | 20 | 1.6 |
Note. — The flux densities presented in this table have not been corrected for extinction and are subject to the uncertainties explained in § 2. (1) Galaxy; (2) Final number of H ii regions selected in each LIRG. In parentheses are given the number of detections; (3) and (4) Median MIR and Pa flux densities of the H ii regions selected in the T-ReCS images (see text for details); Values of (2)–(4) are given for the smallest (pc) and largest apertures (pc).