Heavy-tailed distribution of cyber-risks
Abstract
With the development of the Internet, new kinds of massive epidemics, distributed attacks, virtual conflicts and criminality have emerged. We present a study of some striking statistical properties of cyber-risks that quantify the distribution and time evolution of information risks on the Internet, to understand their mechanisms, and create opportunities to mitigate, control, predict and insure them at a global scale. First, we report an exceptionnaly stable power-law tail distribution of personal identity losses per event, , with . This result is robust against a surprising strong non-stationary growth of ID losses culminating in July 2006 followed by a more stationary phase. Moreover, this distribution is identical for different types and sizes of targeted organizations. Since , the cumulative number of all losses over all events up to time increases faster-than-linear with time according to , suggesting that privacy, characterized by personal identities, is necessarily becoming more and more insecure. We also show the existence of a size effect, such that the largest possible ID losses per event grow faster-than-linearly as with the organization size . The small value of the power law distribution of ID losses is explained by the interplay between Zipf’s law and the size effect. We also infer that compromised entities exhibit basically the same probability to incur a small or large loss.
I Introduction
The Internet has developed into a global system of interconnected computer networks that allows the exchange of data between millions of private and public, academic, business, and government organizations. By making possible new forms of social interactions as well as new ways to probe them, the Internet provides a unique tool for studying the development and the organization of an archetypical complex system.
But, as in all complex biological and social systems known to us, upgrades of capacity, improved networking and additions of functionalities come together with its bundle of parasites, viruses and criminals. We ask what are the laws, in any, codifying this dynamics, and what are the possible roles and consequences of such apparently negative developments?
In biology, there is a growing realization that evolution has been driven and shaped by bacteria and viruses evolvirus . Similarly, social organizations, which are founded on laws and regulations, and which are anchored on national (as well as sub- and super-national) boundaries, have arguably been shaped in significant part by the need to coordinate and cooperate in the face of disruptions emerging from within and from the outside. In this vein, we ask what may the exploding level of criminality and of unlawful exploitation of the Internet teach us on the organization of other complex systems? Are there robust dynamics or universal laws that can be inferred and tested? What does the fact, that electronic crime has appeared and developed concommittantly with the growth of the Internet, teach us on its organization, its vulnerabilities and its future development?
Given the breadth of these questions, our contribution is to focus on a specific criminality which is now becoming rampant, the theft of personal information (ID thefts). Using the most complete dataset from the Open Security Foundation datalossdb , we are able to identify an explosive growth of ID losses followed by a regime which seems to have matured into a stationary phase. We document a very heavy-tailed power-law distribution (an often reported hallmark of complex systems) of severities of ID theft events, which is robust over all time periods and across different types of social organizations (private and public). By quantifying the scaling of losses as a function of organization sizes, we unearth a significant size effect.
II Maturation and severity of ID losses: non-stationary and stationary properties
II.1 Contextual data description
From early (gentle) hackers breaking in systems to demonstrate their skills, some turned into seasoned “black hats” making money as part of an explosively growing business based on ubiquitous Internet insecurityfrei2006 ; zittrain2008 . Compared with the attacks that used to disrupt network on a large scale, most electronic attacks nowadays extract out valuable data while remaining quite furtive mansell2005tac . This can be likened to an electronic form of massive parasitism. In terms of monetary value and volume, one of the largest types of data targeted by pirates is personal identity information (ID), such as credit card numbers, social security numbers, banking accounts, and medical files. Since each ID theft or leakage is a “loss of control” of one’s individual private data, it can be considered already as a damaging event, forerunning the potential realized financial and/or social losses kanderson2008 . Actually, stealing ID’s is the goal which is common to a wide spectrum of non-destructive Internet attacks focused on profit, from botnets to highly tailored attacks dagon2007 ; botnet_idtheft_case ; schneier2005rtp ; koops2006iti . The (uncontrolled) dissemination of personal information raises the important social issue of people’s identity resilience in the information technology era kanderson2008 ; mansell2005tac . In our quantitative study of cyber-risks, we take a ID theft as a usable elementary unit of cyber-risks, for two main reasons. First, it provides a natural metric of the “permeability” of information systems, guiding towards the identification of the underlying mechanisms. Second, it offers a common basis, or currency, to compare a large variety of heterogeneous events involving many different types of organizations.
ID loss event data have been thoroughly collected by several independant organizations. We use the most complete dataset from the Open Security Foundation datalossdb , that contains 956 documented events reported mainly in the USA between year 2000 and November 2008. The catalog provides also the involved organization, the date and amount of loss (measured as the numbers of ID stolen). Data are homogeneously sampled among various types of organizations: business (35%), education (30%), governments (24%) and medical institutions (10%). We define an event following the procedure described in Ref.datalossdb ; hasan2006sad . For instance, the largest entries in the data set are (i) the discovery and disclosure of an attack over several years of the TJX Companies with a probable exposition of more than 90 millions IDs (end of the event: January 2007), (ii) the Cardsystems’ hack impacting 40 million Visa, MasterCard and American Express cardholders (June 2005), (iii) America Online (30 million credit card ID exposed in 2004), and (iv) the U.S. Department of Veterans Affair (more than 25 million of ID stolen in 2006). While there is not warranty of completeness, our tests below suggest that the catalog of the Open Security Foundation provides a reasonable representative sample of the overall activity of ID thefts occurring on the Internet.
II.2 Transition from explosive growth to statistical stationarity
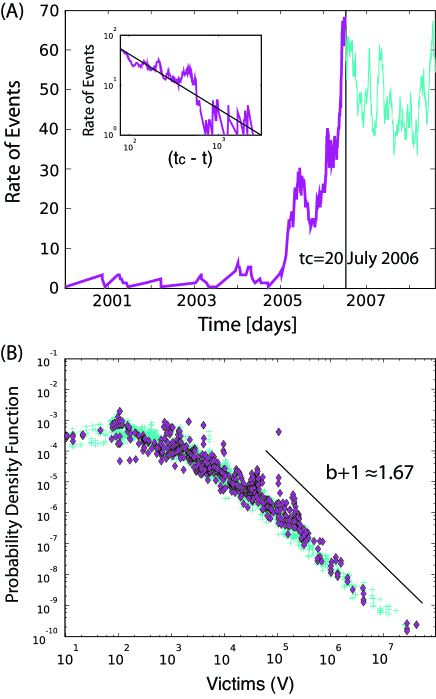
The total rate of ID theft events (measured by the number of events in a sliding window of 50 days) is shown in the top panel of Figure 1 as a function of time. This panel reveals the existence of two distinct phases. Starting from 2000, one can observe a dramatic increase of the rate of attacks up to a peak reached in July 2006, followed by a plateau thereafter. The inset shows a simple non-parametric test suggesting that the first regime was characterized by a faster-than-exponential growth. Such singular behavior characterized by a transient explosive growth mathematically modeled by a power law finite-time singularity is the diagnostic of an impending change of regime JS2001 ; IS2002 ; GS2002 , which we indeed observe beyond the peak in July 2006. This suggests to interpret the time evolution of the rate of ID loss events as first undergoing a non-sustainable growth followed by a maturity period which characterizes the present epoch.
The lower panel of Figure 1 demonstrates that the distribution of event sizes (defined as the total number of ID stolen in that event) has remained stable, within statistical fluctuations, over the whole time period investigated here from 2000 to Nov. 2008. There is no significant difference between the probability density functions (PDF) in the growth regime before July 2006 (red circles) and during the maturity period (blue diamonds), as evidenced by the perfect collapse of the PDFs. Indeed, Q-Q plots of one sample as a function of other samples and in function of the entire sample, were found to be approximately linear with slope . This suggests that the mechanism underlying the loss of ID has remained stable, notwithstanding the enormous evolutions that have occurred over this whole time period.
The two pieces of information provided by the two panels of Figure 1 imply that the rate of events of size occurring at time can be factorized under the form
| (1) |
where and constitute two independent contributors to cyber-risks. The macro-variable embodies the overall evolution of the level of threat associated with ID losses. In other words, it provides a metric quantifying the systemic “state of insecurity” of the Internet. In contrast, measures the relative frequency of large versus small ID losses. While the rate of attacks has varied enormously between 2000 and 2008 as shown by the behavior of in the upper panel of Figure 1, the relative frequencies of various event sizes has remained remarkably stable, as shown in the lower panel of Figure 1. We now turn to the determination of in order to characterize quantitatively the level of cyber risks per event.
III Distribution of ID theft event sizes and consequences
III.1 Power-Law versus Stretched Exponential
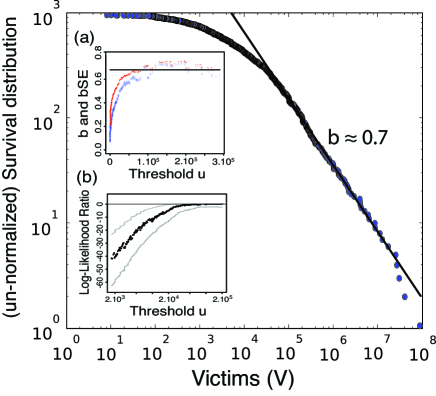
Given the result of the previous section that a unique distribution is sufficient to describe the frequency of event sizes in all time windows from 2000 to 2008, we now determine by using the largest possible statistical sample including all events of this period. Figure 2 presents the (non-normalized) empirical survival (also called complementary cumulative) distribution function , defined as the probability that the number of victims in a given event is larger than or equal to in the range . Note that has a shape similar to the PDFs shown in the lower panel of Figure 1 with an approximately straight tail in this double-logarithmic scale, suggesting a power law distribution
| (2) |
This power law (2) is observed over more than three decades above the lower threshold . A maximum likelihood estimation (MLE) of the exponent determines . If model (2) is a correct description of the survival distribution, then , which is shown as a straight line with slope in the lower panel of Figure 1. This result suggests that ID thefts have statistics similar to those observed in the large class of systems with heavy-tails, such as firm and city sizes in the social sciences or earthquakes and other calamities in the natural sciences.
However, visual evidence and MLE are not sufficient to demonstrate that the power law (2) is adequate to describe our statistical data of ID thefts, as discussed in several earlier works LS1998 ; malevergne2005eds ; ClausetNewman2007 . To prove that the one-parameter power law (2) is sufficient, we embed it into a broader two-parameter law that have previously been reported to provide a flexible model of many empirical fat-tailed distribution LS1998 and perform a standard log-likelihood ratio (Wilks) test. Specifically, we use the “stretched exponential” (SE) family
| (3) |
where and are respectively the shape and scale parameters of the SE distribution. Malevergne et al. malevergne2005eds have shown that the power law family (2) is asymptotically embedded in this SE family in the limit
| (4) |
This has two practical applications: (i) the calibration of and for a given provides an alternative determination (using (4) of the exponent of the power law (2) if is indeed small (typically less than ); (ii) we can use the formal likelihood ratio test of embedded hypotheses which has been shown to hold for the power law seen as asymptotically embedded in the SE family malevergne2005eds ; malevergne2006efr , to determine whether the one-parameter power law is sufficient or a two-parameter distribution like the SE is necessary. Inset (a) in Fig 2 shows the estimated exponent obtained from the maximum likelihood estimation (MLE) of and translated into via the equation derived from (4), as a function of the lower threshold . For , we obtain an excellent confirmation of the value determined from the direct MLE of the power law (2). Inset (b) in Figure 2 shows in addition the logarithm of the likelihood ratio (LLR) of the power law versus the SE fits: for , LLR indicating that the power law is not sufficient and that the SE is necessary; in contrast, for , the power law is sufficient and the SE is not necessary, degenerating into the power law as the condition (4) becomes valid.
III.2 Evidence for incompleteness of reported losses for small event sizes
We now discuss two possible hypotheses for the observed cross-over at below which the distributions shown in the lower panel of Figure 1 and in Figure 2 exhibit a significant downward curvature characterizing a deviation from the power law (2).
A first possible interpretation is that this deviation from the power law reflects the fact that hackers are preferentially targeting large organizations offering substantial potential gains. As a consequence, there would be practically no ID thefts involving only a few individuals. This hypothesis does not stand closer scrutiny: there is strong evidence that millions of home computers are compromised botnet_idtheft_case via the use of botnet deployment mechanisms centrally managed by pirates dagon2007 , with each computer infection being a unique event potentially leading to ID thefts limited to those IDs which are stored in the computer. According to Vinton Cerf’s, millions computers over a total of millions are compromisedcerf2008 . As a rough estimation, assuming that all computers have about the same probability of being infected and counting one computer per Internet user, this implies that about one sixth of US computers are exposed. Thus, about 50 millions US citizen are constantly exposed to attacks targeting their own computer. Such events should thus provide a huge population of small ID theft events’ which is absent from even the most complete dataset of the Open Security Foundation datalossdb .
III.3 Super-linear growth of the ID loss threat
There is another remarkable consequence deriving straightforwardly from the power law (2) with exponent . Indeed, the smallness of the power law exponent implies a typical faster-than-linear growth of cumulative losses with time. Because and assuming that there are no upper threshold yet relevant, the mean and variance of the number of ID losses per event are mathematically infinite. In practice, this means that their values in any finite catalog exhibit growing random fluctuations as the number of recorded events increases, due to the never decreasing influence of the largest event sizes. Then, the cumulative sum of all losses over all events up to time is controlled by the few largest events in the catalog sornette2006cpn . This leads to a faster-than-linear growth
| (5) |
This results is solely due to the statistical mechanism that, as more events occur, some are bound to explore more and more the tail of the heavy-tailed power law distribution (2). Note this law (5) constitutes a lower bound, which is attained only when the rate of event occurrences is itself not growing, as seems to be the case since July 2006.
Such faster-than-linear growths due to the pure statistical power law mechanism have been documented in natural hazards for losses caused by floods pisarenko1998nlg and for the cumulative seismic energy released at regional scales rodkin (see sornette2006cpn for a detailed mathematical derivation and discussion). Given the heavy-tail nature of the distribution of ID theft numbers per event, we should not be surprised that the Internet appears more and more insecure and dangerous, just as a result of this mechanism.
IV In cyber-risks, size matters
IV.1 Cross-sectional universality of ID losses
We have shown that the PDF of event sizes is constant over time. We now investigate whether there exists some difference between the PDFs of event sizes in a cross-sectional analysis of different sectors of activity, which could reveal different vulnerability characteristics.
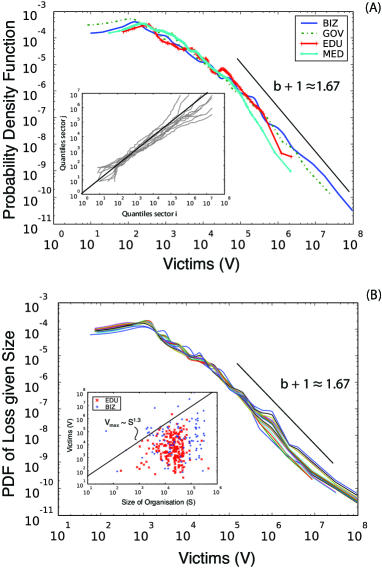
Our datasource uses four distinct sectors of activity: publicly traded companies (Biz), schools and universities (Edu), governmental agencies (Gov), and medical services (Med). Distinct regulations and industry benchmarking imply that organizations implement homogenous security processes in a given sector, but these security processes operating in a given sector are different from those in a different sector. A priori, one could expect that distinct factors acting in these different sectors imply dissimilar attractiveness to hackers leading to different levels of vulnerability, which should be revealed in the statistical properties of the catalogs of ID losses. In contradiction with this anticipation, the top panel of Figure 3 shows that one cannot reject the hypothesis that the PDFs of ID loss size per event are identical for the four sectors Biz, Edu, Gov, Med.
If two typical organizations belonging to two different sectors are subjected to distinct exposition and permeability threats, the remarkable conclusion suggested by the top panel of Figure 3 is that the associated level of security just compensates for the increasing threat, putting all organizations at a similar overall risk level. This result is reminiscent of the effect documented in Refs.carlson2000PRL ; doyle2005pnas , that systems exposed to different distributions of attacks converge to similar level of vulnerabilities when they try to optimize their efficiency in the presence of constraints. This could mean that organizations, which are indeed attempting to optimize their defenses against cyber-risks, may have already reached an intrinsic barrier. With the evolving nature of the threats and given the complexity of the associated processes in the presence of limited resources, the observed level of ID losses may be a robust dynamical equilibrium that will be difficult to improve upon. This suggests that, in absence of a fundamentally new qualitative paradigm, these cyber-risks are bound to remain with us for the foreseeable future.
IV.2 Size effects of vulnerabilities to cyber-risks
The bottom panel of Figure 3 plots the PDFs of victims per event sorted by target organization sizes. There are several possible measures for the size of an organization. Here, we take the number of employees, which correlated well with other measures axtell2001zdu . The PDFs are constructed for 269 universities univ and 105 publicly traded companies bloomberg . The good collapse of the PDFs confirms the universality of the power law distribution of event loss sizes, as in Fig.1 and Fig. 2.
However, the tails of the PDFs are truncated at upper values which seem to grow with the organization sizes. This size effect is better revealed by the scatter plot of the inset in the bottom panel of Figure 3, which shows that the largest losses for a given range of organization sizes seem to grow with . This visual impression is confirmed by performing linear regressions of as a function of , , where is the 99% quantile of the losses for a given organization size . We find a stable determination of the exponent . This means that the largest losses for a given set of entities of size grow with as .
Naively, one would have expected a linear growth with . The faster-than-linear law may express a combination of effects, which include a faster-than-linear growth of the number of IDs stored in a given entity as a function of its number of employees, a bigger exposition that makes the attacks of large entities more attractive to hackers and possibly a greater vulnerability due to more bridges or “boundaries” with the external world which are more difficult to manage. The faster-than-linear law is characteristic of a size effect which is similar to the size effects documented for instance in material failure bavzant1997sqf and species fragility cardillo2003bde .
We now show how is related to the exponent of the PDFs of event loss sizes defined in (2). For this, we write the probability to find an event with more than ID losses as
| (6) |
where is a minimum size for an organization to be viable, and is the distribution of organization sizes, well-known to follow Zipf’s law ( with ) axtell2001zdu ; zipf1949hba ; gabaix1999zsl so that is the number of organizations with sizes between and . Moreover, is the probability to find an event with more than ID losses in a given organization of size . We know one property of , namely that it drops abruptly to vanishing values for , where is a positive constant, as documented above. This implies that, for a fixed , all integrants with do not contribute to the integral. Motivated by the power law (2), we also assume a power law shape for with exponent . Putting all this together, expression (6) becomes
| (7) |
with . This yields . Identifying this power law with (2) in the tail gives . Given that , we have . Since , this calculation allows us to infer that the distribution of ID losses for a given organization is fairly flat (). In other words, the efforts necessary to get just a few or a large number of IDs are not much different, once an organization has been compromised. Our conclusion does not rely sensitively on the validity of Zipf’s law. However, the value imposes a bound on the exponent of Zipf’s law which cannot be significantly larger than .
V Conclusion
We have presented three different tests that confirm the general validity and robustness of the probability distribution of ID losses per event (where ID losses has been taken as a proxy for information risks on the Internet). We showed that the PDFs are the same irrespective of (i) the growth phase before July 2006 versus stationary regime thereafter, (ii) the sectors of activity, and (iii) the size of targeted organisations. Returning to the questions raised in the introduction, it is striking and a priori counter intuitive to find that all organisations are evenly vulnerable, whatever their implemented information security. This raises important questions concerning the tradeoff between exposition and counter-measures in the complex evolving landscape of cyber-risks. The consequences on the evolution of the Internet remain to be studied. This present paper provides a first partial approach of the study of the development of the Internet and of cyber-risks taking into account their intricate entanglement.
We have shown the existence of a size effect, such that the largest possible ID losses per event grow faster-than-linearly with the organization size. This has led us to derive two important consequences. First, the small value of the power law distribution of ID thefts is explained by interplay between Zipf’s law and the size effect. Second, we have found indirect evidence that compromised entities typically expose to hackers a small or large number of IDs with basically the same frequency. This inference is very important for the quantification of cyber risks and suggests that counter-measures should be targeted towards building internal barriers, avoiding the “Titanic” effect of inadequate compartmentalization.
Acknowledgements: This work was supported by the Swiss National Foundation, grant 2-77059-07 and by the MTEC Foundation (Fordergesellschaft fur Betriebswissenschaften MTEC), We also acknowledge financial support from the ETH Competence Center “Coping with Crises in Complex Socio-Economic Systems” (CCSS) through ETH Research Grant CH1-01-08-2.
References
- (1) Hamilton G Viruses (2008), The unsung heroes of evolution, New Scientist, 2671, 38-41.
- (2) datalossdb, http://datalossdb.org/ (06.01.2009)
- (3) Frei S, May M, Fiedler U, Plattner B (2006), Large Scale Vulnerability Analysis, ACM SIGCOMM 2006 Workshop.
- (4) Zittrain J (2008) The Future of the Internet–And How to Stop It? (Yale University Press).
- (5) Mansell R and Collins B-S (2005) Trust and crime in information societies (Edward Elgar Northampton, MA)
- (6) Anderson K, Durbin E and Salinger M (2008) Identity Theft Journal of Economic Perspectives 2,171-192.
- (7) D. Dagon et al. (2007) 23rd Annual Computer Security Applications Conference.
-
(8)
United States Attorney’s Office,
http://www.usdoj.gov/usao/cac/pressroom/pr2007/143.html (06.01.2009). - (9) Schneier B (2005) Risks of third-party data, Communications of the ACM 48.
- (10) Koops B, Leenes R (2006) Identity theft, identity fraud and/or identity-related crime, Datenschutz und Datensicherheit-DuD 30, 553.
- (11) Hasan R and Yurcik W (2006) A statistical analysis of disclosed storage security breaches, Proceedings of the second ACM workshop on Storage security and survivability pp. 1–8.
- (12) Johansen A and Sornette D (2001) Finite-time singularity in the dynamics of the world population and economic indices, Physica A 294 (3-4), 465-502 .
- (13) Ide K and Sornette D (2002) Oscillatory Finite-Time Singularities in Finance, Population and Rupture, Physica A 307 (1-2), 63-106
- (14) Gluzman S and Sornette D (2002) Classification of Possible Finite-Time Singularities by Functional Renormalization, Physical Review E 6601 016134, N1 PT2:U315-U328.
- (15) Laherrère J and Sornette D (1998) Stretched exponential distributions in Nature and Economy: “Fat tails” with characteristic scales, European Physical Journal B 2, 525-539 .
- (16) Clauset A, Shalizi C-R and Newman M-E-J (2007) Power-law distributions in empirical data, http://arxiv.org/abs/0706.1062.
- (17) Malevergne Y, Pisarenko VF and Sornette D (2005) Empirical Distributions of Log-Returns: between the Stretched Exponential and the Power Law? , Quantitative Finance 5 (4), 379-401 .
- (18) Malevergne Y, Sornette D (2006) Extreme Financial Risks: From Dependence to Risk Management (Springer, Heidelberg).
- (19) BBC article on Vinton Cerf’s WEF talk, http://news.bbc.co.uk/2/hi/business/6298641.stm (06.01.2009).
- (20) Sornette D (2006) Critical Phenomena in Natural Sciences, 2nd ed. (Springer Series in Synergetics, Heidelberg).
- (21) Pisarenko V (1998) Non-linear growth of cumulative flood losses with time, Hydrological Processes 12, 461 .
- (22) Rodkin M, Pisarenko V (2001) Damage and casualties in earthquakes: a statistical analysis, Computational Seismology, 2000, Iss.31, 242-272, (in Russian). English translation in Computational Seismology and Geodynamics 5.
- (23) J. Carlson, J. Doyle (2000) Highly Optimized Tolerance: Robustness and Design in Complex Systems, Physical Review Letters84, 2529-2532.
- (24) J. Doyle et al. (2005) The robust yet fragile nature of the Internet, Proceedings of the National Academy of Sciences41, 14497-14502.
- (25) R. Axtell (2001) Zipf Distribution of US Firm Sizes, Science 293, 1818.
- (26) Source: Official websites from universities. University population is composed with students, graduates, administrative staff and faculty.
- (27) Source: Bloomberg
- (28) Z. Bažant (1997) Scaling of quasibrittle fracture: asymptotic analysis, International Journal of Fracture 83, 19.
- (29) Cardillo M. (2003) Biological determinants of extinction risk: why are smaller species less vulnerable?, Animal Conservation 6, 63.
- (30) G. Zipf (1949) Human behavior and the principle of least effort
- (31) Gabaix X. (1999) Zipf’S Law For Cities: An Explanation, The Quarterly Journal of Economics 114, 739.
- (32) K. Cranmer (2001) Computer Physics Communications3,198-207.