The hard X-ray spectral evolution in X-ray binaries and its application to constrain the black hole mass of ultraluminous X-ray sources
Abstract
We investigate the relationship between the hard X-ray photon index and the Eddington ratio () in six X-ray binaries (XRBs) with well constrained black hole masses and distances. We find that different XRBs follow different anti-correlations between and when is less than a critical value, while and generally follow the same positive correlation when is larger than the critical value. The anti-correlation and the positive correlation may suggest that they are in different accretion modes (e.g., radiatively inefficient accretion flow (RIAF) and standard disk). We fit both correlations with the linear least-square method for individual sources, from which the crosspoint of two fitted lines is obtained. Although the anti-correlation varies from source to source, the crosspoints of all sources roughly converge to the same point with small scatter (), which may correspond to the transition point between RIAF and standard accretion disk. Motivated by the observational evidence for the similarity of the X-ray spectral evolution of ultraluminous X-ray sources (ULXs) to that of XRBs, we then constrain the black hole masses for seven ULXs assuming that their X-ray spectral evolution is similar to that of XRBs. We find that the BH masses of these seven luminous ULXs are around , which are typical intermediate-mass BHs (IMBHs). Our results are generally consistent with the BH masses constrained from the timing properties (e.g., break frequency) or the model fitting with a multi-color disk.
1 Introduction
Ultraluminous X-ray sources (ULXs) are pointlike, nonnuclear X-ray sources with X-ray luminosities between and , well in excess of the Eddington limit for a stellar mass black hole (BH, , with the mass of the BH). The existence of temporal variability on a variety of timescales in these ULXs suggests that they are accreting objects. However, the true nature of these sources is still unclear, especially their BH mass (for recent reviews, see Miller & Colbert 2004; Fabbiano & White 2006). Current models for these objects center around two alternatives: (1) they are “intermediate-mass BHs” (IMBHs) with mass , accreting at sub-Eddington rates (e.g., Colbert & Mushotzky 1999; Makishima et al. 2000; Kaaret et al. 2003; Miller et al. 2003; Yuan et al. 2007; Liu & Di Stefano 2008); (2) they are stellar mass BHs, accreting with super-Eddington rates (e.g., Watarai et al. 2001; Begelman 2002; Vierdayanti, et al. 2006), or X-ray binaries (XRBs) with anisotropic emission (King et al. 2001), or beamed XRBs with relativistic jets directly pointing toward us (e.g., Mirabel & Rodriguez 1999). In several ULX systems (e.g., NGC 1313 X-2, M81 X-9, etc), detection of emission nebulae surrounding the ULX supports isotropic emission from the central source, which cannot be explained through beaming (Pakull & Mirioni 2003).
Spectral state transitions are essential characteristics of XRBs and both the low/hard state and high/soft states have been observed in most XRBs. Typically, the X-ray energy spectrum in the hard state can be well described as a power law with a photon index . The energy spectrum in soft state can be described with a thermal disk component and a power law with a photon index . Some sources also show the steep power law state with , which differs from the soft state in that the power law component, rather than the disk component, is dominant (for a review see Remillard & McClintock 2006). The first two types of spectra (low/hard state and high/soft state) are naturally explained by the existence of two different stable accretion flows, with a hot, optically thin, geometrically thick radiatively inefficient accretion flow (RIAF, e.g., Narayan & Yi 1994; Blandford & Begelman 1999; Narayan et al. 2000), which can exist only at low luminosities, as well as a cool, optically thick and geometrically thin standard disk (Shakura & Sunyaev1973). However, the physical origin of the very high state is still an open problem, and possible mechanisms include inverse Compton scattering as the operant radiation mechanism (e.g., Zdziarski & Gierliski 2004) or bulk motion Comptonization in a converging sub-Keplerian flow near the BH (e.g., Titarchuk & Shrader 2002). The hard X-ray photon index is found to be related to luminosity (or Eddington ratio) in both XRBs and active galactic nuclei (AGNs). In particular, the photon index is anti-correlated with the Eddington ratio in both low/hard state XRBs (e.g., Kalemci et al. 2005; Yamaoka et al. 2005; Yuan et al. 2007) and low luminosity AGNs (LLAGNs, Gu & Cao 2008) when the Eddington ratio is less than a critical value. However, a positive correlation between the photon index and the Eddington ratio is found in XRBs with higher Eddington ratio (e.g., XTE J1550-564, Kubota & Makishima 2004) and luminous AGNs (e.g., Wang et al. 2004; Shemmer et al. 2006).
The X-ray spectra of ULXs have been extensively studied with and . The spectra of some ULXs can be explained as radiation from a standard disk with an additional high-energy power law spectrum (e.g., Colbert & Mushotzky 1999; Miller et al. 2003; Miller et al. 2004), which is also the standard accretion model for high/soft state XRBs and luminous AGNs. The spectra of some other ULXs can be represented by a single power law, suggesting a similarity to the low/hard state of XRBs and low luminosity AGNs (e.g., Colbert et al. 2004). The long-term variations in the X-ray spectra of some ULXs also show the low/hard to high/soft state transition or high/soft to low/hard state transition, reminiscent of the behavior of classic XRBs (e.g., Kubota et al. 2001; Roberts et al. 2004; Feng & Karret 2006; Soria et al. 2006). Moreover, the recent observation of a break frequency and a quasi-periodic oscillation (QPO) in the power density spectrum of the well-known ULXs (e.g., M82 X-1 and NGC 5408 X-1) also suggests the similarities between ULXs and XRBs (e.g., Dewangan et al. 2006; Strohmayer et al. 2007).
In this work, we revisit the X-ray spectral evolution in some well studied XRBs, which is then applied to constrain the BH masses of several ULXs assuming that their X-ray spectral evolution is similar to that of XRBs and AGNs. In and 3, we introduce the sample and our results, respectively. The discussion and summary are presented in and 5, respectively.
2 Sample
We search the literatures for XRBs observed by the . To explore the X-ray spectral evolution, we focus on the XRBs with well determined hard X-ray spectral slopes during the state transition, in addition to well determined BH masses and distances. The X-ray data of all the selected XRBs were observed during the decay of the outburst, i.e., transition from soft to hard state. Table 1 shows the list of the XRBs we analyze in this paper, which includes seven outbursts of six XRBs.
To utilize the X-ray spectral evolution of XRBs to constrain the black hole masses for ULXs, the multiple X-ray data are also collected from the literature for ULXs. In this paper, we only tentatively include seven luminous sources with the 0.3-10 keV X-ray luminosities near or larger than . All the sources have multiple (at least three epochs) high resolution and/or observations. Most of the X-ray data have been fitted by several models (e.g., simple absorbed power-law model (PL), multicolor disk blackbody model plus power-law model (MCD+PL), etc.), and the photon index and luminosity of best fittings were used in this work (Table 2). In addition, the peak luminosity and spectral slope of M82 X-1 measured with during its flare, is also included, since it is less contaminated by the host galaxy. The sample of ULXs is shown in Table 2.
3 Result
3.1 X-ray spectral evolution in XRBs
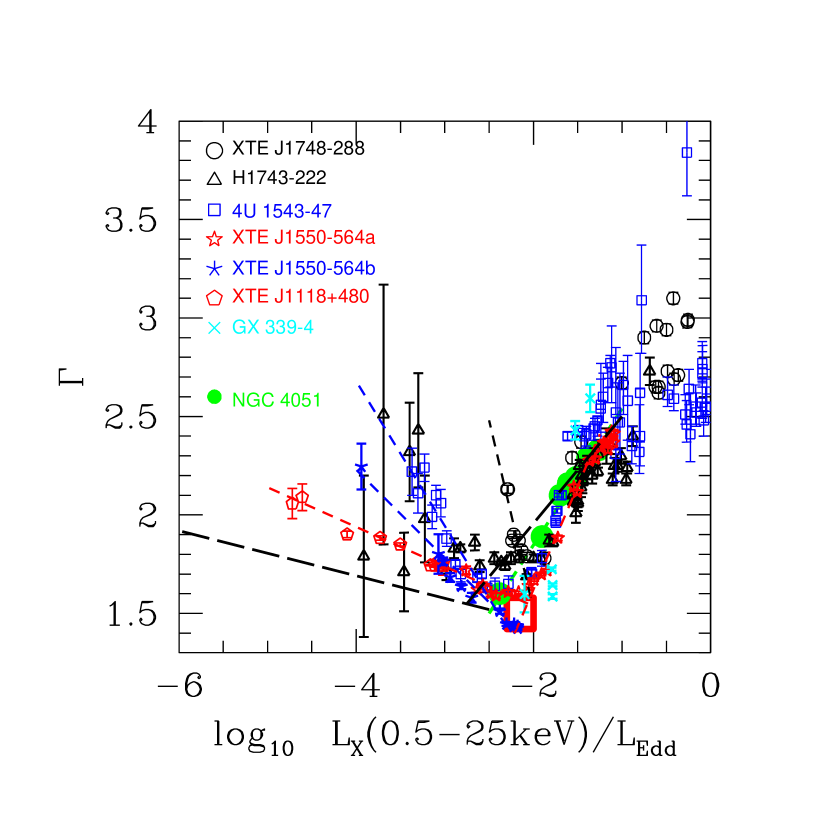
In Fig. 1, we present the relation between the photon index, , and the Eddington ratio, , of the XRB sample, where the photon index is fitted in the 3-25 keV band. We define the Eddington ratio , in which is extrapolated from the unabsorbed 3-25 keV band luminosity, since which was regarded as more represent the bolometric luminosity than the pure hard X-ray luminosity. It can be clearly seen that the hard X-ray photon index is strongly correlated with the Eddington ratio when , even through this relation becomes shallower at higher Eddington ratios for some sources. In the low Eddington ratio (e.g., ) part, the anti-correlation is generally present, which actually has already been found in many occasions (e.g., Yamaoka et al. 2005; Yuan et al. 2007). However, the most remarkable result in our work is that different sources follow the different anti-correlations (Fig. 1). It is also interesting that the photon index is roughly constant in H1743-222 when .
We fit the anti-correlation points between the Eddington ratio and the photon index with linear least-square method for each source. We also fit all datapoints at the positive correlation () region as a whole with the same method, since all sources roughly follow the same correlation (short dashed line in Fig. 1). Since the correlation becomes flatter, and a large scatter is present at higher Eddington ratios (i.e., ), these data points are not included in the fit. The source H1743-222 is not included in the fitting due to the large scatter of photon index in anti-correlation part. Consequently, for each source, the crosspoint between the positive and anti-correlation part can be obtained through the fitted linear relation on both parts. Although the anti-correlation varies from source to source, we find the crosspoints of all XRBs roughly converge to the same point with small scatter (). For comparison with AGNs, we also plot the best fits to the relation between the photon index and the Eddington ratio in LLAGNs (long dashed-line in Fig. 1, Gu & Cao 2008) and luminous AGNs (long dashed-line in Fig. 1, Shemmer et al. 2006), where the LLAGNs include 27 LINERs and 28 local Seyfert galaxies, while the luminous AGNs include 26 radio-quiet QSOs. We also include one radio quiet Seyfert galaxy NGC 4051, which show strong X-ray spectrum and flux variation (green solid circles in Fig. 1). The X-ray spectral photon indices and fluxs (seven epoch observations) are from Lamer et al. (2003), and BH mass is adopted in our work (McHardy et al. 2004). We find that the photon indices are positive correlate to the Eddington ratios for NGC 4051, which is similar to that of QSOs. In doing so, we have extrapolated the X-ray luminosities to 0.5-25 keV band for all AGNs. It is interesting that the anti-correlation in LLAGNs and the positive correlation in luminous AGNs cross at point (), where the Eddington ratio is several times less than that of XRBs. The positive correlation of NGC 4051 and anti-correlation of LLAGN sample cross at point (). Therefore, it seems that the hard X-ray spectral evolution in XRBs and AGNs can be formulized as:
| (1) |
where is the slope and is the Eddington ratio. Keep in mind that the difference of the crosspoint between AGNs and XRBs is mainly caused by the different bolometric correction factors (see discussions in paragraph 4 of Section 4).
3.2 Constraints on the BH masses of luminous ULXs
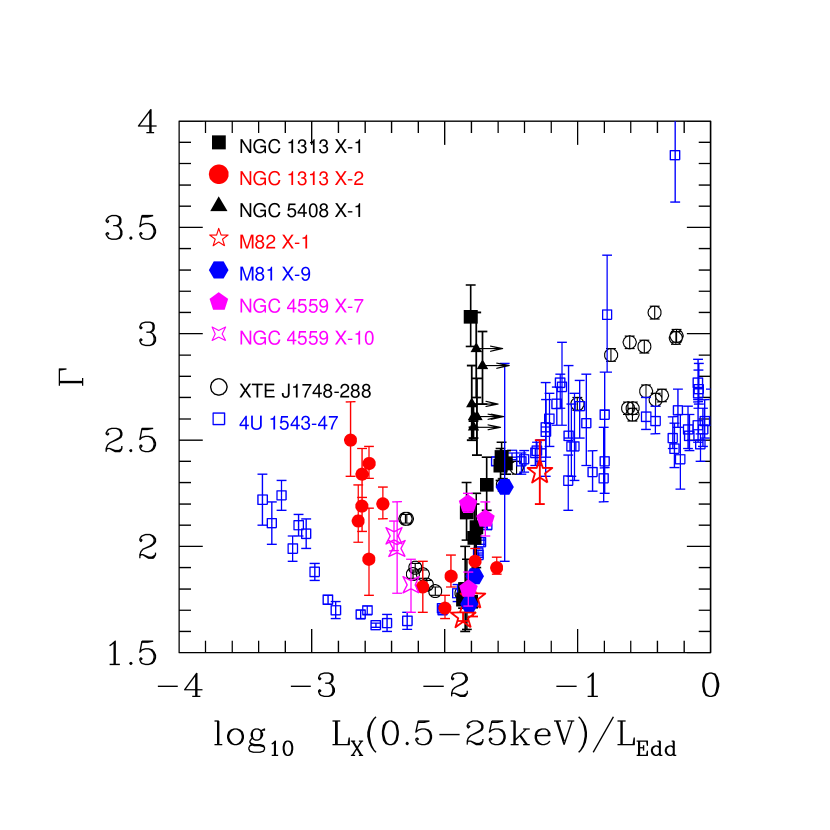
Similar to XRBs, it has been found that many ULXs also show strong X-ray spectral evolution. In particular, it is found that the X-ray photon index of NGC 1313 X-1 is correlated with luminosity, while these two parameters are anti-correlated in NGC 1313 X-2, which are similar to that of both XRBs and AGNs (Feng & Kaaret 2006). This phenomenon has also been found in many other ULXs (e.g., Roberts et al. 2004). The similarity between ULXs, XRBs and AGNs implies that there may be similar physics behind the phenomena, which motivates us to explore the properties of ULXs utilizing the unification of ULXs and XRBs (and/or AGNs). Specifically in this work, the BH masses of ULXs can be constrained if we assume that the BH accretion is scale-free and that their X-ray spectral evolution is similar to that of XRBs and AGNs. Assuming the spectral evolution can be described by Equation 1, we thus calculate the BH masses of ULXs through the least-squares linear fit on the available data for each source. The spectral evolution of ULXs is shown in Fig. 2. We note that all available data of most ULXs belong to either the positive correlation part or the anti-correlation part. This results in a unique estimate of BH mass for each ULX. In the case of NGC 1313 X-2, we only use the anti-correlation data points in calculating the BH mass, since there are only a few data points in the positive correlation part. The spectra of NGC 5408 X-1 are similar to that of XRBs in very high state, we only derive the upper limit of its BH mass since the relation between photon index and Eddington ratio of XRBs becomes shallower at higher Eddington ratios (see Fig. 1). Our results show that all the BHs in these luminous ULXs are IMBHs of around (see Table 2). It should be noted that the dearth observational data for most of the ULXs precludes an estimate of the uncertainty of BH mass.
The shape of the fluctuation power spectral density (PSD, e.g., QPO, and/or break frequency) of ULXs is potentially a very powerful tool to study the central engine of ULXs. In particular, the characteristic frequency of breaks in the PSD slope can be used to infer BH masses based on a direct scaling of properties between XRBs and AGNs (see McHardy et al. 2006). The putative break frequency has been detected in three ULXs (NGC 5408 X-1: Soria et al. 2004; M82 X-1: Dewangan et al. 2006; NGC 4559 X-7: Cropper et al. 2004). We calculate the BH masses of these three ULXs (see Table 2) based on the relation (see McHardy et al. 2006). To utilize this relation, we estimate the bolometric luminosity from 0.1-200 keV band for these three ULXs, which was extrapolated from the unabsorbed 0.3-10 keV luminosity. We find that the BH masses constrained from the X-ray spectral evolution are consistent with those derived from the break frequency within a factor of two except for NGC 5408 X-1, for which only the upper limit is given. However, the BH mass of NGC 5408 X-1 derived from the spectral evolution method in this work is roughly consistent with that derived from the multi-color disk fittings and QPO (Strohmayer et al. 2007)(see also Table 2). This might suggest that it is not appropriate to constrain the BH mass from the break frequency for very high state of sources (e.g., NGC 5408 X-1), which is also the case in AGNs with near or super Eddington accretion (e.g., McHardy et al. 2006).
4 Discussion
In this paper we investigate the relation between the hard X-ray photon index and the Eddington ratio in a small sample of BH XRBs. The Eddington ratio varies by several orders of magnitude from to 1, and the spectra also show strong evolution. We find that different XRBs follow different anti-correlations between and when , while a positive correlation is present when (Fig. 1). The anti-correlation and the positive correlation have been found in both XRBs (e.g., Kalemci et al. 2005; Yamaoka et al. 2005; Yuan et al. 2007) and AGNs (e.g., Wang et al. 2004; Shemmer et al. 2006; Gu & Cao 2008). The qualitative behavior of the anti-correlation is consistent with the predictions of the spectrum produced from the RIAF model (see Fig. 3a of Esin et al. 1997), and the jet contribution in the X-ray waveband may not be important in these XRBs (e.g., Yuan & Cui 2005; Wu et al. 2007). The Comptonization of thermal synchrotron and bremsstrahlung photons from the hot electrons in the RIAF is the dominated cooling mechanism at low Eddington ratios. As the accretion rate increases, the optical depth of the RIAF also increases, increasing the Compton -parameter, thereby leading to a harder X-ray spectrum (detailed calculation will be presented in Yuan, F. et al. 2008, Inpreparation). However, the physical reason for the positive correlation in both XRBs and luminous AGNs (e.g., QSO) when is still unclear. One possibility is that the Comptonization of thermal blackbody photons from the outer thin disk will be the dominant cooling mechanism (e.g., Narayan 2005), since the standard thin disk will transit to optically thin, hot accretion flows (e.g., RIAF or transition layer model in Titarchuk et al. 1998) at certain radii. When the luminosity or accretion rate starts to increase, the transition radius decreases, then the outer thin disk radiation becomes stronger and Compton cooling by disk photons in the inner hot accretion flows becomes more efficient, and the electron temperature goes down, thereby leading to a softer X-ray spectrum (e.g., Zdziarski et al. 2000). This can also naturally explain the possible positive correlation between luminosity, hard X-ray photon index and low frequency QPO, if we assume that the low frequency QPO is related to the transition radius of two accretion flows (e.g., Titarchuk & Fiorito 2004). Another possibility is that the standard disk is not truncated, and extends to the innermost stable circular orbit (ISCO). As the accretion rate increases, the fraction of accreting energy released to the corona decreases (e.g., Merloni & Fabian 2002; Liu et al. 2002; Wang et al. 2004), the corona becomes weak and shrinks, the optical depth of the corona decreases, reducing the y-parameter, and thus leading to a softer X-ray spectrum. It is still unclear what’s physical reason leading to the constant photon index in H1743-222 when (Fig. 1).
It is interesting to note that the traditional hard state can be divided into two parts, i.e., bright hard state and faint hard state, by the crosspoint () of the anti-correlation and the positive correlation. The X-ray spectral evolution of the bright hard state with is the same as that of high/soft state of XRBs and luminous QSOs. It implies that accretion process in this bright hard state may be the standard accretion disk as that of the high/soft state. The observations of both the cool accretion disk component and the relativistic broad Fe K emission line in the bright hard state of GX 339-4 (e.g., Miller et al. 2006) and some bright Seyfert I galaxies ( Nandra et al. 2007; for recent review, Miller 2007) give strong supports to this scenario. In contrast, the RIAF model becomes important in the faint hard state of the XRBs with . If this is the case, the anti-correlation and the positive correlation may suggest they are in RIAF mode and standard accretion disk mode, respectively, and the crosspoint may correspond to the accretion mode transition, which, however, is different from the popular idea that the disk transition occurs at (i.e., high/soft to low/hard state transition).
The physical reason for different anti-correlations between the photon index and the Eddington ratio in different sources is unclear. One possibility is that the differences are caused by the different transitional condition of RIAF and SSD (e.g., electron/ion temperature etc.) since the outer boundary conditions of RIAF play an important role in determining its structure and spectrum (e.g., Yuan et al. 2000). The electron temperature on the outer boundary will be lower if RIAF and SSD transit at higher Eddington ratios since electrons will cool more efficiently at higher Eddington ratios. The electron temperature on the boundary decreases, the electron temperature in the inner region will also decrease, reducing the Compton -parameter, thereby leading to a softer X-ray spectrum. This is consistent with Fig. 1, in which the steeper X-ray spectral evolution corresponds to the higher Eddington ratio of the crosspoint between the anti-correlation and the positive correlation (e.g., XTE J1748-288). Normally, the range of the transition point is small since the electron temperature will decrease abruptly when plasma density increase to a critical value (e.g., GX 339-4 in Miyakawa et al. 2007). Consequently, the transition of RIAF and SSD of different sources can occur at different Eddington ratios, however the difference is rather small, which leads to the same crosspoint with small scatter for our XRBs in Fig. 1.
One should be cautious to compare the crosspoint of the AGNs to that of XRBs (Fig. 1), since the accretion process in some bright Seyferts in the LLAGN sample of Gu & Cao (2008) may be also similar to that of QSOs (see discussions in paragraph 2 of section 4). However, this kind of bright Seyferts only constitute a small fraction of the LLAGN sample, therefore, the crosspoint of AGNs will not change a lot. The second point we should note is that the bolometric correction factor () of XRBs should be several times lower than that of AGNs, which will also lead to the crosspoint of AGNs being lower by several times if we assume that the change of the correlation between and is caused by the ratio of the total bolometric luminosity and the Eddington luminosity. We find that the bolometric correction factor of XRBs is roughly 2-5 times lower than that of AGNs, where the bolometric luminosity of XRBs is estimated from the 0.1-200keV band X-ray luminosity and the bolometric luminosity of AGNs is estimated from multi-wavebands observations (e.g., Elvis et al. 1994; Ho 1999). This is consistent with our results that the Eddtington ratio of the crosspoint of AGNs is several times less than that of XRBs (Fig. 1). The bolometric correction factors only vary several times for different kind sources (e.g., XRBs, ULXs, and AGNs), and will not affect our main conclusions.
It is commonly accepted that ULXs are accreting objects, however, their nature is still unclear, of which the mass of the central BH is one of the most important issues. On the assumption of the same X-ray spectral evolution between ULXs and XRBs (and/or AGNs), which is supported by various observations (e.g., Roberts et al. 2004; Winter et al. 2006; Feng & Kaaret 2006; Soria et al. 2007), we suggest that the BH masses of these luminous ULXs are around , which are the typical value of IMBHs. There are uncertainties in the estimated BH masses of ULXs, which originate from several aspects. Firstly, it is partly from the uncertainties in determining the crosspoint of XRBs, which are caused by the limited data, the uncertainties on distances and BH masses determination and also the possible small intrinsic transition range. Secondly, the limited datapoints of ULXs used in linear least-square fit may cause uncertainties. There are only several observations for most of the ULXs in this sample, except NGC 1313 X-1 and X-2, therefore, more uniform observations using high resolution and high sensitivity X-ray telescopes are desired to further constrain their BH masses. Most importantly, more complete and higher quality X-ray data of XRBs are needed to constrain their X-ray spectral evolution, and to test the reality of a universal crosspoint in XRBs. The validity of our method can be tested by comparing the estimated BH masses with those derived from independent methods. In addition to the consistency with the BH masses derived using relation for XRBs and AGNs (McHardy et al. 2006), we find that the BH masses of M81 X-9 and NGC 1313 X-1 are also consistent within a factor of two with those constrained from the multi-color disk fittings (Miller et al. 2004) (see Table 2). These consistency may support the validity of our method, which further implies that the assumption of similarity between ULXs and XRBs is likely reasonable. It was reported that some ULXs have an energy break in the 5-10keV (Stobbart et al. 2006). If this is the case, the bolometric luminosity would be overestimated when we using the relation to estimate the BH mass , since the bolometric luminosity was derived from the 0.1-200keV luminosity, which is extrapolated from the unabsorbed 0.3-10keV luminosity. However, we find that the BH mass estimated in this way is consistent in factor of two with that estimated using a bolometric luminosity as 0.1-10keV luminosity. On the other hand, more high quality X-ray data and detailed model fitting is needed to further explore the energy break. In some cases, the contrast results can be obtained from the same data, however, with different model. For instance, in NGC 1313 X-1, Feng & Kaaret (2006) find no evidence of an energy break based on the MCD+PL model, while the energy break near 5 keV was found based on the “nonstandard model” (soft power law+hot accretion disk blackbody, Stobbart et al. 2006).
We point out that the inferred BH masses of ULXs in our work are calculated based on the assumption that their X-ray spectral evolution is similar to that of the well known XRBs with luminosity less than or near Eddington luminosity, which is independent of the assumed radiative efficiency of the accretion process or specific accretion models. We do not exclude the possibility that these ULXs are accreting at a super Eddington rate with stellar mass of BHs. However, this needs about several thousand times of Eddington accretion rate to support the luminosities of observed in some ULXs if we assume a 10 BH, since both advection and photon trapping are very important in this case (e.g., Ohsuga et al. 2002), and we never observed XRBs and AGNs with such high accretion rate. Feng & Kaaret (2007) found that the maximum disk color temperature, , is anti-correlated with the disk luminosity, , in NGC 1313 X-2, which is inconsistent the relation expected if the cool thermal component is the emission from the standard accretion disk as observed in XRBs. Instead, its spectral evolution can be roughly fitted by the -free disk model with a stellar mass BH, and the value is around 0.5-0.6, where the -free disk model is similar to the standard disk model but the radial temperature follows the form as and allows to vary with radius (Mineshige et al. 1994). Therefore, they suggest that the BH in NGC 1313 X-2 should be a stellar mass BH with super-Eddington accretion. We note that another possibility for NGC 1313 X-2 is that its BH is IMBH, but accreting through a radiatively inefficient accretion process (e.g., RIAF) since its anti-correlated spectral evolution is similar to the low hard state XRBs. It is also difficult to explain both the positive correlation and the anti-correlation between the photon index and the Eddington ratio for all ULXs by the same -free disk model with a stellar mass BH. What’s more, the detected QPO in some ULXs (e.g., Dewangan et al. 2006, Strohmayer et al. 2007) contradicts the disk dominated -free model, since the QPO is absent or weak in the disk dominated high/soft state of XRBs (see Remillard & McClintock 2006, and references therein). Detailed model fittings of more ULXs, considering the evolution of both luminosities and spectra, will be our future work.
References
- Begelman (2002) Begelman, M. C. 2002, ApJ, 568, L97
- Blandford & Begelman (1999) Blandford, R. D., & Begelman, M. C. 1999, MNRAS, 303, L1
- Colbert & Mushotzky (1999) Colbert, E. J. M., & Mushotzky, R. F. 1999, ApJ, 519, 89
- Colbert et al. (2004) Colbert, E. J. M, et al. 2004, ApJ, 602, 231
- Cropper et al. (2004) Cropper, M., et al. 2004, MNRAS, 349, 39
- Dewangan et al. (2006) Dewangan, G. C., et al. 2006, ApJ, 637, L21
- Elvis et al. (1994) Elvis, M., et al. 1994, ApJS, 95, 1
- Esin et al. (1997) Esin, A. A., McClintock, J. E., & Narayan, R. 1997, ApJ, 489, 865
- Fabbiano & White (2006) Fabbiano, G. & White, N. E. 2006, in Lewin W. H. G., van der Klis., M. eds, Compact stellar X-ray sources. Cambridge Univ. Press, Cambridge
- Feng & Kaaret (2006) Feng, H., & kaaret, P. 2006, ApJ, 650, L75
- Feng & Kaaret (2007) Feng, H., & kaaret, P. 2007, ApJ, 660, L113
- Fiorito & Titarchuk (2004) Fiorito, R. & Titarchuk, L. 2004, ApJ, 614, L113
- Gu & Cao (2008) Gu, M. F. & Cao, X. W. 2008, submitted to ApJ
- Ho (1999) Ho, L. C. 1999, ApJ, 516, 672
- Kaaret et al. (2003) Kaaret, P. et al. 2003, Science, 299, 365
- Kaaret et al. (2006) Kaaret, P. et al. 2006, ApJ, 646, 174
- Kalemci et al. (2006) Kalemci, E., et al. 2006, ApJ, 639, 340
- Kalemci et al. (2005) Kalemci, E., et al. 2005, ApJ, 622, 508
- Kalemci (2002) Kalemci, E., 2002, Ph.D thesis, Univ. California, San Diego
- King et al. (2001) King, A. R., et al. 2001, ApJ, 552, L109
- Kubota et al. (2001) Kubota, A., et al. 2001, ApJ, 547, L119
- Kubota & Makishima (2004) Kubota, A., & Makishima, K. 2004, ApJ, 601, 428
- Lamer et al. (2003) Lamer, G., et al., 2003, MNRAS, 338, 323
- Liu et al. (2002) Liu, B. F., Mineshige, S., & Shibata, K. 2002, ApJ, 572, 173
- Liu & Di Stefano (2008) Liu, J. F., & Di Stefano, R. 2008, ApJ, 674, 73L
- Makishima, et al. (2000) Makishima, K., et al. 2000, ApJ, 535, 632
- McHardy et al. (2004) McHardy, I. M, et al. 2004, MNRAS, 348, 783
- McHardy et al. (2006) McHardy, I. M., et al. 2006, Nature, 444,730
- Merloni & Fabian (2002) Merloni, A., & Fabian, A. C. 2002, MNRAS, 332, 165
- Miller et al. (2003) Miller, J. M., et al. 2003, ApJ, 585, L37
- Miller et al. (2004) Miller, J. M., Fabian, A. C., & Miller, M. C. 2004, ApJ, 607, 931
- Miller & Colbert (2004) Miller, M. C. & Colbert, E. J. M. 2004, Int. J. Mod. Phys. D, 13, 1
- Miller et al. (2006) Miller, J. M., et al. 2006, ApJ, 653, 525
- Miller (2007) Miller, J. M. 2007, ARA&A, 45, 441
- Mineshige et al. (1994) Mineshige, S., et al. 1994, ApJ, 426, 308
- Mirabel & Rodriguez (1999) Mirabel, I. F., & Rodriguez, L. F. 1999, AR&AA, 37, 409
- Miyakawa et al. (2007) Miyakawa, T. G. et al. 2007, Accepted for publication in the proceedings of VI Microquasar Workshop, editors: T. Belloni et al. (2006), astro-ph/0702087
- Nandra et al. (2007) Nandra, K., et al. 2007, MNRAS, 382, 194
- Narayan & Yi (1994) Narayan, R., & Yi, I. 1994, ApJ, 428, L13
- Narayan, Igumenshchev & Abramowicz (2000) Narayan, R., Igumenshchev, I. V., & Abramowicz, M. A. 2000, ApJ, 539, 798
- Narayan (2005) Narayan, R. 2005, Ap&SS, 300, 177
- Ohsuga et al. (2002) Ohsuga, K., et al. 2002, ApJ, 574, 315
- Pakull & Mirioni (2003) Pakull, M. W., & Mirioni, L. 2003, Rev. Mex. AA Ser. Conf., 15, 197
- Park et al. (2004) Park, S. Q., et al. 2004, ApJ, 610, 378
- Remillard & McClintock (2006) Remillard, R. A. & McClintock, J. E. 2006, ARA&A, 44, 49
- Revnivtsev et al. (2000) Revnivtsev, M. G., Trydolyubov S. P., & Botozdin, K. N. 2000, MNRAS, 312, 151
- Roberts et al. (2004) Roberts, T. P., et al. 2004, MNRAS, 349, 1193
- Shakura & Sunyaev (1973) Shakura, N. I., & Sunyaev, R. A. 1973, A&A, 24, 337
- Shemmer et al. (2006) Shemmer, O., et al. 2006, ApJ, 646, 29
- Soria et al. (2007) Soria, R., et al. 2007, MNRAS, 379, 1313
- Soria et al. (2006) Soria, R., et al. 2006, MNRAS, 370, 1666
- Soria et al. (2004) Soria, R., et al. 2004, A&A, 423, 955
- Stobbart et al. (2006) Stobbart, A.-M., Roberts, T. P., & Warwick, R. S. 2006, MNRAS, 370, 25
- Strohmayer et al. (2007) Strohmayer, T., et al. 2007, ApJ, 660, 580
- Titarchuk et al. (1998) Titarchuk, L., Lapidus, I., & Muslimov, A. 1998, ApJ, 499, 315
- Titarchuk & Shrader (2002) Titarchuk, L., & Shrader, C. 2002 ApJ, 567, 1057
- Titarchuk & Fiorito (2004) Titarchuk, L., & Fiorito, R. 2004, ApJ, 612, 988
- Tsunoda et al. (2006) Tsunoda, N., et al. 2006, PASJ, 58, 1081
- Vierdayanti, K., et al. (2006) Vierdayanti, K., et al. 2006, PASJ, 58, 915
- Wang et al. (2004) Wang, J. M., Watarai, K. Y., & Mineshige, S. 2004, ApJ, 607, L107
- Watarai, et al. (2001) Watarai, K., Mizuno, T., & Mineshige, S. 2001, ApJ, 549, L77
- Winter et al. (2006) Winter, L. M., et al. 2006, ApJ, 649, 730
- Wu et al. (2007) Wu, Q. W., Yuan, F., & Cao, X. W. 2007, ApJ, 669, 96
- Yamaoka et al. (2005) Yamaoka, K., et al. 2005, ChJAA, 5, 2005
- Yuan et al. (2000) Yuan, F., et al. 2000, ApJ, 537, 236
- Yuan & Cui (2005) Yuan, F., & Cui, W., et al. 2005, ApJ, 629, 408
- Yuan et al. (2007) Yuan, F., et al. 2007, ApJ, 658, 282
- Zdziarski & Gierliski (2004) Zdziarski, A. A. & Gierliski, M. 2004, Progress of Theoretical Physics Supplement, 155, 99
- Zdziarski et al. (2000) Zdziarski, A. A., et al. 2000, ApJ, 542, 703
- (70)
| Source | Distance (kpc) | BH mass () | Obs. Number | Outburst year | Refs.a |
|---|---|---|---|---|---|
| 4U 1543-47 | 7.5 | 9.4 | 74 | 2002 | P04 & K05 |
| XTE J1550-564a | 5.0 | 10.0 | 25 | 2000 | K02 |
| XTE J1550-564b | 5.0 | 10.0 | 12 | 2001 | K02 |
| XTE J1118+480 | 1.8 | 6.1 | 12 | 2000 | K02 |
| XTE J1748-288 | 8.0 | 10.0 | 23 | 1998 | R00 |
| GX 339-4 | 8.0 | 5.8 | 6 | 1998 | K02 |
| H1743-222 | 11.0 | 10.0 | 48 | 2003 | K06 |
References. — P04: Park et al. 2004; K05: Kalemci et al. 2005; K02: Kalemci 2002; R00: Revnivtsev et al. 2000; K06: Kalemci et al. 2006
| Name | Modela | b | Telescope | Distancec | Referenced | BH mass 1e | BH mass 2f | |
|---|---|---|---|---|---|---|---|---|
| M81 X-9 | MCD+PL | 40.22 | 3.4 | M04 | g | |||
| … | MCD+PL | 40.26 | … | M04 | … | … | ||
| … | MCD+PL | 40.77 | … | T06 | … | … | ||
| NGC 1313 X-1 | MCD+PL | 40.11 | 4.13 | F06 | g | |||
| … | PL | 40.19 | … | F06 | … | … | ||
| … | PL | 40.27 | … | F06 | … | … | ||
| … | PL | 40.22 | … | F06 | … | … | ||
| … | PL | 40.13 | … | F06 | … | … | ||
| … | MCD+PL | 40.20 | … | F06 | … | … | ||
| … | PL | 40.19 | … | F06 | … | … | ||
| … | MCD+PL | 40.12 | … | F06 | … | … | ||
| … | PL | 40.43 | … | F06 | … | … | ||
| … | MCD+PL | 40.11 | … | F06 | … | … | ||
| … | MCD+PL | 40.13 | … | F06 | … | … | ||
| … | MCD+PL | 40.17 | … | F06 | … | … | ||
| NGC 1313 X-2 | MCD+PL | 39.54 | 4.13 | F06 | … | |||
| … | PL | 40.03 | … | F06 | … | … | ||
| … | MCD+PL | 40.24 | … | F06 | … | … | ||
| … | PL | 40.19 | … | F06 | … | … | ||
| … | PL | 39.73 | … | F06 | … | … | ||
| … | PL | 39.62 | … | F06 | … | … | ||
| … | PL | 39.57 | … | F06 | … | … | ||
| … | PL | 39.49 | … | F06 | … | … | ||
| … | MCD+PL | 40.42 | … | F06 | … | … | ||
| … | MCD+PL | 39.62 | … | F06 | … | … | ||
| … | MCD+PL | 39.57 | … | F06 | … | … | ||
| … | MCD+PL | 40.58 | … | F06 | … | … | ||
| M82 X-1 | PL | 40.50 | 3.63 | K06 | g | |||
| … | PL | 40.64 | … | D04 | … | … | ||
| … | PL | 40.74 | … | K06 | … | … | ||
| NGC 5408 X-1 | MCD+PL | 39.84 | 4.8 | S04 | h | |||
| … | MCD+PL | 39.82 | … | S04 | … | i | ||
| … | MCD+PL | 39.85 | … | S04 | … | j | ||
| … | MCD+PL | 39.86 | … | S04 | … | … | ||
| … | MCD+PL | 39.90 | … | S04 | … | … | ||
| NGC 4559 X-7 | MCD+PL | 40.38 | 9.69 | C04 | h | |||
| … | MCD+PL | 40.51 | … | C04 | … | … | ||
| … | MCD+PL | 40.33 | … | C04 | … | … | ||
| NGC 4559 X-10 | MCD+PL | 40.16 | 9.69 | C04 | … | |||
| … | MCD+PL | 40.26 | … | C04 | … | … | ||
| … | MCD+PL | 40.14 | … | C04 | … | … |
References. — M04: Miller et al. 2004; T06: Tsunoda et al. 2006; F06: Feng & Kaaret 2006; K06: Kaaret et al. 2006; D04: Dewangan et al. 2006; S04: Soria et al. 2004; C04: Cropper et al. 2004