Deep infrared observations of the puzzling central X-ray source in RCW10322affiliation: Based on observations collected at the European Southern Observatory, Paranal, Chile under programme ID 67.D-0198(A), 077.D-0764(A) 33affiliation: Based on observations with the NASA/ESA Hubble Space Telescope, obtained at the Space Telescope Science Institute, which is operated by AURA, Inc. under contract No. NAS 5-26555.
Abstract
1E 161348-5055 (1E 1613) is a point-like, soft X-ray source originally identified as a radio-quiet, isolated neutron star, shining at the center of the 2000 yr old supernova remnant RCW103. 1E 1613 features a puzzling 6.67 hour periodicity as well as a dramatic variability over a time scale of few years. Such a temporal behavior, coupled to the young age and to the lack of an obvious optical counterpart, makes 1E 1613 a unique source among all compact objects associated to SNRs. It could either be the first low-mass X-ray binary system discovered inside a SNR, or a peculiar isolated magnetar with an extremely slow spin period. Analysis of archival IR observations, performed in 2001 with the VLT/ISAAC instrument, and in 2002 with the NICMOS camera onboard HST unveils a very crowded field. A few sources are positionally consistent with the refined X-ray error region that we derived from the analysis of 13 Chandra observations. To shed light on the nature of 1E 1613, we have performed deep IR observations of the field with the NACO instrument at the ESO/VLT, searching for variability. None of the candidates, however, shows a clear modulation at 6.67 hours, nor has a significant long term variability. Moreover, none of the candidates stands out for peculiar colors with respect to the bulk of the sources detected in the field. We find no compelling reasons to associate any of the candidates to 1E 1613. On one side, within the frame of the binary system model for the X-ray source, it is very unlikely that one of the candidates be a low-mass companion star to 1E 1613. On the other side, if the X-ray source is an isolated magnetar surrounded by a fallback disc, we cannot exclude that the IR counterpart be hidden among the candidates. If none of the potential counterparts is linked to the X-ray source, 1E 1613 would remain undetected in the IR down to Ks22.1. Such an upper limit is consistent only with an extremely low-mass star (an M6-M8 dwarf) at the position of 1E 1613, and makes rather problematic the interpretation of 1E 1613 as an accreting binary system.
1 Introduction
The X-ray point source 1E 1613485055 (1E 1613 hereinafter) was discovered with the Einstein observatory close to the geometrical center of the very young ( years) shell-type supernova remnant (SNR) RCW103 (Tuohy & Garmire, 1980). The association of the point source with the SNR is very robust on the basis of the good positional coincidence, with 1E 1613 lying within of the SNR center. Furthermore, HI observations of this region (Reynoso et al., 2004) pointed to a spatial correlation of the two objects in view of their similar distance ( kpc). Historically, 1E 1613 was the first radio-quiet, isolated neutron star candidate, with thermal X-ray spectrum, no counterparts at other wavelengths, no pulsations, no non-thermal extended emission. Since then, a handful of similar enigmatic sources, all characterized by a thermal X-ray spectrum, lack of standard pulsar activity, high X-ray to optical flux ratio (FX/F), and general lack of pulsations, have been discovered inside young SNRs. Such sources, possibly the youngest members of the family of radio-quiet, isolated neutron stars (including also the Anomalous X-ray Pulsars and Soft Gamma Repeaters), were dubbed, as a class, “Central Compact Objects” (CCOs, Pavlov et al., 2002) – see De Luca (2007) for a recent review.
What makes 1E 1613 unique among CCOs is its very peculiar and puzzling temporal behaviour. A factor 10 variability on the time scale of few years was already evident within the historical Einstein/ROSAT/ASCA dataset (Gotthelf et al., 1999). This was confirmed by Chandra/ACIS observations which showed that the source brightened by a factor 60 between September 1999 (when the source’s flux was erg cm-2 s-1 in the 0.5-8 keV energy range) and February 2000 (with a record flux of erg cm-2 s-1), decreasing to erg cm-2 s-1 (Sanwal et al., 2002) afterwards. The analysis of Chandra monitoring observations showed that the source flux has been continuously fading since then (De Luca et al., 2006). The 1999 16 ks Chandra observation, performed when the source was in a “low state”, hinted a possible 6.4 hours ( 23 ksec) periodicity (Garmire et al., 2000). However, subsequent Chandra and XMM-Newton observations found the source in “active state” with a remarkably complex light curve including dips, with an overall modulation (Sanwal et al., 2002; Becker & Aschenbach, 2002), and could not ultimately confirm its periodicity. The breakthrough came with a long, 90 ks XMM-Newton observation (De Luca et al., 2006), performed when the source was in a “low state” ( erg cm-2 s-1), which clearly showed a 6.67 hour periodicity with a strong (), almost sinusoidal modulation.
On the optical side, VLT observations of the crowded field of 1E 1613 performed with FORS1 and ISAAC identified a possible counterpart in a very red object (I, J, H and Ks) located within the Chandra error circle (Sanwal et al., 2002). The existence of this object was also confirmed by HST/NICMOS follow-up observations (Mignani et al., 2004). A search for a counterpart in the far IR with the Spitzer telescope was also performed, with negative results (Wang et al., 2007).
As discussed by De Luca et al. (2006), the peculiar combination of long-term variability, 6.67 hours periodicity, young age and underluminous optical/IR counterpart settle the case for a unique phenomenology. 1E 1613 could be a very young binary system, composed of a recently born compact object and of a low-mass star in an eccentric orbit, powered by an unusual “double” (wind+disc) accretion mechanism. Very recently, a different binary scenario for 1E 1613 has been proposed by Pizzolato et al. (2008). Alternatively, 1E 1613 could be a peculiar isolated object, e.g. a magnetar, dramatically slowed-down, possibly by interaction with a debris disc (De Luca et al., 2006; see also Li, 2007, for an update of the isolated magnetar model for 1E 1613). Both the binary system and the isolated object scenario are highly unusual and require non-standard assumptions about the formation and evolution of compact objects in supernova explosions.
In order to shed light on the nature of the puzzling source 1E 1613 , we have performed new, deep IR observations of the field with the VLT, with the main aim of identifying the source counterpart by means of a sensitive search for modulation at the expected 6.67 hour periodicity. We have also re-analysed the archived VLT and HST observations (Sanwal et al., 2002; Mignani et al., 2004) in order to search for long-term variability of a possible counterpart. We presented a first account of our VLT results in Mignani et al. (2007a).
Since a precise position is of paramount importance for our counterpart search, we have first reassessed 1E 1613 X-ray position using a set of Chandra archival data together with a very recent deep Chandra observation performed by our group (§2). Using our new position, we have analysed our new IR VLT data, as well as the archival ones (§3 and 4). Results are discussed in §5.
2 The X-ray position of 1E 1613
In order to maximize the identification chances, an improved X-ray position of the source is required. Although 1E 1613 has been extensively observed with Chandra almost all data collected before 2002 are of little use to derive the source position owing to the presence of offsets in the astrometry, as computed by the Aspect tool 111http://cxc.harvard.edu/cal/ASPECT/fix_offset/fix_offset.cgi, and/or to source pile-up. Indeed, we found discrepancies among the reconstructed target coordinates, much larger than the expected astrometric accuracy. Thus, we decided to rely only on Chandra data collected after 2002, for which no astrometric offsets are reported. Such data include 12 short (4-5 ks) observations with ACIS/S (Sanwal et al., 2002; De Luca et al., 2006) as well as a very recent, deep (80 ks) observation performed with HRC/S by our group. The short observations were performed with different roll angles, with the source at a large ( arcmin) offaxis angle in order to reduce pile-up effects. Data were retrieved from the Chandra X-ray Centre (CXC) Science Archive. Calibrated (“level 2”) data were produced using the Chandra Interactive Analysis of Observations software (CIAO v.3.3). The target position was computed for each ACIS/S dataset by performing a source detection in the 0.5–10 keV range using the wavdetect task. After averaging the target coordinates computed from each dataset, we obtained =16h 17m 36.228s, = -51∘ 02’ 24 with a r.m.s. of 05 and 025 in right ascension and declination, respectively. The Chandra/ACIS astrometric accuracy for sources at offaxis angles larger than 3 arcmin is degraded with respect to the on-axis case because of PSF blurring, but no systematic studies of such an effect are available. Thus, we assume the observed r.m.s. on the source coordinates as the 1 uncertainty on the X-ray position. The target position in the deep HRC observation was computed in the same way, yielding =16h 17m 36.232s, = -51∘ 02’ 24 with a nominal radial uncertainty of , according to the CXC calibration team222http://cxc.harvard.edu/cal/ASPECT/celmon/. The HRC coordinates are perfectly consistent with those computed using the 12 short ACIS/S observations. Combining the two measurements, we computed the best estimate of the source coordinates, i.e. =16h 17m 36.23s, = -51∘ 02’ 24 with a uncertainty of and in right ascension and declination, respectively.
3 IR Observations and data reduction
3.1 The 2006 VLT/NACO observations
Our new set of IR observations was performed in visitor mode on May 23rd and 24th 2006 with NAos COnica (NACO), an adaptive optics (AO) imager and spectrometer mounted at the fourth Unit Telescope (UT4) of the ESO Very Large Telescope (VLT) at the Paranal Observatory, Chile. In order to provide the best combination of angular resolution and sensitivity, NACO was operated with the S27 camera giving a field of view of and a pixel scale of 0027. The only suitable reference star for the adaptive optics correction was the GSC-2 star S230213317483 (), located 211 away from our target. For this reason, the resulting image quality was not optimal and appeared to be very sensitive to the atmospheric conditions. The Visual () dichroic element and wavefront sensor () were used. Observations were performed in the ( ; ) filter.
In order to monitor continuously the potential counterpart candidates within the Chandra error circle covering at least two 6.67 hour cycles, we obtained a total of 21 consecutive observations in the two nights (see Table 1). Each observation lasted about 2300 s and was split in sequences of short randomly dithered exposures with Detector Integration Times (DIT) of 60 s. The airmass was mostly below 1.3, while the seeing was rarely below , affecting the performance of the AO. Sky conditions were photometric in both nights. Night (twilight flat fields) and day time calibration frames (darks, lamp flat fields) were taken daily as part of the NACO calibration plan. Standard stars from the Persson et al. (1998) fields were observed in both nights for photometric calibration. The data have been processed using the ESO NACO pipeline333www.eso.org/observing/dfo/quality/NACO/pipeline and the science images coadded.
3.2 VLT/ISAAC archival data
IR observations of 1E 1613 were performed in service mode between April and July 2001 using the NIR spectro-imager ISAAC mounted at the First Unit Telescope (UT1) of VLT. The Short Wavelenght (SW) camera was used, equipped with a Rockwell Hawaii 10241024 pixel Hg:Cd:Te array, which has a projected pixel size of 0148 and a field of view of 152152′′. Observations were performed through the (; ), (; ) and (; ) band filters. A total of 13 observations were performed in the -band with the aim of pinpointing the CCO counterpart through the detection of a flux modulation, as suggested by the possible periodicity of the X-ray source hinted by the early Chandra observations available at that epoch (Garmire et al., 2000). Additional pointings in the and -bands were performed to study the colors of the candidate counterpart (see Table 2).
To allow for subtraction of the variable IR sky background each observation was split in sequences of shorther dithered exposures (DIT=20 s in the -band and 40 s in the others). The total integration times per observation were 2000 s ( and bands) and 1000 s (-band). All observations, with the exception of the July 23rd one, were taken under photometric conditions, with a seeing often better than 10 and airmass below 1.2. Twilight flat fields, dark frames, as well as images of standard stars from the Persson et al. (1998) fields, were taken daily as part of the ISAAC calibration plan. The data were reduced and calibrated using the ESO ISAAC pipeline444http://www.eso.org/observing/dfo/quality/ISAAC/pipeline. For each exposure sequence, single frames were registered and coadded to produce a background subtracted and cosmic-rays free image.
3.3 HST/NICMOS archival data
IR observations of the field of 1E 1613 were performed on August 15th and October 8th 2002 with the HST Observations were performed with NICMOS using the NIC2 camera ( field of view, 0075 pixel size) with the (, ), (, ) and (, ) filters. To cope with visit scheduling constraints the target had to be observed for 10 spacecraft orbits distributed over two different visits. In each visit, a sequence of six exposures (2590 s each) was performed in the filter to search for variability of the originally proposed candidate counterpart (Sanwal et al., 2002), and two exposures in the (935 s) and (1007 s) filters to derive color information (see Table 3).
To decrease the instrumental overheads, observations were taken in MULTIACCUM mode, split in sequences of 9 and 18 sub-exposures in the filter and in the others, respectively. The data were downloaded from the European HST science archive555http://www.stecf.org/archive/ after on-the-fly recalibration with the best reference files available, frame coaddition and cosmic ray filtering.
3.4 VLT and HST astrometry
In order to precisely register the Chandra position on our IR images we have refined the default image astrometry. We have computed the astrometric solution on the ISAAC images by fitting the positions and coordinates of 60 reference stars selected from the 2MASS catalogue. The reference stars positions have been computed by a two-dimensional gaussian fitting procedure with accuracies of few hundredths of pixels. The astrometric fit was performed using the STARLINK package ASTROM with a six order polynomial to account for the detector distorsions and yielded a rms of in both right ascension and declination. Since very few 2MASS stars fall in both the narrow NICMOS () and NACO () fields of view they do not provide an adequate primary reference grid. For this reason, in both cases we have computed the astrometric solution by using a secondary reference grid made up of 26 secondary stars identified in common with the ISAAC -band image. The astrometric solutions computed for the NICMOS and NACO images thus yielded a rms of and per coordinate, respectively. By adding in quadrature the rms of the astrometric solution of the ISAAC image ( per coordinate), we thus end up with an overall uncertainty of 01 per coordinate on both the NICMOS and NACO images astrometry. In all cases, we have accounted for the intrinsic 02 absolute astrometric accuracy of 2MASS666http://spider.ipac.caltech.edu/staff/hlm/2mass/overv/overv.html.
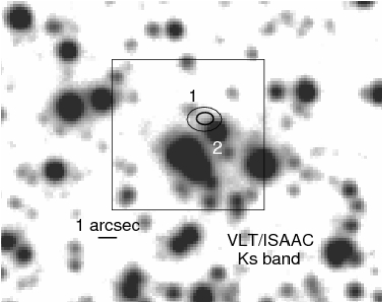
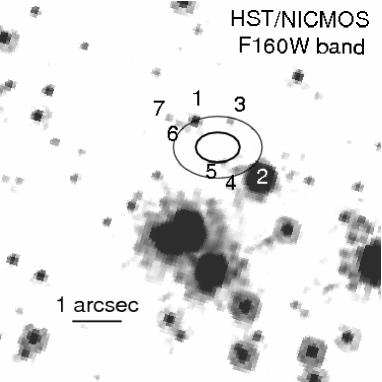
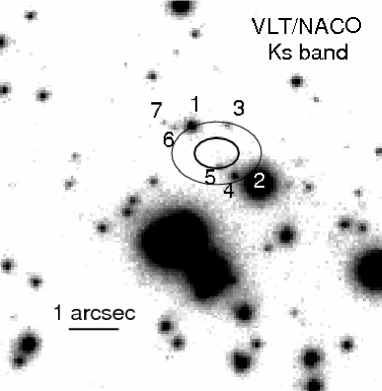
Fig. 1 shows the deepest VLT and HST images of the field of 1E 1613 with the computed Chandra position overlayed (see also the caption to Fig. 1). Seven objects (labelled in the figure) are detected in the vicinity of the X-ray position; three of them are consistent with the 99% c.l. error region. In all cases, the objects’ profiles are point-like and consistent with the instruments PSFs. We note that the originally proposed counterpart object #1 (Sanwal et al., 2002) now is only marginally consistent (at c.l.) with the position of 1E 1613. Due to the field crowding, only the two brightest objects (#1 and 2) are detected in the lower resolution VLT/ISAAC image (Fig. 1, left), while the faintest ones (#3-7) are detected in the higher resolution HST/NICMOS and VLT/NACO images. Objects #1 and 2 are detected also in the VLT/ISAAC and -band images. All objects are detected in the HST/NICMOS and -bands, while only objects #1 and 2 are also detected in the band, although the former is only marginally detected. This is likely due to the short exposure time (see Table 3) and to the fact that the -band is slightly bluer than the ISAAC -band. The fact that objects #3-7 are all detected in the and bands but not in the one suggests that they are very red and heavily absorbed. To be conservative, we will consider all of the seven sources in our investigation.
4 Data analysis
Due to the field crowding and to the faintess of most candidates, for all observations magnitudes were computed through PSF photometry which, in this case, yields more accurate results than standard aperture photometry. We note that for the NACO observations the accuracy of the PSF photometry is affected by the quality of the AO correction, which was not optimal due to the relatively large offset of the guide star and to the varying atmospheric conditions (§3.1). Since the NACO PSF is largely oversampled, to increase the signal–to–noise ratio NACO images have been resampled with a pixels window using the swarp program (Bertin E., Terapix Project). For the PSF photometry we used the Stetson (1992, 1994) suite of programs Daophot, following the procedures described in Zaggia et al. (1997). To improve and maximize the object detection we used as a reference the co-added and deeper VLT/ISAAC , HST/NICMOS , and VLT/NACO -band images (see Fig. 1) for each telescope/instrument dataset to create a master list of objects which we registered on the single images and used as a mask for object detection. For each single image, the model PSF was then computed by fitting the profile of a number of bright, but non-saturated, reference objects. Such model PSF was used to measure object fluxes at the reference positions. Photometry calibration was applied using the zeropoints provided by the VLT and HST data reduction pipelines. Since the ISAAC and NACO zeropoints are by default computed through aperture photometry, the aperture correction was applied to the Daophot magnitudes. For the VLT observation, airmass correction was applied using the atmospheric extinction coefficients measured for the Paranal Observatory (Patat, 2004).
4.1 Short term variability
To search for short-term variability from the candidate counterparts we started from the VLT/NACO dataset which is the only one to provide both a complete coverage and an accurate phase sampling of the 6.67 hours period of the X-ray source over at least two cycles (see Table 1). Using as a mask the master list created from the co-added -band image we have run Daophot to compute the PSF photometry on the single images. The derived single object catalogues were then matched and compared using the Daophot routine Allframe. To avoid systematic offsets induced by night-to-night zeropoint fluctuations the photometry of the second night was renormalized to the first one.
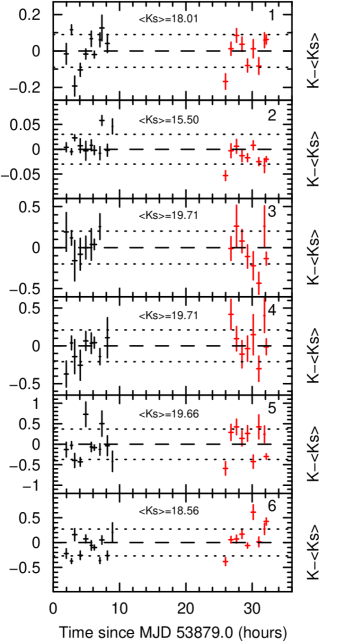
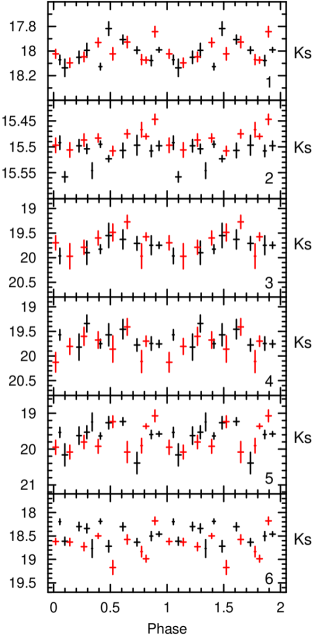
Magnitude differences with respect to the average value are plotted in Fig. 2 (left panel) for all candidate counterparts for the two consecutive nights (May 23rd and 24th). Object #7 is not included since it is not detected in the single images but only in the co-added one (see Fig. 1). Next, for each measurement, we computed the corresponding phase with respect to the 6.67 hours X-ray period, assuming phase 0 to be at MJD 53879.0 and we folded the second night on the first one. The folded light curves are plotted in Fig. 2 (right panel).
A large scatter of the flux measurements is apparent in both panels of Fig. 2, where error bars account for statistical errors only. Such a variability is generally erratic and not correlated with phase (Fig. 2). Indeed, visual inspection of the light curves of object #1 and #3 would suggest a nearly sinusoidal variation, which, however, does not pass statistical tests. Considering source #1, a simple constant fails to reproduce the folded light curve (, 18 d.o.f.). Adding a function does not yield a better description (, 16 d.o.f.; such improvement has a 20% chance occurrence probability); adding a second harmonic does not improve the situation (, 14 d.o.f.). Focusing on source #3, a constant fit yields (15 d.o.f.), while adding a function yields (13 d.o.f.). Such an improvement has a chance occurrence probability of 3%, which is definitely too high to claim for evidence of modulation.
Thus, none of the candidate counterparts show evidence for periodic modulation.
In order to estimate upper limits on short-term variability, a careful discussion of errors is required. Indeed, the apparent flux variations exceed the expected poisson fluctuations among different measurements. A steady flux model is formally not consistent with most of the observed light curves (as seen above, e.g., for object 1 it yields , 18 d.o.f.).
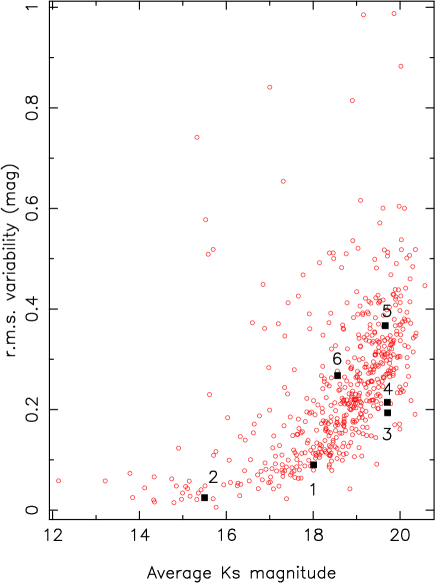
Such a large scatter suggests that our relative photometry measurements are contaminated by random errors induced e.g., by fluctuations in the atmospheric conditions, sky background and seeing. Other sources of errors are the variations in the AO correction to the image PSF, which depend both on the objects positions in the instrument field of view and on the correct guiding of the reference star. Furthermore, errors are also induced by the PSF fitting and background subtraction procedures. Other errors induced by the data reduction process and/or by glitches in the detector performance should also to be taken into account. It is also interesting to note that the brightest source candidate (object #2, =15.5) shows a much smaller r.m.s. with respect to the other, much fainter ones (), implying that such errors are larger for sources with a lower signal to noise ratio. Since it would be extremely difficult to formally quantify all the above effects on the photometry of each single object, we decided to use an empirical approach. The results are shown in Fig. 3 where, for all objects detected in the field, we have plotted the flux variation r.m.s. as a function of the average object’s flux. As already hinted in Fig. 2, flux measurements for fainter sources are more scattered. In particular, the flux variation r.m.s of our candidate counterparts are fully consistent with those of field objects of comparable brightness. Thus, we conclude that none of the candidate counterparts shows evidence for a significant short-term variability, nor of a significant 6.67 hour modulation. Indeed, the measured flux variation r.m.s. can be interpreted as a upper limit to any possible variability. Such upper limits, together with the time-averaged magnitudes, are summarized in Table 4.
For completeness, we have analyzed the other available datasets which span different epochs and sample different source states. We have repeated our analysis using the VLT/ISAAC -band dataset (see Table 2) which, unfortunately, provides repeated flux measurements only for the two brightest candidates (objects #1 and 2) with non-continuous coverage and non-unifourm sampling of the 6.67 hours X-ray period. We found that the apparent flux variations are compatible with the measured r.m.s., suggesting that, also in this case, random errors induced by fluctuations in the atmospheric conditions, sky background and seeing, dominate. As before, we assumed the measured flux variation r.m.s. as the variability upper limit (see Table 4).
Finally, we have repeated our analysis using the HST/NICMOS dataset which provides repeated, atmosphere-free flux measurements although with non-continuous coverage and non-uniform sampling of the 6.67 hours X-ray period (see Table 3). Since the HST observations have been split in two different orbits separated by about 60 days, we first searched for variability in each visit. Once more, we could not find statistically significant evidence for variability. In particular, we found none for object #7, i.e. the faintest of the candidates and the only one for which the repeated VLT/NACO observations did not yield time variability information. While the uncertainty on the source period prevents folding of the light curves derived from different visits, by comparing the photometry of the two visits we found that the fluxes measured from the second one are systematically fainter by magnitudes. Such an effect is most probably due to the use of calibration frames non contemporaneous to the observations (unfortunately, a single set of dark and flatfield frames is available for the two visits) and, possibly, to a non-optimal correction for the “pedestal” (see NICMOS Instrument Handbook). The derived variability upper limits (see Table 4) are thus less constraining than those derived from the single visits, although, as expected, somewhat tighter than those derived from the analysis of the VLT/NACO and ISAAC datasets.
4.2 Long term variability
We have used the whole dataset to search for indications of long term, IR variability on time scale of years, possibly associated to the evolution of the X-ray source. As a reference, we have used the flux measurements in the closest passbands, i.e. those obtained from the VLT/ISAAC -band, HST/NICMOS and VLT/NACO -band observations. Since we did not find any evidence for variability within the dataset of each instrument, we have generated, for each dataset, time-averaged images. Unfortunately, a direct comparison is made difficult by the use of different instruments and filters. Passband transformations between the HST filters and the Johnson’s ones can be computed using the synphot777http://stsdas.stsci.edu/cgi-bin/gethelp.cgi?synphot.sys package of the Space Telescope Science Data Analysis Software (STSDAS). However, the results are affected by the uncertainty on the objects spectral type which is a free parameter of the transformation equation. Since our spectral classification of the candidate counterparts relies mostly on one colour, with only objects #1 and 2 also detected in the VLT/ISAAC -band and in the HST/NICMOS , we estimate that a straight passband tranformation will introduce an unknown uncertainty in our flux estimates.
To solve the problem, as well as to account for other sources of systematics, we cross-matched the object catalogues obtained from the HST/NICMOS -band and the VLT/ISAAC -band observations (202 objects in common) and we computed the correlation between the magnitudes measured in the two filters. The r.m.s of the fit is 0.05 magnitudes (using 105 sources with after 2 clipping), i.e. of the same order of our statystical photometric errors. We repeated the same procedure to compute the transformation between the VLT/NACO and ISAAC -bands and again we obtained an r.m.s. of 0.05 magnitudes (using 47 sources with , after clipping). For all our candidates we then applied such empyrical passband transformations in order to have all flux measurements consistently referred to the -band.
We also checked the correlation for the bulk of fainter sources, resolved only in the sharp HST/NICMOS and VLT/NACO images. The scatter is found to be somewhat higher at faint fluxes. The observed r.m.s. increases from 0.08 mag (for 19 sources in the 13-15.5 range) to mag (for 243 sources in the 18-20.5 mag range). The larger r.m.s. for fainter objects points to effects related e.g. to passband transformation, airmass corrections, as well as to the effects discussed in §4.1.
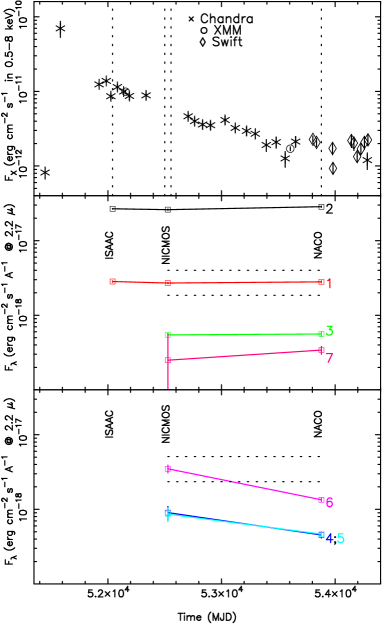
Fig. 4 shows the derived long term -band lightcurve for all our candidates compared with the Chandra/XMM-Newton X-ray lightcurve obtained over the same time span. Note that, since only objects #1 and 2 were detected in the VLT/ISAAC observations, for the fainter candidates the lightcurve is based on the HST/NICMOS and VLT/NACO points only. While the X-ray source was continuously fading, for most candidates there is no indication of IR variability on the year time scale. Object #6 apparently decreases by magnitude between August 2002 and May 2006. However, we note that this object falls in the PSF wings of the much brighter object #2 (see Fig. 1), which might have affected our photometry. A possible magnitudes flux decrease is also observed for objects #4 and 5 (with the latter being the only candidate to fall within the 68% c.l. X-ray error circle). However, in view of the larger uncertainties for fainter sources – as apparent from the scatter in the HST/NICMOS - to - VLT/NACO correlation – such evidences for variability should be taken with caution.
4.3 Color analysis
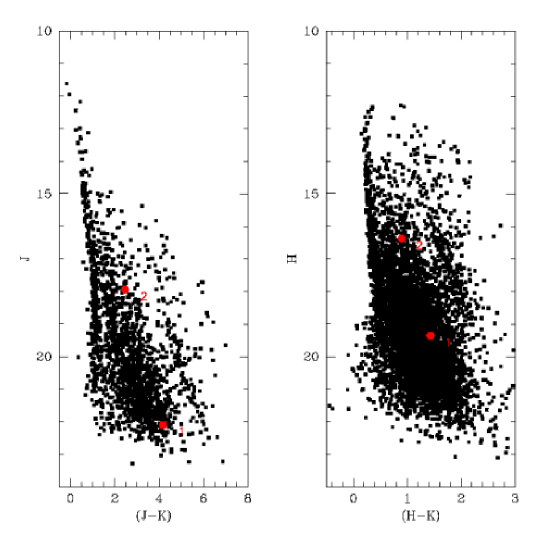
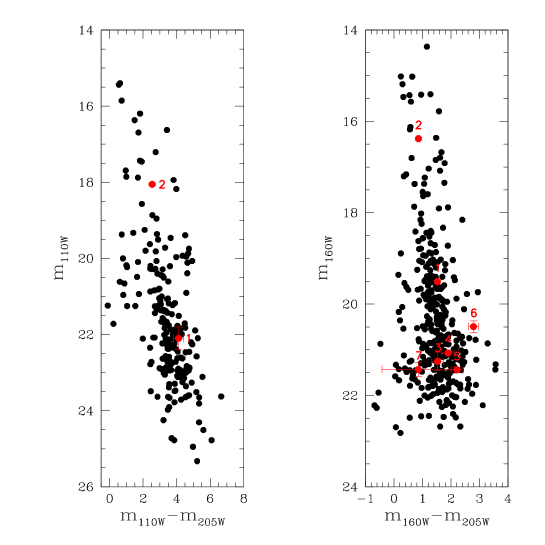
We used the available multi-band information to derive clues on the nature of the candidate counterparts. The single band, single epoch photometry catalogues derived with Daophot were matched by Allframe to create the multi-band catalogues for the VLT/ISAAC and HST/NICMOS datasets. Single epoch multi-band catalogs were finally merged and magnitudes averaged. We note that since no time variability has been found in the VLT/ISAAC and HST/NICMOS observations (see §4.1), the use of average magnitudes for each dataset does not affect our color analysis. To make the comparison between the derived VLT/ISAAC and HST/NICMOS color-magnitude diagrams (CMDs) consistent, NICMOS and magnitudes have been transformed to the ISAAC and bandpasses using the same approach applied in the previous section. The available multi-band photometry of our candidates is summarized in Table 5. The results of our color analysis are shown in Fig. 5 where we plot the candidates photometry on the VLT/ISAAC and the HST/NICMOS () and () CMDs built from the photometry of the field stars. As seen, nearly all candidates have colors consistent with the bulk of the field stellar population. The only possible exceptions are object #7, whose colour determination is however affected by the large photometry errors, and object #6 which seems to be slightly redder with respect to the CMD sequence which has an average . However, this apparently peculiar deviation could be partly due to the lower statistics of the HST/NICMOS CMD, where the redder part is poorly sampled. Indeed, objects with extreme appear less unusual in the much denser VLT/ISAAC CMD. Furthermore, we warn here that object #6, as well as perhaps #4 and 5, might be variable on the long time scale (see §4.2). Thus, its location in the CMD might not be fully representative.
4.4 Deep imaging
No other candidates have been identified in our deep IR imaging within or close to the X-ray position apart from those indicated in Fig. 1. We have used our deepest images of the field, i.e. those obtained from the co-addition of the repeated VLT/ISAAC -band, the HST/NICMOS , and the VLT/NACO -band observations, to set constraining upper limits on the flux of an hypotethically undetected CCO counterpart. We obtained and (both at ) from the HST/NICMOS and VLT/NACO observations, respectively. These values represent the deepest upper limits obtained so far for this source.
5 Discussion
Although our comprehensive study (astrometry, variability, multi-band photometry) of the potential CCO counterparts did not single out an high confidence candidate, position-wise, object #5 (inside the 68% c.l. region), objects #3 and #6 (inside the 99% c.l. region), as well as object #1 (marginally consistent, at the level) cannot be ruled out. On the other hand, objects #2, #4 and #7 may be disregarded. The field is very crowded, with a source density in the combined VLT/NACO image of objects per square arcsec at the sensitivity limit of . Before discussing the implications of our results on possible pictures for 1E 1613, we note that none of the possible candidates stands out for peculiar colors with respect to the field very red stellar population. The average H-K requires a large interstellar reddening, consistent with A. Such a reddening is much larger than the value of A expected at the distance of the X-ray source, according to the measured NH of 1E 1613 (De Luca et al., 2006), to the results of neutral H study towards RCW103 (Reynoso et al., 2004) as well as to spectrophotometry of the SNR (e.g. Leibowitz & Danziger, 1983).
Thus, if one of the plausible candidates is indeed physically associated with 1E 1613, it must have very peculiar, red intrinsic colors.
In the frame of the binary system scenario for 1E 1613 (De Luca et al., 2006), in principle, one could expect the companion star to be significantly different from a main sequence star of comparable mass. This could be the result of an early phase of irradiation by photons and charged particles from the newborn neutron star, which could have left the companion away from thermal equilibrium (Kelvin-Helmoltz time scale to thermal relaxation would be much larger than the age of the system). Tidal interaction along a very eccentric orbit could also play some role. However, the hypothesis that any of the possible candidates be the companion of 1E 1613 is very unlikely. The observed colors and magnitudes would require an unrealistically low temperature for the star ( K), implying (at a distance of 3.3 kpc and for A), a photospheric radius of (1-2) cm, exceeding the Roche lobe dimension ( cm, assuming a 1.4 M⊙ neutron star, a 0.5 M⊙ companion and an orbital period of 6.67 hours) and comparable to the system orbital separation ( cm under the same assumptions).
Within the isolated magnetar scenario (De Luca et al., 2006), a fallback disc is required in order to quench the neutron star rotation to a period of 6.67 hours in yr. Could one of the possible candidates be the fallback disc itself? Evidence for a debris disc surrounding the anomalous X-ray pulsar 4U 0142+61, recently obtained (Wang et al., 2006), make such an hypothesis not unrealistic (a faint IR source at the position of the CCO in Vela Jr. could also be related to a debris disc surrounding the compact object, see Mignani et al., 2007b). While the physics of the possible disc surrounding AXP 4U 0142+61 is not understood (passive or viscous? Wang et al., 2006; Ertan et al., 2007), we note that the colors of our candidates are similar to the case of 4U 0142+61, but their FKs/FX ratio (in the range 0.7-2 at the epoch of the NACO observations) is about one order of magnitude larger. The upper limits to the far IR emission set by Wang et al. (2007) are not constraining.
Unfortunately, mostly because of the faintness of the IR sources, results of the temporal analysis could not offer conclusive clues. The upper limits we could set do not put stringent constraints. They could be consistent with a binary scenario, since any orbital modulation would obviously depend on the inclination of the system with respect to the plane of the sky. On the other side, the isolated neutron star scenario does not allow for firm predictions about a possible IR periodicity.
We also tried to exploit the source long-term fading seen in X-rays between the NICMOS and the NACO observations looking for long-term variability to pinpoint the IR counterpart of 1E 1613. In the binary scenario, IR variability could be due to the reprocessing of the compact source X-ray radiation by the companion star (and possibly by an accretion disc, if any). The same could be true for the isolated magnetar scenario, X-ray reprocessing taking place in a fallback disc. We stress, yet again, that in both pictures the effect would be strongly dependent on the geometry of the system with respect to the line of sight. Indeed, we obtained evidence for a possible mag fading of one of the candidates, which yields a constant FKs/FX ratio in case of association to 1E 1613. However, in view of the scatter seen in the correlation of NICMOS and NACO photometric measurements for sources of comparable magnitude, such a possible evidence for IR variability is not strong enough to claim an identification.
With no compelling reasons to associate any of the possible candidates to 1E 1613, we explore the implications of a source non-detection down to Ks22.1.
Considering the binary scenario, accounting for uncertainties on the distance and reddening, such upper limit is only consistent with an M6-M8 dwarf, i.e. a very underluminous companion. It is rather unlikely that such a small star may power the mechanism proposed by De Luca et al. (2006), where accretion of wind from the companion – modulated along an eccentric orbit – explains the phenomenology of the low state. Such a picture would require an accretion rate of , implying a red dwarf wind mass loss larger by at least a factor of a few, which seems somewhat too high for such a small star. Thus, an alternative process is required to explain the X-ray phenomenology. Even the survival to the supernova explosion of a binary system with such an extreme mass ratio seems problematic. It would require an ad-hoc kick for the neutron star to avoid disruption of the system.
On the other side, the lack of an IR counterpart fits well within the isolated magnetar scenario. The upper limit to the ratio FKs/F (at the epoch of the NACO observation) is fully consistent with the values observed for all magnetars identified in the IR (see e.g. Fesen et al., 2006), including 4U 0142+61 (Wang et al., 2006). In the isolated magnetar scenario, we cannot rule out the possibility that one of the candidate sources be the residual disc surrounding 1E 1613. However, Occam’s razor argues against such a conclusion, since all possible candidates are undistinguishable from normal, background stars.
Recent SWIFT monitoring of 1E 1613 shows that the X-ray source continued to fade in the 2006-2007 time interval and that its flux is approaching the 1999, pre-outburst level (see Fig. 4). Historical observations point to a large flux variability over a yr time scale (Gotthelf et al., 1999; De Luca et al., 2006), so that a rebrightening is likely to occur. A factor increase in the X-ray luminosity (as in the 1999-2000 outburst) would yield a dramatic change in the irradiation of any possible object/structure (companion star/fallback disc) linked to 1E 1613. Thus, if a new outburst from 1E 1613 will occur, a fast follow-up in the IR will be crucial in order to conclusively address the issue of the IR counterpart for 1E 1613 and to shed light on its nature. The images described in this work will be a reference to search for variability of the counterpart.
References
- Becker & Aschenbach (2002) Becker, W., Aschenbach, B., 2002, MPE report 278, 64
- Cramér (1945) Cramér, H., 1945, Mathematical methods of statistics, Princeton University Press, Princeton (USA)
- De Luca (2007) De Luca, A., 2007, in Proc. of “40 years of Pulsars: Millisecond pulsars, Magnetars, and more”, AIP Conf.Ser., ed. by Z. Wang, C. Bassa, A. Cummings, A, Kaspi, V., in press, arXiv:0712.2209
- De Luca et al. (2006) De Luca, A., Caraveo, P.A., Mereghetti, S., Tiengo, A., Bignami, G.F., 2006, Science 313, 814
- Ertan et al. (2007) Ertan, Ü., Erkut, M.H., Eksi, K.Y., Alpar, M.A., 2007, ApJ657, 441
- Fesen et al. (2006) Fesen, R.A., Pavlov, G.G., Sanwal, D., 2006, ApJ 636, 848
- Garmire et al. (2000) Garmire, G.P., Pavlov, G.G., Garmire, A.B., Zavlin, V.E., 2000, IAU Circ. 7350
- Gotthelf et al. (1999) Gotthelf, E.V., Petre, R., Vasisht, G., 1999, ApJ 514, L107
- Leibowitz & Danziger (1983) Leibowitz, E.M. & Danziger, I.J., 1983, MNRAS 204, 273
- Li (2007) Li, X.-D., 2007, ApJ 666, L81
- Mignani et al. (2004) Mignani, R.P., De Luca, A., Caraveo, P.A., 2004, in “Young Neutron Stars and their environments”, ASP Conference Series, ed. by F. Camilo, B.M. Gaensler, San Francisco: ASP, p.391
- Mignani et al. (2007a) Mignani, R.P., Zaggia, S., Dobryzca, D., et al., 2007a, in Proc. of “40 years of Pulsars: Millisecond pulsars, Magnetars, and more”, AIP Conf.Ser., ed. by Z. Wang, C. Bassa, A. Cummings, V. Kaspi, in press
- Mignani et al. (2007b) Mignani, R.P., De Luca, A., Zaggia, S., et al., 2007b, A&A 473, 883
- Patat (2004) Patat, F., 2004, The Messenger 118, 11
- Pavlov et al. (2002) Pavlov, G.G., Sanwal, D., Garmire, G.P., Zavlin, V.E., 2002, in “Neutron Stars in Supernova Remnants”, ASP Conference Series, ed. by P.O. Slane and B.M. Gaensler, San Francisco: ASP, p.247
- Pavlov et al. (2004) Pavlov, G.G., Sanwal, D., Teter, M.A., 2004, in “Young Neutron Stars and their environments”, ASP Conference Series, ed. by F. Camilo, B.M. Gaensler, San Francisco: ASP, p.236
- Persson et al. (1998) Persson, S.E., Murphy, D.C., Krzeminski, W., Roth, M., Rieke, M.J., 1998, AJ 116, 2475
- Pizzolato et al. (2008) Pizzolato, F., Colpi, M., De Luca, A., Mereghetti, S., Tiengo, A., 2008, ApJ in press, arXiv:0803.1373
- Reynoso et al. (2004) Reynoso, E.M., Green, A.J., Johnston, S., et al., 2004, PASA 21, 82
- Sanwal et al. (2002) Sanwal, D., Garmire, G.P., Garmire, A., Pavlov, G.G., Mignani, R., 2002, BAAS 34, 764
- Tuohy & Garmire (1980) Tuohy, I., Garmire, G.P., 1980, ApJ 239, L107
- Wang et al. (2006) Wang, Z., Chakrabarty, D., Kaplan, D.L., 2006, Nature 440, 772
- Wang et al. (2007) Wang, Z., Kaplan, D.L., Chakrabarty, D., 2007, ApJ 655, 261
- Zaggia et al. (1997) Zaggia, S.R., Piotto, G., Capaccioli, M., 1997, A&A 327, 1004
| yyyy-mm-dd | Time (UT) | Filter | T (s) | Seeing (“) | Airmass |
|---|---|---|---|---|---|
| 2006-05-24 | 00:49:53 | Ks | 2280 | 0.84 | 1.57 |
| 01:57:36 | Ks | 2040 | 0.64 | 1.36 | |
| 02:45:14 | Ks | 1200 | 1.10 | 1.23 | |
| 03:14:21 | Ks | 2280 | 1.02 | 1.18 | |
| 04:04:24 | Ks | 2280 | 0.91 | 1.13 | |
| 04:54:17 | Ks | 2280 | 0.81 | 1.12 | |
| 05:44:25 | Ks | 1200 | 0.80 | 1.14 | |
| 06:11:50 | Ks | 2280 | 0.90 | 1.16 | |
| 07:02:02 | Ks | 720 | 1.06 | 1.24 | |
| 07:19:58 | Ks | 2280 | 0.95 | 1.28 | |
| 08:09:50 | Ks | 1920 | 1.00 | 1.44 | |
| 08:56:06 | Ks | 360 | 0.89 | 1.67 | |
| 2006-05-25 | 00:55:12 | Ks | 2280 | 0.61 | 1.54 |
| 01:57:43 | Ks | 2280 | 0.66 | 1.34 | |
| 02:47:40 | Ks | 2280 | 0.60 | 1.22 | |
| 03:37:25 | Ks | 2280 | 0.65 | 1.15 | |
| 04:27:26 | Ks | 2280 | 0.64 | 1.12 | |
| 05:17:22 | Ks | 2280 | 0.62 | 1.12 | |
| 06:08:53 | Ks | 2280 | 1.00 | 1.16 | |
| 06:59:57 | Ks | 2280 | 0.96 | 1.24 | |
| 07:50:24 | Ks | 600 | 0.72 | 1.38 | |
| 08:06:16 | Ks | 2280 | 1.00 | 1.44 |
| yyyy-mm-dd | Time (UT) | Filter | T (s) | Seeing (“) | Airmass |
|---|---|---|---|---|---|
| 2001-04-10 | 07:33:07 | J | 2000 | 0.68 | 1.12 |
| 07:33:07 | J | 2000 | 0.68 | 1.12 | |
| 2001-05-12 | 06:04:33 | Ks | 2000 | 0.95 | 1.13 |
| 2001-05-13 | 04:42:57 | Ks | 2000 | 1.00 | 1.13 |
| 05:39:35 | Ks | 2000 | 1.41 | 1.12 | |
| 2001-06-06 | 05:55:32 | H | 1000 | 0.64 | 1.28 |
| 06:46:57 | H | 200 | 1.04 | 1.34 | |
| 2001-07-23 | 01:48:12 | H | 1000 | 1.03 | 1.14 |
| 02:20:50 | H | 1000 | 0.98 | 1.18 | |
| 02:50:03 | H | 1000 | 1.02 | 1.22 | |
| 2001-07-29 | 00:17:16 | H | 1000 | 0.73 | 1.12 |
| 02:45:57 | H | 950 | 0.70 | 1.26 | |
| 03:14:54 | H | 1000 | 0.84 | 1.33 | |
| 03:43:08 | H | 1000 | 0.70 | 1.43 | |
| 2001-07-30 | 00:27:13 | H | 1000 | 1.00 | 1.12 |
| 01:04:19 | H | 1000 | 1.00 | 1.13 | |
| 01:32:56 | H | 1000 | 1.00 | 1.15 | |
| 02:01:25 | H | 1000 | 1.00 | 1.18 |
| yyyy-mm-dd | Time (UT) | Filter | T (s) |
|---|---|---|---|
| 2002-08-15 | 02:25:38 | 2590 | |
| 04:10:28 | 2590 | ||
| 06:05:15 | 2590 | ||
| 09:09:37 | 2590 | ||
| 11:12.32 | 935 | ||
| 12:40:18 | 1007 | ||
| 2002-10-08 | 08:50:00 | 2590 | |
| 10:27:32 | 2590 | ||
| 12:04:01 | 2590 | ||
| 13:40:14 | 2590 | ||
| 15:19:28 | 935 | ||
| 15:42:17 | 1007 |
| Id. | VLT/NACO | VLT/ISAAC | HST/NICMOS |
|---|---|---|---|
| () | () | () | |
| 1 | 18.01 (0.09) | 19.082 (0.29) | 19.51 (0.09) |
| 2 | 15.50 (0.03) | 16.411 (0.03) | 16.38 (0.02) |
| 3 | 19.71 (0.20) | - | 21.25 (0.08) |
| 4 | 19.71 (0.21) | - | 21.07 (0.04) |
| 5 | 19.66 (0.37) | - | 21.44 (0.16) |
| 6 | 18.56 (0.27) | - | 20.49 (0.16) |
| 7 | - | - | 21.43 (0.07) |
| ID | ISAAC | NICMOS | NACO | ||||
|---|---|---|---|---|---|---|---|
| J | H | K | J | H | K | K | |
| 1 | 22.100.10 | 19.360.03 | 17.930.02 | 22.100.30 | 19.500.02 | 17.980.02 | 17.940.03 |
| 2 | 17.940.01 | 16.380.01 | 15.490.01 | 18.050.01 | 16.380.03 | 15.520.02 | 15.420.02 |
| 3 | - | - | - | - | 21.250.20 | 19.720.04 | 19.690.07 |
| 4 | - | - | - | - | 21.070.01 | 19.170.21 | 19.920.09 |
| 5 | - | - | - | - | 21.430.01 | 19.220.21 | 19.890.08 |
| 6 | - | - | - | - | 20.490.17 | 17.700.12 | 18.740.05 |
| 7 | - | - | - | - | 21.430.15 | 20.571.27 | 20.230.12 |