SDSS 1507+52: A HALO CATACLYSMIC VARIABLE? 111Based on observations obtained at the MDM Observatory, operated by Dartmouth College, Columbia University, Ohio State University, Ohio University, and the University of Michigan.
Abstract
We report a photometric and spectroscopic study of the peculiar cataclysmic variable SDSS 1507+52. The star shows very deep eclipses on the 67 minute orbital period, and those eclipses are easily separable into white-dwarf and hot-spot components. This leads to tight constraints on binary parameters, with , , , , , and degrees. Such numbers suggest possible membership among the WZ Sge stars, a common type of dwarf nova. The spectroscopic behavior (strong and broad H emission, double-peaked and showing a classic rotational disturbance during eclipse) is also typical. But the star’s orbital period is shockingly below the “period minimum” of 77 min which is characteristic of hydrogen-rich CVs; producing such a strange binary will require some tinkering with the theory of cataclysmic-variable evolution. The proper motion is also remarkably high for a star of its distance, which we estimate from photometry and trigonometric parallax as 230 40 pc. This suggests a transverse velocity of 164 30 km/s - uncomfortably high if the star belongs to a Galactic-disk population. These difficulties with understanding its evolution and space velocity can be solved if the star belongs to a Galactic-halo population.
“…of a most insignificant smallness, and a swift wanderer among the stars.” – Kepler (1619), Harmonices Mundi
1 Introduction
Among the cataclysmic variables so far discovered in the Sloan Digital Sky Survey, one of the most peculiar is the 67-minute eclipsing binary SDSS J150722.30+523039.8 (hereafter SDSS1507). Szkody et al. (2005, hereafter S05) presented a light curve showing sharp eclipses, and a spectrum with the characteristic absorption lines of a DA white dwarf. The orbital period is very peculiar, far below the well-known “period minimum” of min for hydrogen-rich binaries. This is quite difficult to understand. However, binaries with sharply defined eclipses offer good diagnostics for measuring the individual masses, and so we carried out an extensive photometric, spectroscopic, and astrometric study during 2005-7. Here we report the results of that study. Another study is presented by Littlefair et al. (2007, hereafter L07).
2 Astrometry, Distance, and Velocity
We have accumulated a two-year series of astrometric images of SDSS1507 with the 2.4m Hiltner telescope at MDM Observatory. Table 1 is a journal of the astrometric observations.
The astrometric images contain some photometric information. While nearly all observations were in the -band, we also took four -band images on three different photometric nights, in order to calibrate the field and program star magnitudes and colors for the astrometric reduction. The image pairs, reduced using Landolt (1992) standards and corrected for orbital variation, gave average values = 18.34 and = +0.23.
We also derived differential magnitudes from the -band parallax images and folded them using the eclipse ephemeris derived from the high-speed photometry (discussed below). The resulting light curve appears similar to the high-speed light curve, but with coarser time resolution because of the relatively long (120 to 150 s) integration times. This fine agreement, obtained from many short visits spread over two years, emphasizes the reproducibility of the light curve.
The parallax and proper motion analysis followed procedures detailed by Thorstensen (2003). On each -band image we measured 57 stars, 28 of which we used to define the reference frame. We found a relative parallax mas, where the uncertainty is estimated from the goodness of fit. Correcting for the estimated mean distance of the reference frame stars, we found an absolute parallax mas. The scatter in the fitted parallax for stars in the field with brightness similar to SDSS1507 is 1.9 mas, so we adopt 2.5 mas as a conservative estimate on the external error of . Thus we find mas. The parallax is consistent with zero; our somewhat conservative upper limit implies a distance pc with over 90% confidence.
Given its distance, SDSS1507 has a strikingly large proper motion: mas yr-1. A proper motion this large is typical of disk-population stars only a few tens of parsecs distant, so the space velocity is clearly very large.
Combining the proper motion with the parallax, interpreting the proper motion using the assumed CV space-velocity model discussed by Thorstensen (2003), and accounting for the Lutz-Kelker parallax bias, we obtain a purely astrometric distance pc (68% confidence). This is much smaller than because the high proper motion drags the estimate to smaller distances. The velocity assumptions (that space velocities of CVs are generally low, with a small high-velocity tail) basically quantify the implausibility of the huge space velocity required by high proper motion at the simple distance.
There is an independent constraint available from the time-series photometry (reported below). Eclipse ingress and egress of the white dwarf (hereafter WD) are easily seen in the light curve, and show that a small object of magnitude reappears when the WD does. The photometry discussed below reveals a WD radius of , and the SDSS colors, along with our scattered photometry, suggests K. Assuming that the line of sight permits full hemispheric visibility of the WD near the contact phases of the eclipse, this implies an absolute magnitude . This in turn yields a “white dwarf parallax” distance of pc. The estimate ( K) of L07 might be superior, since it is based on full multicolor eclipse light curves; that implies , and thus pc. Splitting the difference yields pc. Combining this with the astrometric result, we obtain a final estimate pc, which we shall characterize as pc.
At this distance, the transverse velocity of SDSS1507 (corrected to the LSR) is km s-1 – a speedy traveler through local skies! To judge its significance, we examined a catalogue of all CVs of known orbital period (an expanded version of Table 1 of Patterson 1984), and calculated transverse velocities for all 354 CVs of known , distance, and proper motion. We excluded stars known or strongly suspected to be helium-rich (although these stars are very few and mostly ineligible anyway, since few of them offer distance constraints). The distance estimates used all the various clues available (discussed by Patterson 1984), with highest weight accorded to parallaxes and detections of the secondary. The proper motions came mainly from the UCAC-2 (Zacharias et al., 2004), or from published studies of individual stars, or from the Dartmouth parallax program. No correction for solar motion was applied.
The upper frame of Fig. 1 shows the distribution of transverse velocities. The velocities average 33 km s-1, a plausible value for 1 M⊙ stars in the thin-disk population. There are two outliers: SDSS1507 at 174 km s-1 (ignoring the solar motion correction boosts its transverse velocity slightly), and BF Eri at km s-1 (Sheets et al., 2007, not shown here, but discussed in Section 9 below). The lower frame shows the distribution with , and includes 482 stars, since the only admission credential is a known . This illustrates the familiar 2-3 hr period gap, the pile-up of stars at the 1.3 hr minimum period and SDSS1507, a solitary intruder sitting aloof at 1.1 hr. These two oddities are the motivation for this paper.
Just for the record, we can use our measurement of the emission-line mean velocity ( km s-1, discussed below) as an indicator of the star’s systemic radial velocity; at face value this gives a space velocity (referred to the LSR) of km s-1. Very speedy. The components are km s-1.
3 Spectroscopy
During 2006 Jun 16-19, we obtained 53 spectra of 300 s each, with a total exposure equivalent to 3.9 orbital periods. We used the Hiltner 2.4 m telescope, modular spectrograph, and a thinned SITe CCD detector, yielding 2.0 Å per pixel and 3.5 Å FWHM resolution in the range 4300-7500 Å, with vignetting near the shorter wavelengths. The transparency was good throughout, but the spectra varied in quality due to seeing and guiding variations. For wavelength calibration we used a comparison spectrum taken during twilight, shifted to match the zero point derived from night-sky lines in the individual exposures; a cross-check using OH bands in the far red showed this procedure to be accurate to typically 5 km s-1. For reductions we mostly followed standard IRAF-based procedures, but in place of the IRAF apsum routines we used an original coding of the optimal extraction algorithm published by Horne (1986). We flux-calibrated the spectra using numerous observations of standard stars obtained during twilight on clear nights throughout the run.
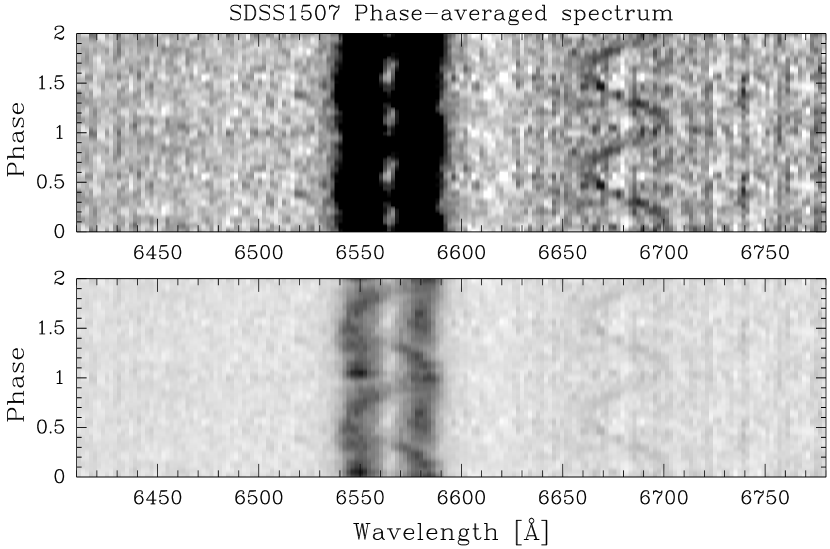
Fig. 2 shows the average flux-calibrated spectrum, and Table 2 gives measurements of spectral features. The blue continuum and absorption around H indicates that the WD contributes strongly to the total light. The H and Hβ emission lines are double-peaked, with the H peaks separated by 1320 km s-1. The continuum is noisy, because of the star’s faintness – synthetic photometry using the Bessell (1990) passband gives , in good agreement with the filter photometry. This average spectrum is very similar to the SDSS spectrum (S05, L07).
We measured radial velocities of H using a double-Gaussian convolution method (Schneider & Young, 1980; Shafter, 1983), with Gaussians of 370 km s-1 FWHM separated by 2200 km s-1. In effect, this measured the steep sides of the line profile. The observations were not distributed to optimize period finding, since the period was already known from eclipses; even so, a period search of the resulting time series recovers the correct orbital period. There is no evidence for any other period in the velocities. Fig. 3 shows the velocities folded on the eclipse ephemeris, together with the best-fitting sinusoid. The velocity reaches maximum redshift at , although the WD must be in maximum recession at . This is very commonly seen in cataclysmic variables; the disk’s rotational velocities are large compared to any plausible orbital motion of the WD, so a slight periodic asymmetry in the disk’s line emission can create a large spurious radial velocity signal. It is famously cursed as the “phase-shift problem” (Stover 1981; Hessman 1987; Thorstensen et al. 1991; Sec. 2.7.6 of Warner 1995). There is now depressing evidence that the phase-shift problem can even contaminate the ultraviolet absorption lines, thought to arise from near the WD (Steeghs et al., 2007).
To make weaker features visible, we combined our spectra into a two-dimensional greyscale representation using procedures explained by Taylor et al. (1999). The individual spectra were rectified before combining (suppressing continuum variations), and cosmic rays were edited out by hand. Fig. 4 shows the region around H and He I . A prominent ‘S-wave’ is seen in both lines, and is especially clean in the He I line. A similar S-wave is seen in HeI , and less prominently in H. We measured the positions of these by eye in an image display; sinusoidal fits to these measures gave nearly identical results. The half-amplitude of the S-wave motion is 840 30 km s-1, and the S-wave velocities cross from blue to red at .
The amplitudes and phases of these radial-velocity variations merit comparison to WZ Sge, the granddaddy of the short-period systems. In SDSS1507 the centroid of the broad emission lags the WD by 0.15 0.03 cycles, and in WZ Sge the lag is 0.12 0.02 (Spruit & Rutten, 1998; Gilliland et al., 1986). Their respective S-waves reach maximum radial-velocity at and 0.13. This suggests great similarity in the emission-line structures. In particular, it underlines that phase-shift woes significantly affect both stars, and likely for the same (unknown) reason, preventing – as usual – any direct interpretation of as the dynamical motion of the WD.
4 High-Speed Photometry
4.1 Data Taking
Time-series differential photometry, relative to a nearby comparison star, was obtained on 20 nights in 2005-7, with a CCD photometer on the 1.3 m and 2.4 m telescopes of MDM Observatory. We typically chose an integration time of 15 s, and usually employed a “wide blue” filter to better define the deep eclipses, and to maximize sensitivity to weak signals. The observations spanned 55 binary orbits, plus a few orbits in , , and filters. Outside eclipse, the star’s mean brightness was .
4.2 Light Curves and Eclipses
A typical night’s light curve is shown in the top frame of Fig. 5; and indeed, every detail of the light curve repeated almost exactly on every night of observation. The main features are periodic humps and sharp dips, which recur every 67 minutes. The mean 2006 light curve is shown in the middle frame, which has been converted to an intensity scale, where the comparison star is arbitrarily scaled as 1000 counts. This shows that the dip consists of two distinct parts: a WD eclipse which is about 70% of the mean light, and a “bright-spot” (BS) eclipse which is about 15% of the mean light. The bottom frame shows a close-up view of the eclipse region. This too is a mean orbital light curve, but we achieved a higher effective by calculating the exact orbital phase at each mid-exposure, and using 800 bins per orbit. This was only possible because the light curve repeats so exactly, and because we observed for many orbits.
We measured mid-ingress and mid-egress times of the WD eclipse (the sharp transitions at ) for each eclipse, and consider the midpoint between these precisely measurable events as the time of mid-eclipse. These times are presented in Table 3, and shown in the O-C diagram of Fig. 6 (along with the L07 timings, which are given triple weight since they show a lower dispersion). The slight upward trend indicates a small correction to the test period, and the straight-line fit satisfies all timings to an accuracy of 2 s. Since the original time series have a time resolution of 22 s (15 s integration plus 7 s readout), this is a satisfactory fit. Thus the best orbital ephemeris is
| (1) |
The lesser component (BS) of the periodic eclipse is often too weak to measure reliably in individual eclipses, but is easily measured in the yearly means. In 2006, mid-ingress and mid-egress occurred at and 0.0735(10), In 2005, these events occurred at and 0.0735(8). In 2007, a coarser measurement gave 0.010(2) and 0.074(2). Thus all the timings were consistent with 0.0114(7) and 0.0735(6).
Finally, the full ingress/egress durations of the WD eclipse were measured to be 35 4 s, by fitting the yearly light curves to a model in which a tilted knife-edge (the secondary’s limb) occults a bright sphere with limb-darkening.
4.3 White-Dwarf Pulsations
We searched for other periodic signals by calculating power from the Fourier transform of the light curve. We did this for each night with more than 4 hours observation, and then averaged to find the mean nightly power spectra in 2005 and 2006, after removal of eclipses (which severely contaminate the raw power spectra). Most of the significant features were merely harmonics (up to the ninth) of the orbital frequency ω; so we concluded that even apart from the obvious eclipses, the orbital waveform is still a very strong contaminant. Hence we “cleaned” the light curves by subtracting harmonics fitted to amplitude and phase. We then re-segregated these yearly cleaned light curves, and calculated the nightly power spectra.
The yearly means are shown in Fig. 7, with arrows flagging significant features with their frequency in cycles per day ( 0.5). Signals near 76, 130, and 175 cycles d-1 appear, though with the exact frequencies somewhat unstable. Nothing was found in the range 400-1000 cycles d-1.
Single-night power spectra are not a good detection tool for frequencies this low: too few cycles elapse in the course of a night. To increase sensitivity and accuracy, we spliced consecutive nights together (JD 2453502-4 in 2005 and JD 2453878-81 in 2006), and show the resultant power spectra in Fig 8. The 2005 light curve showed a primary signal at 76.60 0.06 cycles d-1, with another at 132.59 and a complex near 176 cycles d-1. As the picket-fence structure in the figure suggests, each frequency has some possibility of daily cycle count error. The 2006 light curve showed apparent counterparts of each signal, but with frequencies red-shifted by a few percent: to 74.94, 128.05, and 171.30 (all 0.04) cycles d-1. The 2006 coverage was more extensive, and daily cycle count error is very unlikely. We assume that these trios represent basic frequencies in the star, and will call them ω, , and , in order of increasing frequency. All are incommensurate with the orbital frequency , but the weaker signals appear to be linked to each other since within measurement error during both years.
Inset are the power spectra of artificial signals sampled exactly like the real data; these show how a pure sinusoid at that frequency should appear, in the absence of noise. For a strong signal any deviation from this window pattern signifies an underlying complexity of the signal. The strong signal at 74.94 cycles d-1 in 2006 shows significant excess power in its blue wing, which basically attests to an unresolved fine structure in the signal. The same is not evident for the signals at higher frequency. In 2005, the strongest signal again is complex; that is probably also true for the weaker signals, but is not quite provable amid the surrounding noise.
In summary, SDSS1507 shows a dominant signal near 1140 s, with at least one additional component at slightly shorter period. When we attempted to parse the underlying fine structure, we could not do so unambiguously. But the components must be variable in frequency and/or amplitude, and there are probably at least three of them (many trials with only two components failed to give a satisfactory fit). Weaker signals near 660 and 500 s are also evident; their frequencies appear to be consistently separated by exactly .
The light curve and spectrum show that a WD dominates the light, so these signals are very likely to be seated in the WD. The complexities observed here (multiple and incommensurate periods, with fine structure) are often found in the nonradial pulsations of WDs, the ZZ Ceti stars. So SDSS1507 has joined the small club of CVs with nonradial WD pulsations, which we shall call the “GW Lib stars”, after its first and most famous member (for other members and a review, see Mukadam et al. 2007).
5 Eclipse Analysis and the Binary Parameters
The timings of the WD and BS contact points can be used, essentially following Wood et al. (1989), to estimate the binary parameters of SDSS1507. These estimates are listed in Table 4 and have been determined via the following steps.
First, in a binary with a Roche-lobe-filling secondary, the full width at half-intensity of the WD eclipse () defines the acceptable solutions. Our measured and the method described by Chanan et al. (1976) implies the constraint seen in Fig. 9.
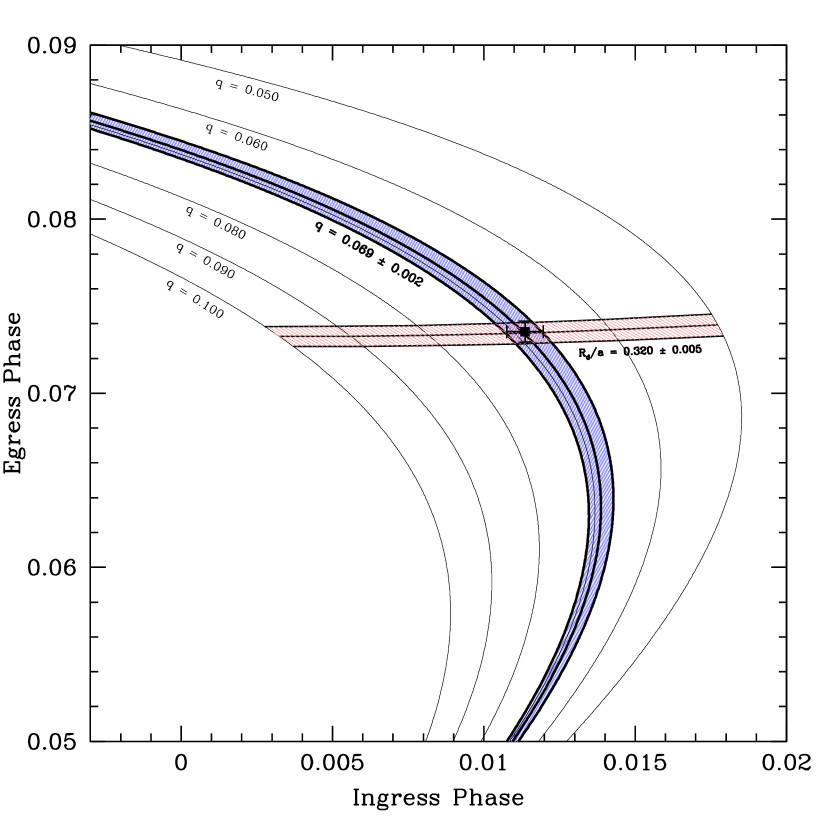
Second, the mid-ingress and mid-egress phases of the BS eclipse ( and φ) can be used to estimate , under the assumption that the BS lies in the orbital plane and along the ballistic trajectory of the accretion stream from the L1 point. We have therefore calculated stream trajectories for a range of mass ratios (Flannery, 1975) and worked out the ingress/egress phases of a set of points along each trajectory using methods similar to that described by Chanan et al. (1976). Fig. 10 shows the calculated stream trajectories for various mass ratios in the () plane, along with the best measurement of those phases. We thus estimate , and Fig. 9 then implies degrees.
Third, if the BS photometric center lies at the disk’s outer edge, then this method also provides an estimate of the disk’s radius. Fig. 10 yields .
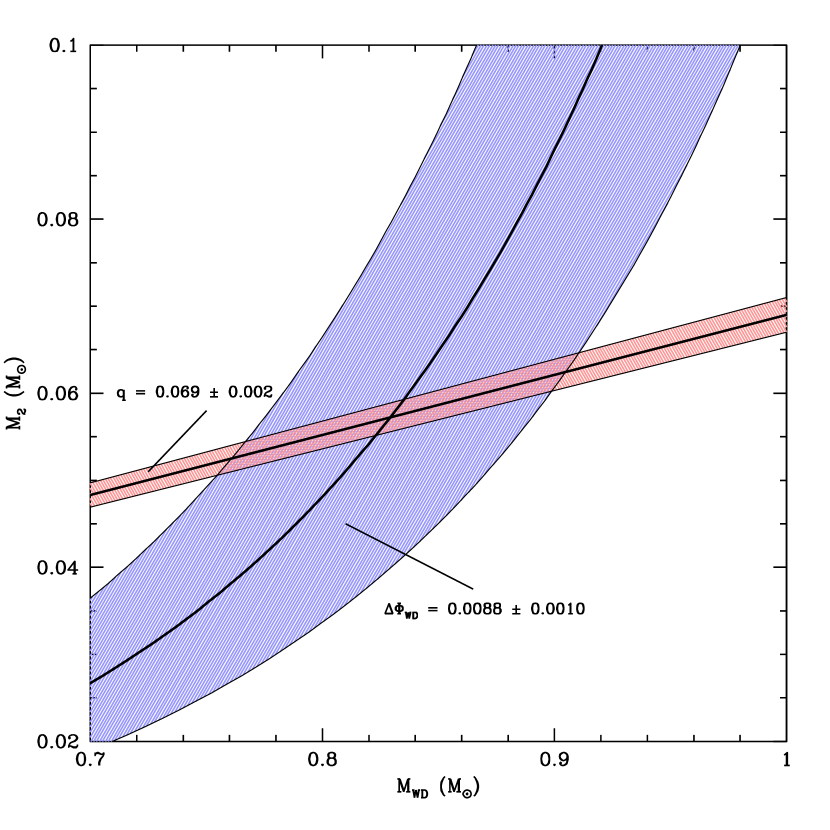
Fourth, the duration of the WD ingress and egress ( s) is directly related to the visible diameter of the WD (e.g. Araujo-Betancor et al. 2003). Assuming that the WD is fully visible (e.g. not partially blocked by the disk), we can use this to estimate a WD radius for each allowed pair. Finally, we use a theoretical WD mass-radius relation (Nauenberg, 1972) to deduce a WD mass (and therefore also , since is known). The situation is shown graphically in Fig. 11. The best estimates are M⊙.
The binary separation then follows from Kepler’s Third Law: . The secondary radius follows by combining the relation given by Eggleton (1983) with the measured values for and . The result is .
6 Nature and Evolution
The component masses of SDSS1507 are reminiscent of dwarf novae with low accretion rate and long recurrence time, sometimes called the “WZ Sagittae stars”. Most such stars do not eclipse and thus do not have precisely known parameters, but WZ Sge itself appears to be similar, with likely masses near M⊙, M⊙ (e.g. Patterson 1998; Skidmore et al. 2000) 222A quite different value of (near 0.10 M⊙) appears commonly in the literature. This comes from applying Kepler’s Laws with the observed of the emission lines. But because these lines are significantly phase-shifted, because the distortion consistently increases the derived (see Figure 10 and Appendix A of Patterson et al. 2005), and because photometric evidence suggests a much lower , we favor the low- solution.. Most other class members are probably similar, on evidentiary grounds of low and/or low accretion rate (see Table 3 of Patterson et al. 2005). In SDSS1507 the eclipse suggests for the BS near its eclipse phase 333We use this as a fiducial because it is well-specified by the eclipse, and because it roughly agrees with the height of the orbital hump. But the observed hump is merely the asymmetrical part of the bright-spot luminosity; a slightly larger fraction of the total light could arise from the bright spot.; at 230 pc, this implies , which is very faint for dwarf novae generally. For the total accretion light averaged over orbital phase, we similarly have and .
Since WZ Sge itself appears to have a similar structure, and has a precisely known distance (43 pc; Thorstensen 2003; Harrison et al. 2004), we can use it to scale estimates of SDSS1507. The BS eclipse in WZ Sge is 11(1)% of the total light, which implies at the eclipse phase, and therefore . This substantially agrees with the estimate of in SDSS1507. The stars also resemble each other in spectrum (strong and broad doubled emission lines, plus WD absorption features).
However, SDSS1507 is certainly very unusual in two respects: the high space velocity and the short orbital period (Fig. 1). The high space velocity is hard to explain: Galactic-disk stars of 1 M⊙ normally show space velocities 50 km s-1, and our estimate of 167 km s-1 is more suggestive of a Galactic-halo membership. Then there is the 67 min orbital period, a full 15% below the 77 min period minimum. Roche-lobe geometry constrains CV secondaries to obey a = constant relation (Faulkner et al., 1972), so another way of putting this is “an oddly short period implies an oddly dense secondary”. What would cause that?
Well, there are a few CVs with oddly short periods, but all have known or strongly suspected high helium abundance. This is obviously true for the pure-helium secondaries in the AM CVn class (Faulkner et al., 1972; Nelemans et al., 2001), and is strongly favored for a few other dwarf novae as well (V485 Cen: Augusteijn et al. 1996; EI Psc: Thorstensen et al. 2002; Skillman et al. 2002), on grounds of very strong He I emission from the disk. This does not much resemble SDSS1507, which has helium lines of ordinary strength for low- dwarf novae (with He I near 0.1). Although high He abundance is a simple and effective way to explain a dense secondary, it does not seem to be supported here by evidence.
Another way, strangely enough, is a metal-poor secondary. Cool metal-poor stars lack opacity sources in the envelope; so for a given mass, they radiate their luminosity at a smaller radius. For late M stars, the radii of Population II models are about 20% smaller than their Population I counterparts of equal mass (D’Antona, 1987). With the relation, this moves the minimum period from 77 min to roughly 58 min, and hence leaves plenty of room for SDSS1507. Very similar results were found in the models of Stehle et al. 1997 (see their Figure 1 and Table 2).
Population II membership also explains the high space velocity in a natural way, since solar-neighborhood members of that class always have high velocity. That bodes well for a scientific theory – a single hypothesis explaining the two outstanding anomalies (hypotheses non multiplicanda sine necesitate; Ockham 1330). But is its a priori likelihood too low?
Well, roughly 0.5% of stars in the solar neighborhood are Population II stars “just passing through” (Gould et al. 1998) 444 This percentage varies from 0.2 at the Galactic plane to 2 at kpc; we estimate at , typical for CVs.. About 200 CVs of short orbital period are known, so finding one Greek among the Trojans seems plausible, assuming that different stellar populations are comparably talented in forming CVs.
Does this prove halo membership? Nope. Among stars generally, space velocities near 188 km s-1 also include members of intermediate populations (e.g. “thick disk”). We do not yet have enough information (and enough space velocity) to certify halo membership. Future spectroscopic study might change this, if the binary components’ pollution of each other’s surface is not too problematic.
7 Pulsations Revisited
Isolated WDs with nonradial pulsation - the ZZ Ceti stars - have well-measured temperatures and masses. Spectroscopy and colors, along with measured parallax, accurately establish and , and the pulsations appear to afflict all WDs in a narrow temperature range. For garden-variety WDs of 0.6 M⊙, that range appears to be 11000-12300 K (the instability strip). However, theory suggests that the boundaries depend slightly on mass. Fontaine et al. (2003) calculate that the center and width of the strip should increase with mass, and observations appear to support this (see Figure 6 of Gianninas et al. 2005). In particular, the expected instability strip for the the 0.83 0.08 M⊙ WD mass in SDSS1507 is 11400-12900 K. Adding uncertainty for the general dearth of WD variability studies for masses this high, we would characterize the “expected” range as 11300-13000 K (in the scale used by Gianninas et al. 2005; this might vary slightly from author to author).
Fussing over these numbers is worthwhile, because we still do not know (and neither does anybody else) whether the WDs in GW Lib binaries are merely ZZ Cet stars, or whether accretion and/or membership in a close binary plays an important role in the excitation and properties of the pulsations. On the observational side, we need to know the WD temperatures, and available estimates are still crude. Temperature measures in ZZ Cet stars are typically 200 K, when a fit to the full spectrum can be made with no needed corrections. For CVs, the uncertainty is much larger. Other light sources (disk plus BS) always contaminate, and this is very difficult to subtract since there are no cases where it can be measured in the absence of the WD. Also, the distances to most CVs are poorly known, so observers commonly fit only and merely assume a radius (in particular, assume , corresponding to ). Finally, most fits are fairly poor, and are greatly improved by adding arbitrary second components of different area and different temperature –– a little deus ex machina which suggests that the model is somewhat flawed.
But the situation is not all bad. Happily, the temperatures are roughly in the range 10000-16000 K, where Lyman- absorption is dominant and temperature-sensitive. Present constraints are summarized by Szkody et al. (2002, 2007): temperatures are known for five GW Lib stars; four are near 15000 K, and one is 10600 K. The reporting papers do not contain much discussion of errors, but our impression is that they are likely to be at least 1400 K. Unfortunately, none of the five have WD masses usefully constrained by other data (and this alone implies an error of 1000 K, since and are highly correlated in absorption-line fitting). That being so, and with the oddball at 10600 K (V455 And; Araujo-Betancor et al. 2005) the important questions for GW Lib stars appear to be still unanswered: do they have an instability strip, and does it agree with the ZZ Ceti strip?
SDSS1507 is of interest here, because its WD has a well-measured mass and radius (). The star has 700 K (splitting the difference between the estimates in Sec. 2), and the ZZ Ceti instability strip for this mass is 11300-13000 K. So for this star, agreement with the ZZ Ceti strip is possible. On the other hand, the star accretes matter and may have a metal-poor composition, so the “expected” instability strip is certainly an open question. Arras et al. (2006) show that the theoretical instability strip is greatly affected by the WD mass and the composition of the envelope. This challenges obervers to find ways of estimating the mass of these pulsating WDs. (And, to spice up the wish list, the composition of accreted gas!)
8 A Recently Formed CV?
As this paper was being written, we received a preprint from L07 containing a similar discussion of SDSS1507. Comparison of the two papers might be useful.
The quality of the orbital light curves appears to be similar, and comparison of the light curves (their Figure 1 and our Figure 5) shows that the star was in a similar state (quiescence). L07 present filtered photometry, however, and explicitly fit a WD flux distribution; this is likely to yield more accurate WD properties, so their estimate of (11000 500 K versus 12000 1200) is perhaps better. We obtained much more photometric coverage (55 orbits versus 6), which perhaps explains why we found the WD pulsations.
The accuracy of the derived binary parameters (our Table 4 and their Table 4) is worth some attention. There is generally good agreement within our uncertainties. But L07 report very small errors, about six times smaller than ours. In part, this is probably because their data are slightly better (bigger telescope, faster time resolution, all multicolor). In part it is probably because their method of “parameter estimation” tends to use all the information in the light curve to constrain each component, whereas our method is more piece-by-piece. Both methods are vulnerable to their untested assumptions: e.g., that the “white dwarf” is actually round and fully visible; that the bright spot’s photometric center occurs at the disk periphery; that the bright spot’s photometric center occurs at the stream/disk impact point; and that the disk is circular. And this litany of potential vulnerabilities is not complete; it comes from about two minutes of passing pessimism.
L07 also favor a very different model for SDSS1507: a CV recently formed from a detached WD - brown dwarf pair (see Politano 2004 for a discussion of the theory). The idea is that the “zero-age assumption enables the brown dwarf to keep a relatively high density, and not distend due to the loss of thermal equilibrium that appears to afflict other CVs. This formally does the trick – oddly, by invoking great youth rather than great age! But we disfavor this idea. First, it leaves the high space velocity entirely unexplained. Second, it requires an auxiliary postulate: that SDSS1507 is unique. Politano (2004) suggests that such CVs might be fairly common, because brown dwarfs have long thermal timescales and can remain at their natural radius for 1-2 Gyr in a CV environment (losing mass at only M⊙ yr-1). But this should produce a significant “zero-age to terminal-age” spread among the secondaries, which would be manifest by a large dispersion about the mean in mass-radius, and a quite “soft” period minimum. Observations seem to reveal a tight mass-radius relation (Figure 12 of Patterson et al. 2005, Figure 6 of Knigge 2006), and a proverbial brick wall at min (Figure 1).
Elsewhere (Patterson, 1984, 1998, 2001) we have speculated why the observed period minimum is shifted from the pure-GR theoretical value of 70 min (because mass-transfer is slightly enhanced over the pure-GR expectation), and why it is a brick wall (because the enhancement is roughly the same in all CVs) 555It remains possible, and we earlier advocated (Patterson, 1998), that the period minimum actually is soft, because the enhancement varies significantly from star to star. This is an important point often missed in the literature on the subject. It would explain the much-discussed absence of a “spike” at 77 min (Patterson, 1998; King et al., 2002). But if so, then the theoretical minimum should range from 77 to (say) 90 min - which still leaves 77 as the minimum, and a 67 min H-rich binary still unexplained and mysterious.. But regardless of the merit of those speculations, a H-rich system at min is indisputably odd. The L07 model can make such a binary, but has no natural way to make only one; the star just doesn’t have any close relatives. A halo model better survives encounter with Ockham’s Razor, because it explains both surprising facts, not merely the period, and because it does not require any extra novelty to explain why the star is unique (the Galactic halo is known to exist and to contribute 0.5% of stars to the solar neighborhood).
9 Other Halo CVs?
Are there other CVs which belong to the Galactic halo? Well, they must be extremely rare. There are really only three grounds for invoking halo membership:
-
1.
Very high space velocity (decent evidence if high enough).
-
2.
Very low metallicity (quite good evidence).
-
3.
Residence in a globular cluster (excellent evidence).
As for (1), SDSS1507 is one of just two outliers among the 354 stars we considered. We also inspected a secondary list of 150 CVs with proper motion and rougher distance constraints (based on disk “standard candle” assumptions only). None showed remarkably high transverse velocity (100 km s-1). So there are just two among 500, nearly all in the solar neighborhood (within 1 kpc).
As for (2), no CV has ever been certified to be of low metallicity. Abundance studies in CVs are still basically beyond our reach, except in a few cases where the stars fairly scream at us (the helium stars).
As for (3), globular clusters have been closely studied for binary-star members, and a few dozen likely CVs have been found. Little is known about most of them. There is one classical nova (T Sco in M80, Baxendell 1902), and one dwarf nova with a likely 6.7 hr orbital period (V101 in M5; Neill et al. 2002). Since CVs in globular clusters probably form by capture processes, these stars are in a special category.
To these three grounds we can add a fourth of much lower scientific weight, but by far the most common argument for invoking halo membership: height above the galactic plane, suggested by the galactic latitude and an assumed distance. This has revealed some odd stars, but just a tiny handful at heights above 1 kpc; and even in that lonely place, there appear to be plenty of Galactic-disk stars “just visiting”.
So halo CVs are mighty rare. The only other candidate in the solar neighborhood, BF Eri, has an even higher transverse velocity ( 400 km s-1 at the likely 800 pc distance), but presents a puzzle since it shows normal-looking K-star absorption features in the spectrum (Sheets et al., 2007). This could be consistent with a Population II origin, followed by pollution of the secondary’s photosphere by ejecta from the WD or with an ordinary origin, followed by a violent disruption event (perhaps a supernova, or debris pirated from a passing galaxy). However, in the spirit of Ockham’s Razor, the need for such auxiliary hypotheses could also mean that we profoundly misunderstand the true meaning of these high velocities.
10 Summary
-
1.
We report a photometric, astrometric, and spectroscopic study of the peculiar CV SDSS1507, based on 2005-7 data. The star showed deep eclipses recurring with a 66.7 min orbital period – shockingly lower than the famous 77 min “minimum period” for hydrogen-rich CVs.
-
2.
The light curve repeated exactly during each orbit, showing a double-humped wave and quite sharply defined white-dwarf and bright- spot components. We measured all the contact times and used them to construct a photometric model of the system, with details in Section 5 and Table 4. Apart from the strange orbital period, the model resembles a commonplace “WZ Sge” binary, with a 0.83(8) M⊙ white dwarf, a 0.057(8) M⊙ brown-dwarf secondary, and a bright-spot at the periphery of a small disk.
-
3.
The spectroscopy also looks fairly ordinary for an eclipsing low- dwarf nova in quiescence: bright and broad emission lines, with typical He/H line strengths, and accompanied by a strong s-wave which wheels about with a semi-amplitude of 840 30 km s-1. The line wings move with km s-1, and reach maximum recession at . As usual in CVs, these values of and φ disqualify as a diagnostic of actual binary motion.
-
4.
The light curves show obvious short-period pulsations, at frequencies incommensurate with the orbital frequency. Because the signals are fast (500-1200 s) and fairly coherent, and because the white dwarf dominates the light, a white-dwarf origin seems likely. And because they are non-commensurate, a natural explanation is nonradial pulsation. SDSS1507 should be considered a new member of the “GW Lib” class: intrinsically faint CVs with multiperiodic fast signals, probably due to nonradial white-dwarf pulsation. This is the first accurate mass determination for a GW Lib star.
-
5.
The very high proper motion of 160 mas yr-1 suggests a very nearby star. But “white-dwarf parallax” suggests a distance of 202 40 pc; and the trigonometric parallax of 0.7 2.5 mas also rules out a nearby location. Our Bayesian estimate includes both constraints and yields 230 40 pc. This implies a transverse velocity of 164 30 km s-1, a space velocity 167 30 km s-1, and galactic components km s-1. Truly a swift wanderer among the stars.
-
6.
Our binary parameters appear to be in fair agreement with those derived by L07 with a somewhat different method (but also mainly based on the eclipse shape). But we favor a different interpretation: as an “ordinary Population II CV”. This readily accounts for the star’s two great anomalies: the period is shockingly low because Population II secondaries are smaller, and the space velocity is high because that is a characteristic of Population II.
-
7.
Very few Population II CVs have yet been identified outside of globular clusters; among the H-rich stars, only two seem to have acceptable space-velocity credentials. That seems a plausible number, though, because Population II represents 0.5% of all stars in the solar neighborhood, and approximately 500 CVs are eligible by our criteria (known proper motion and distance). The case for SDSS1507 seems particularly good, since the oddly short period confers on its secondary the extra credential of an oddly small radius (“subdwarf”). Searches for metallic lines in the disk, and in the white dwarf, are likely to test these ideas further.
References
- Araujo-Betancor et al. (2003) Araujo-Betancor, S., et al. 2003, ApJ, 583, 437
- Araujo-Betancor et al. (2005) Araujo-Betancor, S., et al. 2005, A&A, 430, 629
- Arras et al. (2006) Arras, P., Townsley, D. M., & Bildsten, L. 2006, ApJ, 643, L119
- Augusteijn et al. (1996) Augusteijn, T., van der Hooft, F., de Jong, J. A., & van Paradijs, J. 1996, A&A, 311, 889
- Baxendell (1902) Baxendell, J. 1902, AJ, 22, 127
- Bessell (1990) Bessell, M. S. 1990, PASP, 102, 1181
- Chanan et al. (1976) Chanan, G. A., Middleditch, J., & Nelson, J. E. 1976, ApJ, 208, 512
- D’Antona (1987) D’Antona, F. 1987, ApJ, 320, 653
- Eggleton (1983) Eggleton, P. P. 1983, ApJ, 268, 368
- Faulkner et al. (1972) Faulkner, J., Flannery, B. P., & Warner, B. 1972, ApJ, 175, L79
- Flannery (1975) Flannery, B. P. 1975, ApJ, 201, 661
- Fontaine et al. (2003) Fontaine, G., Brassard, P., & Charpinet, S. 2003, Ap&SS, 284, 257
- Gianninas et al. (2005) Gianninas, A., Bergeron, P., & Fontaine, G. 2005, ApJ, 631, 1100
- Gilliland et al. (1986) Gilliland, R. L., Kemper, E., & Suntzeff, N. 1986, ApJ, 301, 252
- Gould et al. (1998) Gould, A., Flynn, C., & Bahcall, J. N. 1998, ApJ, 503, 798
- Harrison et al. (2004) Harrison, T. E., Johnson, J. J., McArthur, B. E., Benedict, G. F., Szkody, P., Howell, S. B., & Gelino, D. M. 2004, AJ, 127, 460
- Hessman (1987) Hessman, F. V. 1987, Ap&SS, 130, 351
- Horne (1986) Horne, K. 1986, PASP, 98, 609
- Kepler (1619) Kepler, J. 1619, Harmonices Mundi, tr. J. Field (1997); American Philosophical Society
- King et al. (2002) King, A. R., Schenker, K., & Hameury, J. M. 2002, MNRAS, 335, 513
- Knigge (2006) Knigge, C. 2006, MNRAS, 373, 484
- Landolt (1992) Landolt, A. U. 1992, AJ, 104, 340
- Littlefair et al. (2007) Littlefair, S. P., Dhillon, V. S., Marsh, T. R., Gänsicke, B. T., Baraffe, I., & Watson, C. A. 2007, MNRAS, 381, 827 (L07)
- Mukadam et al. (2007) Mukadam, A. S., Gänsicke, B. T., Szkody, P., Aungwerojwit, A., Howell, S. B., Fraser, O. J., & Silvestri, N. M. 2007, ApJ, 667, 433
- Nauenberg (1972) Nauenberg, M. 1972, ApJ, 175, 417
- Neill et al. (2002) Neill, J. D., Shara, M. M., Caulet, A., & Buckley, D. A. H. 2002, AJ, 123, 3298
- Nelemans et al. (2001) Nelemans, G., Portegies Zwart, S. F., Verbunt, F., & Yungelson, L. R. 2001, A&A, 368, 939
- Ockham (1330) Ockham, W. of 1330, De Sacramento Altaris, tr. by Birch, T.B. (Burlington, Iowa: Iowa Lutheran Literary Board)
- Patterson (1984) Patterson, J. 1984, ApJS, 54, 443
- Patterson (1998) Patterson, J. 1998, PASP, 110, 1132
- Patterson (2001) Patterson, J. 2001, PASP, 113, 736
- Patterson et al. (2005) Patterson, J., Thorstensen, J. R., & Kemp, J. 2005, PASP, 117, 427
- Patterson et al. (2005) Patterson, J., et al. 2005, PASP, 117, 1204
- Politano (2004) Politano, M. 2004, ApJ, 604, 817
- Schneider & Young (1980) Schneider, D. P., & Young, P. 1980, ApJ, 238, 946
- Shafter (1983) Shafter, A. W. 1983, ApJ, 267, 222
- Sheets et al. (2007) Sheets, H. A., Thorstensen, J. R., Peters, C. J., Kapusta, A. B., & Taylor, C. J. 2007, PASP, 119, 494
- Skidmore et al. (2000) Skidmore, W., Mason, E., Howell, S. B., Ciardi, D. R., Littlefair, S., & Dhillon, V. S. 2000, MNRAS, 318, 429
- Skillman et al. (2002) Skillman, D. R., et al. 2002, PASP, 114, 630
- Spruit & Rutten (1998) Spruit, H. C., & Rutten, R. G. M. 1998, MNRAS, 299, 768
- Steeghs et al. (2007) Steeghs, D., Howell, S. B., Knigge, C., Gänsicke, B. T., Sion, E. M., & Welsh, W. F. 2007, ApJ, 667, 442
- Stover (1981) Stover, R. J. 1981, ApJ, 249, 673
- Stehle et al. (1997) Stehle, R., Kolb, U., & Ritter, H. 1997, A&A, 320, 136
- Szkody et al. (2002) Szkody, P., Gänsicke, B. T., Howell, S. B., & Sion, E. M. 2002, ApJ, 575, L79
- Szkody et al. (2005) Szkody, P., et al. 2005, AJ, 129, 2386
- Szkody et al. (2007) Szkody, P., et al. 2007, ApJ, 658, 1188
- Taylor et al. (1999) Taylor, C. J., Thorstensen, J. R., & Patterson, J. 1999, PASP, 111, 184
- Thorstensen (2003) Thorstensen, J. R. 2003, AJ, 126, 3017
- Thorstensen et al. (1991) Thorstensen, J. R., Ringwald, F. A., Wade, R. A., Schmidt, G. D., & Norsworthy, J. E. 1991, AJ, 102, 272
- Thorstensen et al. (2002) Thorstensen, J. R., Fenton, W. H., Patterson, J. O., Kemp, J., Krajci, T., & Baraffe, I. 2002, ApJ, 567, L49
- Warner (1995) Warner, B. 1995, Cambridge Astrophysics Series, Cambridge, New York: Cambridge University Press, —c1995
- Wood et al. (1989) Wood, J. H., Horne, K., Berriman, G., & Wade, R. A. 1989, ApJ, 341, 974
- Zacharias et al. (2004) Zacharias, N., Urban, S. E., Zacharias, M. I., Wycoff, G. L., Hall, D. M., Monet, D. G., & Rafferty, T. J. 2004, AJ, 127, 3043


| UT Date | HAstart | HAend | aaParallax factors and are the parallax displacements that a star at 1 pc distance would undergo on that date, in (eastward) and (northward). | ||
|---|---|---|---|---|---|
| [hh:mm] | [hh:mm] | ||||
| 2005 Jun 25 | 12 | 0:26 | 0:53 | ||
| 2006 Mar 13 | 5 | 0:18 | 0:36 | ||
| 2006 May 20 | 14 | 0:56 | 2:24 | ||
| 2006 Jun 10 | 9 | 0:08 | 0:23 | ||
| 2006 Aug 29 | 4 | 2:59 | 3:13 | ||
| 2007 Jan 28 | 8 | 1:00 | 0:36 | ||
| 2007 Mar 25 | 10 | 0:22 | 0:18 | ||
| 2007 Jun 21 | 8 | 0:02 | 0:38 |
| E.W.aaEmission equivalent widths are counted as positive. No attempt has been made to measure the absorption around H, or to correct the H equivalent width for the underlying absorption. | Flux | FWHM | |
|---|---|---|---|
| Feature | (Å) | (10-17 erg cm-2 s-1) | (Å) |
| H | 25 | 9 | 40 |
| HeI | 9 | 8: | 49 |
| H | 87 | 15 | 51 |
| HeI | 12 | 1.5 |
| 498.89228 | 498.93851 | 498.98475 |
| 502.68543 | 502.73171 | 502.77795 |
| 502.82422 | 502.87048 | 502.91672 |
| 502.96301 | 503.84190 | 503.88814 |
| 503.93441 | 504.85958 | 504.90583 |
| 504.95209 | 527.66492 | 527.71120 |
| 527.75746 | 527.80373 | 527.84998 |
| 527.89624 | 533.67855 | 533.72482 |
| 533.77104 | 534.69620 | 534.74245 |
| 534.78871 | 534.83504 | 878.81200 |
| 878.85828 | 878.90452 | 878.95079 |
| 879.78347 | 879.87593 | 879.92224 |
| 879.96851 | 880.70860 | 880.75486 |
| 880.80111 | 880.84740 | 880.89360 |
| 881.68008 | 881.72630 | 881.77258 |
| 881.81879 | 885.84327 | 885.88953 |
| 885.93583 | 1271.86909 | 1271.91539 |
| 1272.84055 | 1272.88679 | 1273.81198 |
| 1273.85826 |
Note. — Times listed are the HJD of mid-eclipse, minus 2453000.
| Quantity | ValueaaUncertainties in the last digit(s) are given in parentheses. |
|---|---|
| Inclination | 83.18(13) deg |
| Mass ratio | 0.069(2) |
| 0.83(8) M⊙ | |
| 0.057(8) M⊙ | |
| 0.0097(9) R⊙ | |
| 0.097(4) R⊙ | |
| 11500(700) K | |
| 0.320(5) | |
| Distance | 230(40) pc |