A Global 86 GHz VLBI Survey of Compact Radio Sources
Abstract
We present results from a large 86 GHz global VLBI survey of compact radio sources. The main goal of the survey is to increase by factors of 3–5 the total number of objects accessible for future 3-mm VLBI imaging. The survey observations reach the baseline sensitivity of 0.1 Jy and image sensitivity of better than 10 mJy/beam. The total of 127 compact radio sources have been observed. The observations have yielded images for 109 sources, extending the database of the sources imaged at 86 GHz with VLBI observation by a factor of 5, and only 6 sources have not been detected. The remaining 12 objects have been detected but could not be imaged due to insufficient closure phase information. Radio galaxies are less compact than quasars and BL Lacs on sub-milliarcsecond scale. Flux densities and sizes of core and jet components of all imaged sources have been estimated using Gaussian model fitting. From these measurements, brightness temperatures have been calculated, taking into account resolution limits of the data. The cores of 70% of the imaged sources are resolved. The core brightness temperatures of the sources peak at K and only 1% have brightness temperatures higher than K. Cores of Intraday Variable (IDV) sources are smaller in angular size than non-IDV sources, and so yield higher brightness temperatures.
1 Introduction
Very long baseline interferometry (VLBI) at millimeter wavelengths offers the best tool for imaging compact radio structures on scales of several dozens of microarcseconds. The first detection of single-baseline interference fringes in an 89 GHz (3.4 mm) VLBI observation was reported by Readhead et al. (1983), demonstrating the feasibility of 3 mm-VLBI. After that, many VLBI observations at 86 GHz have been made, probing the most compact regions in active galactic nuclei (AGN). However, the number of objects detected and imaged at 86 GHz remained small, compared with the number of objects imaged with VLBI at lower frequencies.
Sensitive VLBI observations at 86 GHz have been made for several sources, including 3C 111 (Doeleman & Claussen, 1997), 3C 454.3 (Krichbaum et al., 1995, 1999; Pagels et al., 2004), NRAO 150 (Agudo et al., 2007), NRAO 530 (Bower et al., 1997), M87 (Krichbaum et al., 2006), 3C 273 and 3C 279 (Attridge, 2001). In order to increase the number of objects imaged at 86 GHz, four detection and imaging surveys were conducted during the 1990s, with a total of 124 extragalactic radio sources observed (see Beasley et al., 1997; Lonsdale et al., 1998; Rantakyro et al., 1998; Lobanov et al., 2000). In these surveys, fringes were detected of 44 objects, but only 24 radio sources have been successfully imaged. Table 1 gives an overview of these surveys. The low detection and imaging rates of the previous 86 GHz surveys were caused by the relatively poor baseline sensitivities, small numbers of telescopes and short observing times.
The results of the survey of a larger number of sources can be used to investigate the innermost region of compact jets and to observationally test inner jet models (Marscher, 1995): accelerating and decelerating jet models. In the accelerating jet model, the jet accelerates hydrodynamically from the base of the jet, and as the internal energy of the jet plasma is converted into the kinetic energy of bulk flow, the jet Lorentz factor increases along the jet. In this model, an ultra relativistic neutral beam is generated from the central engine and then the neutrons decay into protons and electrons which form a relativistically flowing plasma. In the decelerating jet model, the central engine produces a highly collimated beam of ultra relativistic electron-positron pair plasma that scatters photons produced outside the jet (particle cascade). The scattered photons emit X-rays and -rays, which decelerates the beam and so decreases the Lorentz factor along the jet.
The theoretical prediction from the jet models leads to the fact that the intensity profiles along the jet are different from each other and have a distinctive shape in each of these model. The resulting brightness temperature can be used to probe the difference. The intrinsic brightness temperature of a distribution of observed brightness temperatures can be determined from a statistical modeling (Lobanov et al., 2000). By estimating the brightness temperature at several frequencies (e.g., 15 GHz, 43 GHz, and 86 GHz) and determining the intrinsic brightness temperatures, we would be able to constrain the physical conditions (e.g., dynamics and compositions) of the innermost region of the compact sources. Moreover the dependence of the intrinsic brightness temperatures on the observing frequencies will tell about the feasibility of VLBI at higher frequencies (e.g., 150 GHz, 215 GHz, etc).
A large global 86 GHz VLBI survey of compact radio sources was carried out from 2001 October to 2002 October using the Coordinated Millimeter VLBI Array (CMVA) (Rogers et al., 1995), which is succeeded by the Global Millimeter VLBI Array (GMVA)111See http://www.mpifr-bonn.mpg.de/div/vlbi/globalmm/index.html.. The main aim of this VLBI survey is to increase the total number of objects accessible for future 3 mm-VLBI imaging by factors of 3–5, and to provide the database for the subsequent statistical modeling in order to test the inner jet models.
2 Observation
2.1 Source Selection
The source selection of this survey is based on the results from the VLBI surveys at 22 GHz (Moellenbrock et al., 1996) and 15 GHz (Kellermann et al., 1998), and on flux density measurements from the multi-frequency monitoring programs at Metsähovi at 22, 37, and 86 GHz (Teraesranta et al., 1998) and at Pico Veleta at 90, 150, and 230 GHz (Ungerechts, priv. comm.). Using these databases, we selected the sources with an expected flux density above 0.3 Jy at 86 GHz. We excluded some of the brightest sources already imaged at 86 GHz, and focused on those sources which had not been detected or imaged in the previous surveys. Objects in the southern sky with low declinations () were rejected, in order to optimize the uv-coverage of the survey data.
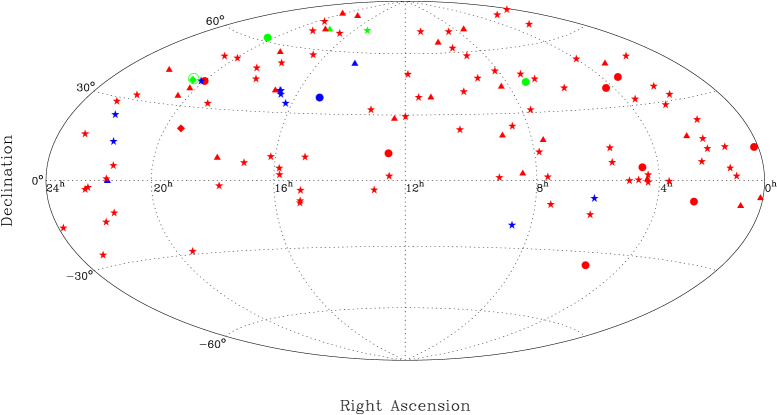
According to the aforementioned selection criteria, a total of 127 compact radio sources was selected and observed, consisting of 88 quasars, 25 BL Lac objects, 11 radio galaxies, 1 star (Cyg X-3), and 2 unidentified sources. Table 2 lists the general information of the observed sources, with the columns corresponding to (1) source, (2) name, (3) epoch, (4) Right Ascension (J2000), (5) Declination (J2000), (6) status, (7) redshift, (8) optical class, (9) optical magnitude, and (10) total flux density . In Figure 1, the sky-distribution of the observed sources is shown.
2.2 Observational Strategy
The survey observations were conducted during three sessions of the Co-ordinated (global) millimeter VLBI array (CMVA/GMVA) on 2001 October, 2002 April and 2002 October, as summarized in Table 3. Table 3 shows the log of the survey observations, with the columns corresponding to (1) epoch, (2) code of each epoch, (3) bit rate, (4) frequency channels, (5) sampling mode, (6) total observing bandwidth, (7) number of sources, and (8) participating telescopes.
Table 4 lists the technical information of the participating telescopes, with the columns for (1) name, (2) abbreviation of the telescope name, (3) diameter, (4) typical zenith gain, (5) system temperature, (6) aperture efficiency, (7) typical zenith SEFD obtained from the formula, , (8) baseline sensitivity on baseline to Pico Veleta, assuming a recording rate 256 Mbps and a fringe-fit interval of 30 seconds, and (9) detection threshold. The participation of the large and sensitive European antennas (the 100-m radio telescope at Effelsberg, the 30-m radio telescope at Pico Veleta, the 615-m interferometer telescopes on Plateau de Bure) and the 8 VLBA111The Very Long Baseline Array (VLBA) is an instrument of the National Radio Astronomy Observatory, which is a facility of the National Science Foundation operated under cooperative agreement by Associated Universities, Inc. antennas available at 86 GHz resulted in a typical single baseline sensitivity of Jy and an image sensitivity of better than 10 mJy .
Every source in the sample was observed for 3-4 scans of 7-minute duration (snapshot mode). Although the uv-coverage of such an experiment limits the dynamic range and structural sensitivity of images, the large number of the participating antennas gives a sufficient uv-coverage of the sources at low and high declinations (Figure 2). The data were recorded either with 128-MHz or 64-MHz bandwidth using the MkIV VLBI system with 1- and 2- bit sampling adopted at different epochs. The observations were made in lefthand circular polarization (LCP). Three to four scans per hour were recorded, using the time between the scans for antenna focusing, pointing and calibration. The data were correlated using the MkIV correlator of the Max-Planck-Institut für Radioastronomie (MPIfR) in Bonn (Alef & Müskens, 2001).
3 Data Processing
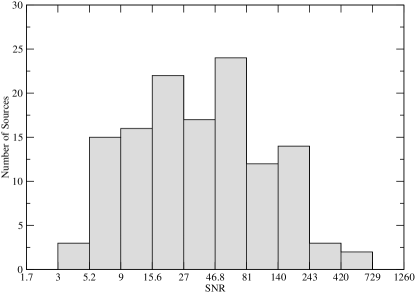
In this section, we describe the post-correlation processing of the 3 mm-VLBI survey datasets. Fringes were searched in two steps using HOPS (Haystack Observatory Postprocessing System) and AIPS (The NRAO Astronomical Image Processing System). In the first step, the HOPS task fourfit was used to precisely determine phase-residuals. The first fourfit was run with a wide search window (e.g. a width of 1 sec for singleband delay, 2 sec for multiband delay and 500 psec for delay rate) centered at zero in delay. Since the fourfit produces baseline-based fringe solutions, the mean and standard deviation of the detected fringe solutions on each baseline were estimated and served as the offset and width of the search window for the second fourfit. The detected fringe solutions from the second run were used to interpolate the offset of the singleband delay for non-detected scans. In the final run of fourfit, an interpolated search window was used with a width of 0.02 sec for the singleband delay and centered at the offset interpolated for each non-detected scan. After this first step of the fringe search, the total number of fringe detections for the survey data was improved by up to 20%. In the second step of the fringe search, the baseline-based fringe solutions were imported into AIPS using a modified AIPS task MK4IN (Alef & Graham, 2002). We then made an antenna-based fringe fit to the data using the AIPS task FRING. Pico Veleta (PV) was chosen as reference antenna for most of the data. When PV was not available, Fort Davis (Fd) was selected as an alternative reference antenna. The antenna-based fringe fitting was done with the solution interval of 7 minutes in order to achieve higher signal-to-noise ratio. Fringe solutions for strong sources were used to define coarse search windows for the fringe solutions for nearby weaker sources. With the fringe fit of fourfit and FRING, 121 out of 127 observed sources have yielded fringe detections with SNR. Figure 3 shows the SNR distribution of the fringe detection in the entire survey data. Only 6 sources (0710+439, 1458+718 (3C 309.1), 1749+701 (4C 09.57), 2021+614, 2030+407 (Cyg X-3), and 2031+405 (MWC 349)) are not detected. The highest SNRs of 425 is measured on the “Pico Veleta–Plateau de Bure” baseline for 1741-038 and the “Effelsberg-Pico Veleta” baseline for 1633+382.
The fringe fitted data were amplitude calibrated using regular measurements of the system temperatures and antenna gains and the weather information for each station made during the observations. Where possible, time-dependent factors in the antenna power gains were accounted for by applying atmospheric opacity corrections. The AIPS task APCAL was used to calibrate the amplitudes. As a check of the accuracy and consistency of the amplitude calibration, we have investigated (independently for each of the detected sources) the calibrated visibility amplitudes using the best fit Gaussian component models obtained from the data (the corresponding models are given in Table 7). For each of the sources, the antenna gains were allowed to be scaled by a constant factor so as to optimize the fit by the Gaussian model.
The obtained corrections are within 20% for most of sources, which is also reflected in the average correction factors listed in Table 5. On average, the gain factors for Pico Veleta, Onsala, North Liberty, Owens Valley, and Los Alamos remained within 10% in all three observing sessions. The average gains for Effelsberg did not change much except for the session C. Fort Davis and Mauna Kea required average corrections by more than 20%. Time-dependent errors may still be present in the calibrated data. Therefore we expect overall calibration accuracy of 20–30%
From the phase- and amplitude-calibrated data, the images were made using the Caltech DIFMAP software (Shepherd et al., 1994). After averaging in frequency, the uv-data were averaged in time over 30 seconds and were edited for deviant data points.
The uv-data were then fitted with a simple Gaussian model. First, a single circular Gaussian component was applied to fit the data. In case that the single-component model did not represent the data satisfactorily, a multiple-component model was applied. Self-calibration and CLEAN deconvolution were applied to produce final images of the detected sources.
The noise in the final image can be expressed quantitatively by the quality of the residual noise. Suppose that a residual image has an rms and the maximum absolute flux density . For Gaussian noise with a zero mean, the expectation of is
| (1) |
where is the total number of pixels in the image. The quality of the residual noise is given by
| (2) |
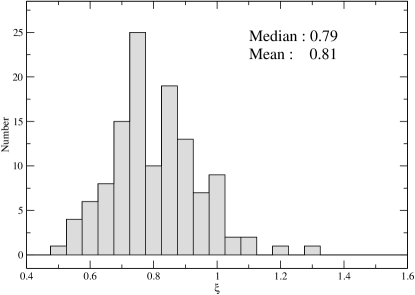
When the residual noise approaches Gaussian noise, . If , not all the structure has been adequately recovered; if , the image model has an excessively large number of degrees of freedom (Lobanov et al., 2006). The values of of the images in the survey are presented in Column (14) of Table 6 and the distribution of them is shown in Figure 4, implying that the images adequately represent the structure detected in the visibility data.
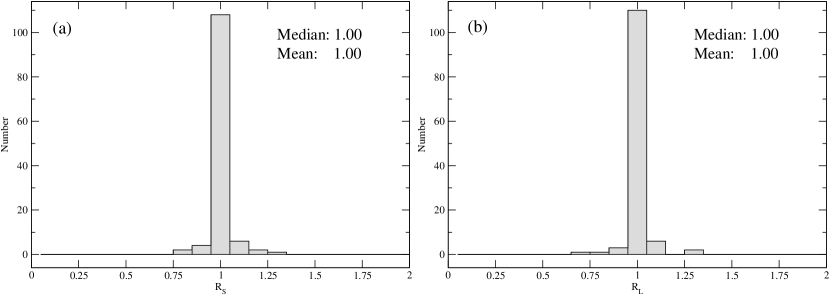
The initial CLEAN cycles for the region around the core component are conducted with using natural weighting and without using uv-tapering. Once the CLEAN models satisfactorily fit the visibility at the longest baselines, uv-tapering was applied to the data on long baselines in order to recover faint emission further out from the core component. We did not modify the visibility amplitudes, except for introducing an overall, time-constant gain correction factor wherever it was required for improving the agreement between the CLEAN model and the data. In addition to the check for the antenna gain corrections described above, we investigated the changes of the visibility amplitudes with and without introducing the time-constant gain correction factor, by using the correlated flux densities , , at the shortest and longest baselines , , (presented in Columns 4–7 in Table 6), for each of the sources. The correlated flux densities obtained after introducing the antenna gain corrections are compared with the flux densities and before the gain corrections. As shown in Figure 5 for the distributions of the ratios and , the visibility amplitudes on the shortest and longest baselines for each of the sources were not changed for most of the sources during the hybrid imaging. For a small number of peculiar sources, the ratios of the visibility amplitudes fall within a range of 0.75–1.25. This analysis shows again that the amplitude calibration error of this survey observations is 20%–30%.
We introduce a zero-baseline flux to recover a faint structure in the extended region by adding a fake visibility at the point of origin in the Fourier plane (uv-plane). Since the shortest baseline of this survey observations is about 50–100 M, this may result in the faint structures of the extended regions appearing to be negative because the flux in every pixel of the map is offset by a small negative amount. The effect may be countered to some extent by adding the fake visibility at the origin of the uv-plane. The measured total flux density of each source (listed Column 3 in Table 6) is used as the zero-baseline flux.
4 Estimating Parameters
In order to extract quantitative information from the images, circular Gaussian-component models were used to fit the self-calibrated uv-data yielding the following parameters: total and peak flux densities, positions, and sizes of each component. Uncertainties of the models were estimated, based on the signal-to-noise ratio (SNR) of detection of a given model fit component, using an analytical (first order) approximation (Fomalont, 1999). The general fit parameters of a component in VLBI images of radio sources are - total flux density, - peak flux density, - post-fit rms, - size, - radial distance (for jet components), - position angle (measured for jet components, with respect to the location of the core component). The uncertainties of the fit parameters can be estimated by adopting approximations given by Fomalont (1999):
| (3) |
| (4) |
where , , , , and are the uncertainties of total flux density, peak flux density, post-fit rms, size, and radial distance of a component, respectively. When the size, , of a component was determined, the resolution limits (Lobanov, 2005) should be taken into account. So, the minimum resolvable size of a component in an image is given by
| (5) |
where a and b are the axes of the restoring beam, SNR is the signal-to-noise ratio, and is the weighting function, which is 0 for natural weighting or 2 for uniform weighting. When , the uncertainties should be estimated with .
We use the results of the model fitting to estimate brightness temperatures of the core and jet components. The rest frame brightness temperature of the emission region represented by a Gaussian component is
| (6) |
where is the wavelength of observation, is the redshift, and is the Boltzmann constant. Practically, the brightness temperature can be calculated by simplifying (6):
| (7) |
where the total flux density is measured in Jy, the size of the circular Gaussian component in mas, and the observing frequency in GHz. If , then the lower limit of is obtained with .
5 Results
Out of 127 sources, 109 sources have been imaged and model fitted. The first 3 mm-VLBI maps for 90 sources were made in this survey, increasing the number of sources ever imaged with 3 mm-VLBI observations up to 110.
In Figure 6, we present two plots and one contour map for each source at each epoch. In the left panel, the plot of the visibility amplitudes against uv-radius is shown. The corresponding uv-sampling distribution is given in the inset. The X-axis of the plot of the visibility amplitude represents the uv-radius which is the length of the baseline used to obtain the corresponding visibility point. The uv-radius is given in the units of , where is the observing wavelength. The Y-axis of the plot shows the amplitude of each visibility point (i.e., correlated flux density) in units of Jy. The uv-sampling distribution in the inset of the left panel describes the overall distribution of the visibility in the uv-plane, whose maximum scale equals that of the uv-radius. In the right panel, the contour map of each source is shown, with the X- and Y-axis in the units of milliarcsecond. For each source, the source name and the observation data are given in the upper left corner of the map. The lowest contour level is identified in the lower right corner of the map. The shaded ellipse represents the FWHM of the restoring beam in the image. In all of the images, the contours have a logarithmic spacing and they are drawn at -1, 1, 1.4,…, of the lowest flux density level. For 12 sources (0133+476, 0149+218, 0212+735, 0234+285, 0238-084, 0316+413, 0355+508, 0415+379, 0430+052, 0716+714, 1928+738, and 2255-282), multi-epoch images are presented. Most sources are centered on the brightest component (VLBI core), but for some sources with a larger structure, we have shifted the center to fit the image in the box.
In Table 6, parameters of the images presented in Figure 6 are summarized. For each image, Table 6 lists the source name, the observing epoch, the total flux density, , obtained from pointing and calibration measurements made at Pico Veleta during the observation, the correlated flux densities, , measured on the shortest and longest baselines, , the parameters of the restoring beam (the size of the major axis, and the minor axis, , and the position angle of the beam, ), the total flux, , the peak flux density, , the off-source RMS, , and the quality of the residual noise in the image.
Table 7 lists the parameters of each model-fit component: the total flux, , peak flux density, , size, , radius, (only for jet components), position angle, (the location of the jet component with respect to the core component), and measured brightness temperature, . For sources with multiple components, parameters of the core component are followed by those of jet components. For sources observed at multiple epochs, individual epochs are marked. The estimated uncertainties are given next to each parameter. The upper limits of size, , and the lower limits of brightness temperature, , are in italic with brackets.
6 Discussion
6.1 Source compactness
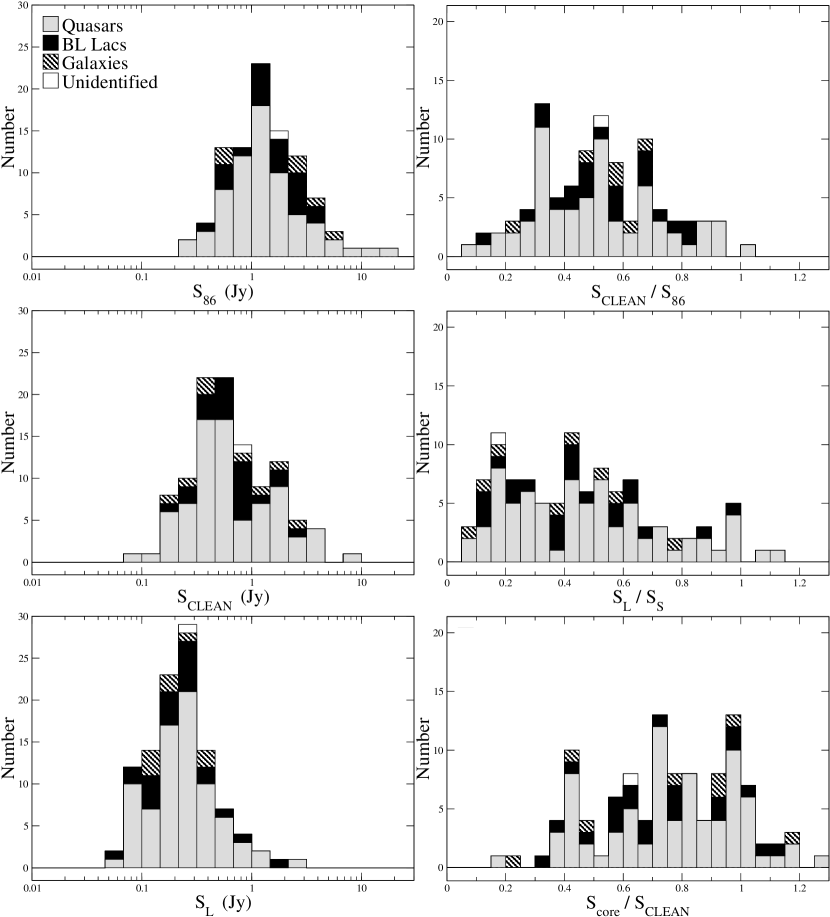
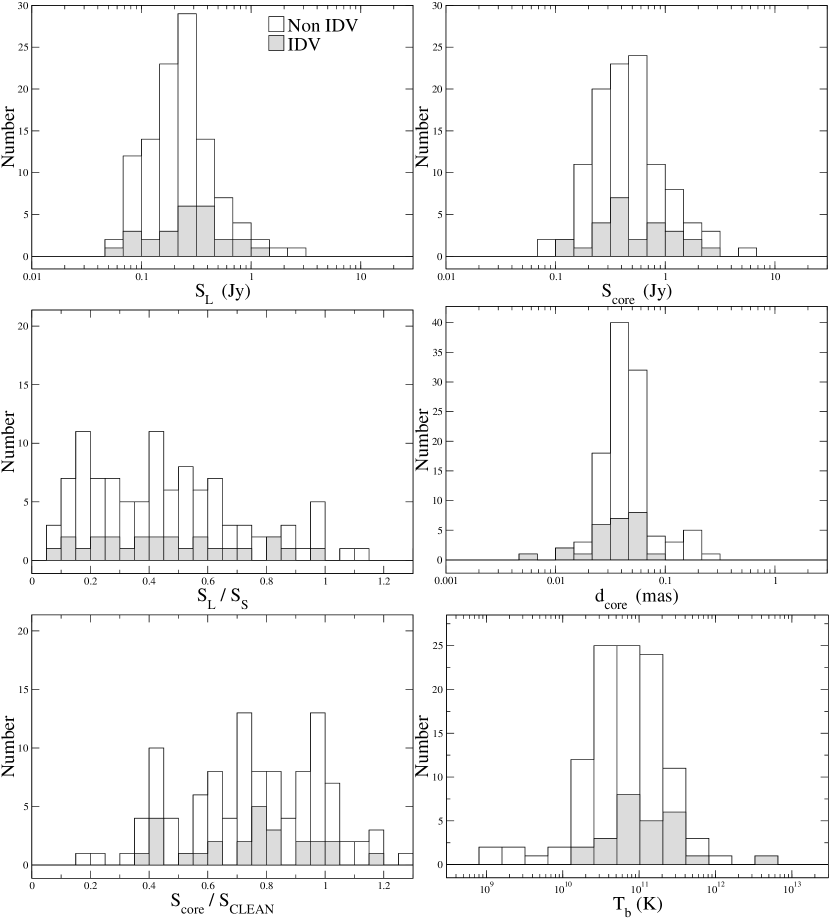
For all imaged sources, we discuss the source compactness, showing the distributions of the total flux density , the CLEAN flux density , and the correlated flux densities measured on the shortest and longest baselines, listed in Table 6. In Figure 7, we present the distributions of the flux densities and source compactness. The distribution of the total flux density (top left panel) peaks at 1.3 Jy, and shows that almost all sources are brighter than 0.3 Jy, which corresponds to the flux limit of our source selection. The median value of the CLEAN flux density (middle left panel) is 0.6 Jy and the peak of the distribution is around 0.5 Jy, indicating that much of the emission at 86 GHz from the compact radio sources is resolved out at milliarcsecond scales. The source compactness on milliarcsecond scales is also shown in Figure 7 (top right panel). The median compactness on milliarcsecond scales of our sample is 0.51.
While the median correlated flux density at the longest baseline is 0.22 Jy (bottom left panel), quite a few sources have considerable flux at long baselines (e.g., Pico Veleta and Kitt Peak). Among 95 sources whose correlated flux density can be measured at projected baselines longer than 2000 M, 82 sources have a correlated flux density greater than 0.1 Jy. From the distribution of the source compactness on sub-milliarcsecond scales (middle right panel) we can see that most of the imaged sources are resolved. A few sources have a slightly greater flux density on the longest baseline than on the shortest baseline, since they are very compact and faint, giving a large scatter of visibility points on the long baselines. Although most of the imaged sources are resolved, they are highly core-dominated in flux (bottom right panel). Some of the extremely compact sources have the core dominance index larger than unity due to the uncertainty of the model fit and CLEAN flux.
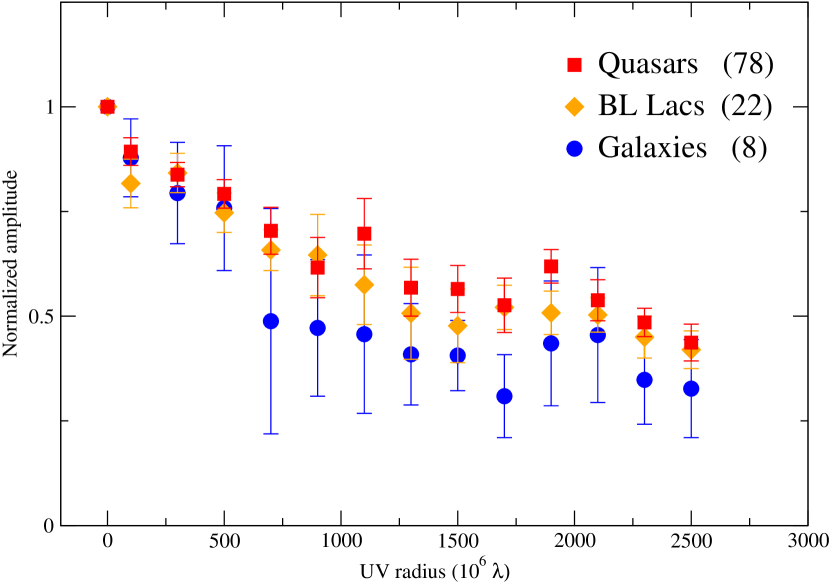
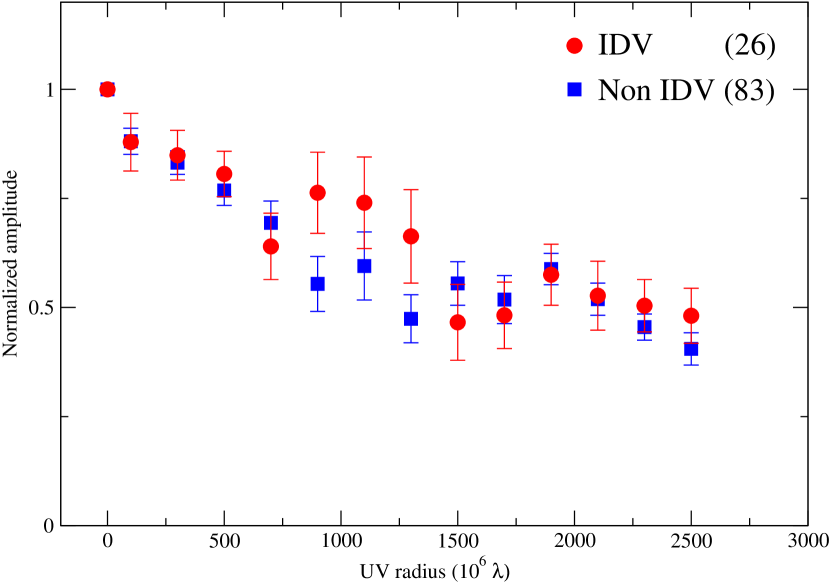
The overall sample of imaged sources consist of 78 quasars, 22 BL Lac objects, and 8 radio galaxies. Despite the significant difference in the number of sources between the optical classes, the dependence of sub-milliarcsecond scale compactness on the optical class is apparent in the distribution. Quasars and BL Lacs have similar distributions (the average is 0.54 for quasars and 0.48 for BL Lacs, and the median is 0.48 for quasars and 0.42 for BL Lacs), and radio galaxies have a relatively different distribution (the average is 0.38 and the median is 0.41). The dependence is also evident in Figure 8, which shows the normalized mean visibility function in terms of uv-radius, averaged for Quasars, BL Lacs, and radio galaxies. The normalized mean visibility amplitudes for radio galaxies are, on average, lower than those for quasars and BL Lacs. At long uv-radii ranging from 700 M to 2500 M, the amplitudes for the radio galaxies are quite distinct from those of the quasars and BL Lac objects in the sample. Overall, the radio galaxies are less compact than the others, but BL Lacs and quasars are similar in compactness. According to the unification paradigm of AGN (Urry & Padovani, 1995), it is expected that quasars and BL Lacs on sub-milliarcsecond scales are still more compact than radio galaxies since the former are seen at smaller viewing angle and brightened by Doppler boosting. Our results from the 86 GHz VLBI survey are consistent with this.
6.2 Brightness temperature
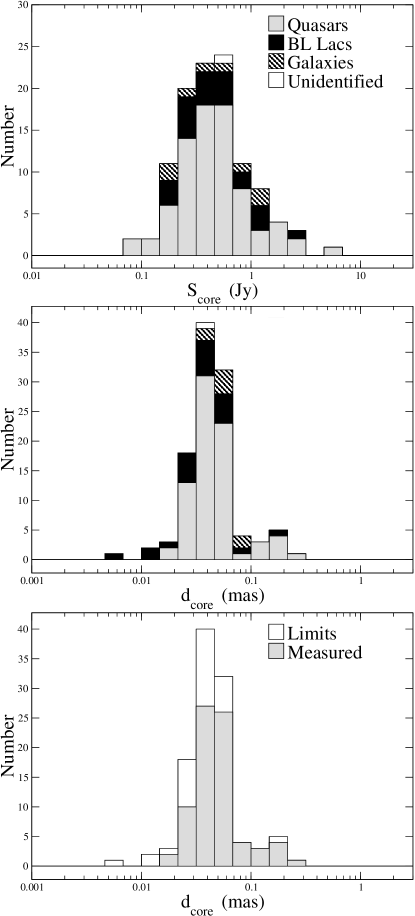
Figure 9 shows the distributions of flux density and angular size for the core components. Most of the cores are smaller than 0.1 mas in angular size. The cores of 77 sources are resolved and 32 sources have unresolved core components. Most of the unresolved sources are quasars (23), and a few sources are BL Lacs (7) and radio galaxies (2).
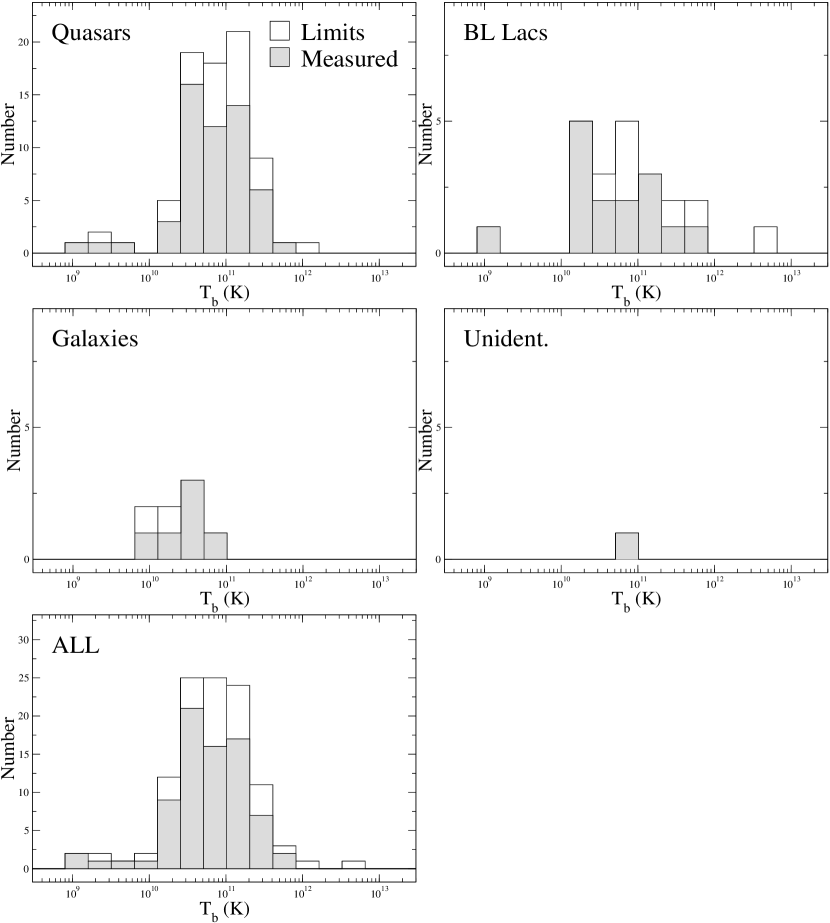
Figure 10 shows the distributions of the measured core brightness temperatures in the source frame. The median value of these brightness temperatures is K. The tail of the distribution extends up to K. Only about 1 % of the imaged sources yield brightness temperatures greater than K, which is the maximum value of the inverse Compton limit (Kellermann & Pauliny-Toth, 1969), and about 8 % have brightness temperatures higher than K, which corresponds to the equipartition limit (Readhead, 1994). This distribution shows brightness temperatures lower by a factor of 10 than those derived from the VSOP survey at 5 GHz (see Horiuchi et al., 2004) and VLBA 2 cm Survey (see Kovalev et al., 2005). Higher brightness temperatures of compact radio sources can be explained by Doppler boosting, transient non-equilibrium events, coherent emission, emission by relativistic protons, or a combination of these effects (see Kardashev, 2000; Kellermann et al., 2003). Such a substantial decrease in the brightness temperatures measured at 86 GHz may be caused by two reasons. Most of the extragalactic radio sources may be resolved at 86 GHz, as indicated by the compactness index derived in this paper. Alternatively, opacity and other physical conditions can change along the jet, causing observations at 86 GHz to probe regions of the flow in which the brightness temperature is intrinsically lower (due to gradients in the physical conditions in the flows, see e.g., Marscher, 1995). Both these possibilities will be investigated in a follow-up paper.
6.3 Intraday variable sources
In order to identify intraday variable (IDV) sources in our sample, we used the list of IDV sources compiled in Kovalev et al. (2005, see references therein). Clear identifications can be made for most of the objects except 6 sources: 1044+719, 1150+497, 1842+681, 1923+210, 2013+370, and 2023+336. From the references given in Kovalev et al. (2005), we identify them as “non-IDV” sources. In total, 26 sources are identified as “IDV” sources in our sample.
Figure 11 shows the distributions of the correlated flux density at the longest baseline (top left panel), and the core flux density (top right panel), as well as the distributions of the size (middle right panel) and brightness temperature (bottom right panel) of the cores. The source compactness on sub-milliarcsecond scales (middle left panel) and the core dominance (bottom left panel ) are also compared for the IDV and non-IDV sources. The statistics of the distributions are summarized in Table 8.
The IDV and non-IDV sources have different mean values (0.36 Jy and 0.31 Jy) median values (0.26 Jy and 0.21 Jy) of the correlated flux densities at the longest baselines, . The Kolmogorov-Smirnov (K-S) test shows that there is a 17% chance that the IDV and non-IDV samples are derived from a common distribution. This is a somewhat inconclusive result due to a few points at higher flux densities in the non-IDV sample, which affects strongly the statistical results. If we exclude those outliers, then the mean of the non-IDV sample gets smaller than that of the IDV sample and the probability decreases to 15%. However, it is difficult to conclude that IDV sources have a higher flux density than non-IDV sources in our sample.
The distributions of the compactness index for IDV and non-IDV sources have means of 0.53 and 0.51 with medians of 0.46 and 0.44. The K-S test shows that a common parent distribution for IDV and non-IDV sources is acceptable at a 100% level. In Figure 12, it is shown that the sub-milliarcsecond compactness for the IDV sources is, on average, similar to the non-IDV sources.
For the core dominance , the K-S test implies a single parent population for IDV and non-IDV sources with the K-S probability at a 80% level. We conclude therefore that IDV sources are similar to non-IDV sources in core-dominance.
We find different results for the core parameters such as the core flux density, the core size, and the core brightness temperature of IDV and non-IDV sources. The distributions of the core flux density for IDV and non-IDV sources have means of 0.70 Jy and 0.62 Jy, with medians of 0.42 Jy and 0.46 Jy. They have a 34% probability of being derived from a common population. This is quite distinctive from the results for the other parameters. The distributions of the core sizes for IDV and non-IDV sources have means of 0.039 mas and 0.057 mas with medians of 0.035 mas and 0.043 mas. The cores of IDV sources are smaller in angular size than those of non-IDV sources. The K-S test also yields a probability of less than 4% that the core size has the same parent distribution for IDV and non-IDV sources. The mean values of the core brightness temperature for IDV and non-IDV sources are K and K, and the respective median values are K and K, respectively. A common parent population of the core brightness temperature for IDV and non-IDV sources is rejected at the 92% level. This implies that, although IDV sources have similar core flux densities to those of non-IDV sources, their brightness temperatures are higher than those of the non-IDV sources due to the smaller angular core size.
7 Summary
We have conducted the largest global 86 GHz VLBI survey of compact radio sources during three GMVA sessions in 2001 October, 2002 April, and 2002 October. Participation of sensitive European telescopes augmented by the VLBA antennas ensured high baseline and image sensitivities. The total of 121 out of 127 sources observed have been detected at least on one baseline and 109 sources have been imaged with a typical dynamic range exceeding 50. The survey observations have resulted in an increase by a factor of five of the total number of sources imaged at 86 GHz with VLBI.
We have used two-dimensional, circular Gaussian components to fit the observed visibilities and parameterize the source structure. Using the results of these fits, the source compactness and brightness temperatures have been derived.
We find that almost all of the survey objects are resolved and the cores of about 70% of the imaged sources are resolved. Radio galaxies are less compact than quasars and BL Lacs. BL Lacs are similar to quasars in the compactness at sub-milliarcsecond scales.
The distribution of the core brightness temperatures peaks at K and only 1% of the cores have brightness temperatures higher than K. This shows apparently lower brightness temperatures than those derived from other VLBI surveys at lower frequencies (e.g., 5 GHz and 15 GHz).
IDV sources in our sample are similar to non-IDV sources in compactness at sub-milliarcseconds. The cores of IDV sources are smaller in angular size and so yield a higher brightness temperature than non-IDV sources, since the core flux densities of both samples are similar to each other.
References
- Agudo et al. (2007) Agudo, I., et al. 2007, Exploring the Cosmic Frontier, ESO Astrophysics Symposia European Southern Observatory, Volume . ISBN 978-3-540-39755-7. Springer, 2007, p. 179, 179
- Alef & Graham (2002) Alef, W., & Graham, D. A. 2002, Proceedings of the 6th EVN Symposium, 31
- Alef & Müskens (2001) Alef, W., & Müskens, A. 2001, Proceedings of the 15th Workshop Meeting on European VLBI for Geodesy and Astrometry. Institut d’Estudis Espacials de Catalunya, Consejo Superior de Investigaciones Científicas, Barcelona, Spain, September 07-08, 2001. Edited by Dirk Behrend and Antonio Rius., p.46, 46
- Attridge (2001) Attridge, J. M. 2001, ApJ, 553, L31
- Beasley et al. (1997) Beasley, A.J., Dhawan, V., Doeleman, S., & Phillips, R.B. 1997, Millimeter-VLBI Science Workshop, ed. R. Barvainis & R.B. Phillips, MIT-Haystack Observatory, p. 53
- Bower et al. (1997) Bower, G. C., Backer, D. C., Wright, M., Forster, J. R., Aller, H. D., & Aller, M. F. 1997, ApJ, 484, 118
- Doeleman & Claussen (1997) Doeleman, S. S., & Claussen, M. 1997, Millimeter-VLBI Science Workshop, 37
- Horiuchi et al. (2004) Horiuchi, S., et al. 2004, ApJ, 616, 110
- Fomalont (1999) Fomalont, E. B. 1999, Synthesis Imaging in Radio Astronomy II, 180, 301
- Kardashev (2000) Kardashev, N. S. 2000, Astronomy Reports, 44, 719
- Kellermann & Pauliny-Toth (1969) Kellermann, K. I., & Pauliny-Toth, I. I. K. 1969, ApJ, 155, L71
- Kellermann et al. (1998) Kellermann, K. I., Vermeulen, R. C., Zensus, J. A., & Cohen, M. H. 1998, AJ, 115, 1295
- Kellermann et al. (2003) Kellermann, K. I., Lister, M. L., Homan, D. C., Ros, E., Zensus, J. A., Cohen, M. H., Russo, M., & Vermeulen, R. C. 2003, High Energy Blazar Astronomy, 299, 117
- Kovalev et al. (2005) Kovalev, Y. Y., et al. 2005, AJ, 130, 2473
- Krichbaum et al. (1995) Krichbaum, T. P., Britzen, S., Standke, K. J., Witzel, A., Schalinski, C. J., & Zensus, J. A. 1995, Proceedings of the National Academy of Science, 92, 11377
- Krichbaum et al. (1999) Krichbaum, T. P., Witzel, A., & Zensus, J. A. 1999, 2nd millimeter-VLBI science workshop : IRAM, Granada, Spain, 27-29 May 1999 / edited by A. Greve and T.P. Krichbaum. IRAM, St. Martin d’Héres, France, p.5
- Krichbaum et al. (2006) Krichbaum, T. P., Graham, D. A., Bremer, M., Alef, W., Witzel, A., Zensus, J. A., & Eckart, A. 2006, Journal of Physics Conference Series, 54, 328
- Lobanov et al. (2000) Lobanov, A. P., et al. 2000, A&A, 364, 391
- Lobanov (2005) Lobanov, A. P. 2005, ArXiv Astrophysics e-prints, arXiv:astro-ph/0503225
- Lobanov et al. (2006) Lobanov, A. P., Krichbaum, T. P., Witzel, A., & Zensus, J. A. 2006, PASJ, 58, 253
- Lonsdale et al. (1998) Lonsdale, C. J., Doeleman, S. S., & Phillips, R. B. 1998, AJ, 116, 8
- Marscher (1995) Marscher, A. P. 1995, Proceedings of the National Academy of Science, 92, 11439
- Moellenbrock et al. (1996) Moellenbrock, G. A., et al. 1996, AJ, 111, 2174
- Pagels et al. (2004) Pagels, A., et al. 2004, European VLBI Network on New Developments in VLBI Science and Technology, 7
- Rantakyro et al. (1998) Rantakyro, F. T., et al. 1998, A&AS, 131, 451
- Readhead (1994) Readhead, A. C. S. 1994, ApJ, 426, 51
- Readhead et al. (1983) Readhead, A. C. S., et al. 1983, Nature, 303, 504
- Rogers et al. (1995) Rogers, A. E. E., Phillips, R. B., & Lonsdale, C. J. 1995, BAAS, 27, 1300
- Shepherd et al. (1994) Shepherd, M. C., Pearson, T. J., & Taylor, G. B. 1994, BAAS, 26, 987
- Teraesranta et al. (1998) Teraesranta, H., et al. 1998, A&AS, 132, 305
- Urry & Padovani (1995) Urry, C. M., & Padovani, P. 1995, PASP, 107, 803
- Véron-Cetty & Véron (2006) Véron-Cetty, M.-P., & Véron, P. 2006, A&A, 455, 773


| Survey | (Jy) | (mJy/beam) | |||||
|---|---|---|---|---|---|---|---|
| (1) | (2) | (3) | (4) | (5) | (6) | (7) | (8) |
| Beasley et al. (1997) | 3 | 0.5 | … | … | 45 | 12 | … |
| Lonsdale et al. (1998) | 25 | 0.7 | … | … | 79 | 14 | … |
| Rantakyro et al. (1998) | 69 | 0.5 | 30 | 70 | 67 | 16 | 12 |
| Lobanov et al. (2000) | 35 | 0.4 | 20 | 100 | 28 | 26 | 17 |
| Total number of unique objects: | 124 | 44 | 24 | ||||
| Properties of this survey | |||||||
| 12 | 0.2 | 10 | 50 | 127 | 121 | 109 | |
Note. — Columns: 1 - references; 2 - number of participating antennas; 3 - average baseline sensitivity; 4 - average image sensitivity; 5 - typical dynamic range of images; 6 - number of sources observed; 7 - number of objects detected; 8 - number of objects imaged.
| Source | Name | Epoch | Status | Type | |||||
|---|---|---|---|---|---|---|---|---|---|
| (1) | (2) | (3) | (4) | (5) | (6) | (7) | (8) | (9) | (10) |
| 0003066 | NRAO 5 | C | 00 06 13.89289 | 06 23 35.3356 | 0.347 | B | 19.5 | 2.16 | |
| 0007106 | III Zw 2 | C | 00 10 31.00587 | 10 58 29.5038 | 0.089 | G | 15.4 | 0.60 | |
| 0016731 | B | 00 19 45.78642 | 73 27 30.0174 | 1.781 | Q | 18.0 | 0.84 | ||
| 0048097 | C | 00 50 41.31739 | 09 29 05.2103 | … | B | 17.4 | 0.60 | ||
| 0106013 | 4C 01.02 | A | 01 08 38.77104 | 01 35 00.3232 | 2.107 | Q | 18.3 | 1.36 | |
| 0119041 | C | 01 21 56.86169 | 04 22 24.7343 | 0.637 | Q | 19.5 | 0.68 | ||
| 0119115 | C | 01 21 41.59504 | 11 49 50.4131 | 0.570 | Q | 19.5 | 0.68 | ||
| 0133476 | A,B | 01 36 58.59481 | 47 51 29.1001 | 0.859 | Q | 18.0 | |||
| 0149218 | A,C | 01 52 18.05900 | 22 07 07.6997 | 1.32 | Q | 20.8 | |||
| 0201113 | C | 02 03 46.65706 | 11 34 45.4096 | 3.61 | Q | 20.0 | 0.39 | ||
| 0202149 | 4C 15.05 | A | 02 04 50.41402 | 15 14 11.0453 | 0.405 | Q | 22.1 | … | |
| 0202319 | C | 02 05 04.92537 | 32 12 30.0956 | 1.466 | Q | 18.2 | 1.01 | ||
| 0212735 | A,B | 02 17 30.81336 | 73 49 32.6218 | 2.367 | Q | 19.0 | |||
| 0218357 | C | 02 21 05.47330 | 35 56 13.7910 | 0.944 | Q | 20.0 | 0.58 | ||
| 0221067 | C | 02 24 28.42819 | 06 59 23.3416 | 0.511 | Q | 19.0 | 0.59 | ||
| 0224671 | 4C 67.05 | B | 02 28 50.05146 | 67 21 03.0292 | 0.523 | Q | 19.5 | 1.34 | |
| 0234285 | 4C 28.07 | A,B,C | 02 37 52.40568 | 28 48 08.9901 | 1.207 | Q | 18.9 | ||
| 0235164 | A | 02 38 38.93006 | 16 36 59.2789 | 0.940 | B | 19.0 | 1.62 | ||
| 0238084 | NGC 1052 | B,C | 02 41 04.79852 | 08 15 20.7518 | 0.005 | G | 12.1 | 0.63 | |
| 0300470 | B | 03 03 35.24222 | 47 16 16.2754 | … | B | 17.2 | 3.11 | ||
| 0316413 | 3C 84 | A,B,C | 03 19 48.16010 | 41 30 42.1030 | 0.017 | G | 12.6 | ||
| 0333321 | NRAO 140 | A | 03 36 30.10760 | 32 18 29.3430 | 1.263 | Q | 17.5 | 1.77 | |
| 0336019 | CTA 26 | A | 03 39 30.93771 | 01 46 35.8040 | 0.852 | Q | 18.4 | 2.11 | |
| 0355508 | NRAO 150 | A,C | 03 59 29.74726 | 50 57 50.1615 | … | Q | … | ||
| 0415379 | 3C 111 | B,C | 04 18 21.27700 | 38 01 35.9000 | 0.049 | G | 18.0 | ||
| 0420022 | C | 04 22 52.21464 | 02 19 26.9319 | 2.277 | Q | 19.5 | 0.48 | ||
| 0420014 | B | 04 23 15.80072 | 01 20 33.0653 | 0.915 | Q | 17.8 | 5.83 | ||
| 0422004 | B | 04 24 46.84205 | 00 36 06.3298 | 0.310 | B | 17.0 | 1.46 | ||
| 0430052 | 3C 120 | B,C | 04 33 11.09553 | 05 21 15.6194 | 0.033 | G | 14.2 | ||
| 0440003 | NRAO 190 | C | 04 42 38.66076 | 00 17 43.4191 | 0.844 | Q | 19.2 | 0.88 | |
| 0458020 | 4C 02.19 | B | 05 01 12.80988 | 01 59 14.2562 | 2.291 | Q | 18.4 | 1.12 | |
| 0521365 | C | 05 22 57.98463 | 36 27 30.8516 | 0.055 | G | 14.5 | … | ||
| 0528134 | A | 05 30 56.41665 | 13 31 55.1484 | 2.07 | Q | 20.0 | 2.02 | ||
| 0529075 | A | 05 32 39.02004 | 07 32 43.3466 | 1.254 | Q | 19.0 | 1.13 | ||
| 0552398 | DA 193 | A | 05 55 30.80564 | 39 48 49.1654 | 2.363 | Q | 18.0 | 1.34 | |
| 0605085 | A | 06 07 59.69905 | 08 34 49.9798 | 0.872 | Q | 18.5 | 1.28 | ||
| 0607157 | B | 06 09 40.94953 | 15 42 40.6726 | 0.324 | Q | 17.0 | … | ||
| 0642449 | B | 06 46 32.02598 | 44 51 16.5901 | 3.408 | Q | 18.5 | 1.67 | ||
| 0707476 | C | 07 10 46.10490 | 47 32 11.1426 | 1.292 | Q | 18.2 | 0.27 | ||
| 0710439 | C | 07 13 38.16412 | 43 49 17.2069 | 0.518 | G | 19.7 | 0.22 | ||
| 0716714 | B,C | 07 21 53.44846 | 71 20 36.3633 | … | B | 15.5 | |||
| 0727115 | B | 07 30 19.11247 | 11 41 12.6004 | 1.591 | Q | 22.5 | … | ||
| 0735178 | B | 07 38 07.39374 | 17 42 18.9982 | 0.424 | B | 14.9 | 1.23 | ||
| 0736017 | A | 07 39 18.03380 | 01 37 04.6180 | 0.191 | Q | 16.5 | 2.24 | ||
| 0738313 | C | 07 41 10.70330 | 31 12 00.2286 | 0.630 | Q | 16.7 | 0.47 | ||
| 0748126 | B | 07 50 52.04573 | 12 31 04.8281 | 0.889 | Q | 17.8 | 1.80 | ||
| 0804499 | C | 08 08 39.66627 | 49 50 36.5304 | 1.432 | Q | 19.1 | 0.38 | ||
| 0814425 | C | 08 18 15.99961 | 42 22 45.4149 | 0.530 | B | 18.5 | 0.50 | ||
| 0823033 | A | 08 25 50.33800 | 03 09 24.5100 | 0.506 | B | 18.5 | 1.02 | ||
| 0827243 | B | 08 30 52.08619 | 24 10 59.8204 | 0.941 | Q | 17.3 | 2.16 | ||
| 0834201 | C | 08 36 39.21522 | 20 16 59.5038 | 2.752 | Q | 19.4 | … | ||
| 0836710 | 4C 71.07 | C | 08 41 24.36528 | 70 53 42.1730 | 2.218 | Q | 16.5 | 1.16 | |
| 0850581 | C | 08 54 41.99638 | 57 57 29.9392 | 1.322 | Q | 18.2 | 0.26 | ||
| 0851202 | OJ 287 | B | 08 54 48.87492 | 20 06 30.6408 | 0.306 | B | 14.0 | 2.71 | |
| 0859470 | OJ 499 | C | 09 03 03.99010 | 46 51 04.1375 | 1.462 | Q | 19.4 | 0.42 | |
| 0906015 | B | 09 09 10.09159 | 01 21 35.6176 | 1.018 | Q | 17.3 | 2.43 | ||
| 0917624 | A | 09 21 36.23053 | 62 15 52.1763 | 1.446 | Q | 19.5 | 1.01 | ||
| 0945408 | 4C 40.24 | A | 09 48 55.33817 | 40 39 44.5872 | 1.252 | Q | 17.9 | 0.95 | |
| 0954658 | A | 09 58 47.24428 | 65 33 54.8108 | 0.367 | B | 16.7 | 1.16 | ||
| 1012232 | B | 10 14 47.06544 | 23 01 16.5709 | 0.565 | Q | 17.5 | 1.01 | ||
| 1044719 | B | 10 48 27.61991 | 71 43 35.9382 | 1.150 | Q | 19.0 | 0.87 | ||
| 1101384 | Mk 421 | C | 11 04 27.31394 | 38 12 31.7991 | 0.031 | B | 13.3 | 0.58 | |
| 1128385 | C | 11 30 53.28261 | 38 15 18.5470 | 1.733 | Q | 18.6 | 0.97 | ||
| 1150497 | 4C 49.22 | C | 11 53 24.46664 | 49 31 08.8301 | 0.334 | Q | 17.4 | 1.02 | |
| 1156295 | 4C 29.45 | A | 11 59 31.83390 | 29 14 43.8295 | 0.729 | Q | 17.0 | 4.42 | |
| 1219285 | C | 12 21 31.69051 | 28 13 58.5002 | 0.102 | B | 16.5 | 0.36 | ||
| 1226023 | 3C 273B | A | 12 29 06.69973 | 02 03 08.5982 | 0.158 | Q | 12.9 | 10.81 | |
| 1228126 | 3C 274 | A | 12 30 49.42338 | 12 23 28.0439 | 0.004 | G | 9.6 | 4.16 | |
| 1253055 | 3C 279 | C | 12 56 11.16656 | 05 47 21.5246 | 0.538 | Q | 17.8 | 16.90 | |
| 1308326 | A | 13 10 28.66372 | 32 20 43.7818 | 0.997 | Q | 19.0 | 1.44 | ||
| 1418546 | C | 14 19 46.59741 | 54 23 14.7872 | 0.152 | B | 15.9 | 0.93 | ||
| 1458718 | 3C 309.1 | C | 14 59 07.58386 | 71 40 19.8677 | 0.904 | Q | 16.8 | 0.65 | |
| 1502106 | C | 15 04 24.97978 | 10 29 39.1986 | 1.833 | Q | 18.6 | 0.82 | ||
| 1504377 | C | 15 06 09.52995 | 37 30 51.1324 | 0.674 | G | 21.2 | 0.51 | ||
| 1508055 | C | 15 10 53.59143 | 05 43 07.4171 | 1.191 | Q | 17.2 | … | ||
| 1510089 | C | 15 12 50.53292 | 09 05 59.8296 | 0.360 | Q | 16.5 | 2.10 | ||
| 1511100 | C | 15 13 44.89341 | 10 12 00.2646 | 1.513 | Q | 18.5 | 0.81 | ||
| 1546027 | C | 15 49 29.43683 | 02 37 01.1632 | 0.412 | Q | 17.3 | 1.04 | ||
| 1548056 | C | 15 50 35.26924 | 05 27 10.4482 | 1.422 | Q | 17.7 | 1.71 | ||
| 1606106 | C | 16 08 46.20318 | 10 29 07.7758 | 1.226 | Q | 18.5 | 1.26 | ||
| 1611343 | A | 16 13 41.06416 | 34 12 47.9093 | 1.401 | Q | 17.5 | 1.83 | ||
| 1633382 | 4C 38.41 | A | 16 35 15.49297 | 38 08 04.5006 | 1.807 | Q | 17.7 | 5.81 | |
| 1637574 | C | 16 38 13.45630 | 57 20 23.9790 | 0.751 | Q | 17.0 | 1.70 | ||
| 1638398 | NRAO 512 | C | 16 40 29.63277 | 39 46 46.0285 | 1.666 | Q | 18.5 | 0.50 | |
| 1641399 | 3C 345 | A | 16 42 58.80995 | 39 48 36.9939 | 0.594 | Q | 16.6 | 6.33 | |
| 1642690 | C | 16 42 07.84853 | 68 56 39.7564 | 0.751 | Q | 19.2 | 1.36 | ||
| 1652398 | DA 426 | A | 16 53 52.22700 | 39 45 36.4500 | 0.033 | B | 14.2 | … | |
| 1655077 | C | 16 58 09.01145 | 07 41 27.5407 | 0.621 | Q | 20.8 | 1.00 | ||
| 1739522 | C | 17 40 36.97785 | 52 11 43.4074 | 1.379 | Q | 18.5 | 1.45 | ||
| 1741038 | C | 17 43 58.85614 | 03 50 04.6168 | 1.057 | Q | 18.6 | 4.16 | ||
| 1749701 | 4C 09.57 | A | 17 48 32.84008 | 70 05 50.7705 | 0.770 | B | 17.0 | … | |
| 1749096 | C | 17 51 32.81857 | 09 39 00.7285 | 0.320 | B | 16.8 | 4.03 | ||
| 1800440 | B | 18 01 32.31485 | 44 04 21.9003 | 0.663 | Q | 17.5 | 1.07 | ||
| 1803784 | A,C | 18 00 45.68364 | 78 28 04.0206 | 0.680 | B | 17.0 | 1.48 | ||
| 1807698 | 3C 371 | A | 18 06 50.68063 | 69 49 28.1087 | 0.050 | B | 14.4 | 1.54 | |
| 1823568 | 4C 56.27 | A | 18 24 07.06809 | 56 51 01.4939 | 0.663 | B | 18.4 | 1.30 | |
| 1828487 | 3C 380 | A | 18 29 31.72483 | 48 44 46.9515 | 0.692 | Q | 16.8 | 1.96 | |
| 1842681 | A | 18 42 33.64129 | 68 09 25.2314 | 0.475 | Q | 17.9 | 0.74 | ||
| 1901319 | 3C 395 | C | 19 02 55.93886 | 31 59 41.7020 | 0.635 | Q | 17.5 | 0.59 | |
| 1921293 | A | 19 24 51.05590 | 29 14 30.1210 | 0.352 | Q | 17.0 | … | ||
| 1923210 | B | 19 25 59.60537 | 21 06 26.1621 | … | U | 16.1 | 1.73 | ||
| 1928738 | A,C | 19 28 00.00000 | 73 00 00.0000 | 0.303 | Q | 16.5 | |||
| 1954513 | C | 19 55 42.73827 | 51 31 48.5462 | 1.223 | Q | 18.5 | 0.66 | ||
| 1957405 | Cyg A | C | 19 59 28.35400 | 40 44 02.1200 | 0.056 | G | 17.0 | … | |
| 2005403 | A | 20 07 44.94499 | 40 29 48.6113 | 1.736 | Q | 19.5 | 1.25 | ||
| 2007777 | A | 20 05 30.99883 | 77 52 43.2493 | 0.342 | B | 16.5 | 0.92 | ||
| 2013370 | B | 20 15 28.71260 | 37 10 59.6940 | … | B | 21.6 | 2.89 | ||
| 2021614 | C | 20 22 06.68167 | 61 36 58.8047 | 0.227 | G | 19.5 | 0.58 | ||
| 2023336 | B | 20 25 10.84209 | 33 43 00.2145 | 0.219 | B | … | 1.77 | ||
| 2030407 | Cyg X-3 | A,B | 20 32 25.76740 | 40 57 28.2794 | … | S | … | … | |
| 2031405 | MWC 349 | A | 20 30 56.85000 | 40 29 20.2000 | … | U | … | 1.17 | |
| 2037511 | 3C 418 | B | 20 38 37.03475 | 51 19 12.6626 | 1.687 | Q | 20.0 | 1.44 | |
| 2121053 | A | 21 23 44.51727 | 05 35 22.0971 | 1.941 | Q | 17.5 | … | ||
| 2128123 | A | 21 31 35.26150 | 12 07 04.7980 | 0.501 | Q | 15.5 | … | ||
| 2131021 | C | 21 34 10.30961 | 01 53 17.2393 | 1.285 | B | 18.7 | 1.15 | ||
| 2134004 | DA 553 | A | 21 36 38.58615 | 00 41 54.2195 | 1.932 | Q | 17.1 | 2.03 | |
| 2136141 | C | 21 39 01.30926 | 14 23 35.9921 | 2.427 | Q | 18.5 | 1.03 | ||
| 2155152 | B | 21 58 06.28190 | 15 01 09.3280 | 0.672 | Q | 17.5 | … | ||
| 2200420 | BL Lac | A | 22 02 43.29138 | 42 16 39.9899 | 0.069 | B | 14.5 | 3.57 | |
| 2201315 | 4C 31.63 | A | 22 03 14.97564 | 31 45 38.2749 | 0.298 | Q | 15.5 | 2.97 | |
| 2209236 | C | 22 12 05.96631 | 23 55 40.5438 | 1.125 | Q | 19.0 | 0.68 | ||
| 2216038 | B | 22 18 52.03772 | 03 35 36.8794 | 0.901 | Q | 16.5 | 0.97 | ||
| 2223052 | 3C 446 | B | 22 25 47.25929 | 04 57 01.3907 | 1.404 | Q | 17.2 | 3.90 | |
| 2234282 | A | 22 36 22.47100 | 28 28 57.4200 | 0.795 | Q | 19.1 | 1.03 | ||
| 2251158 | 3C 454.3 | A | 22 53 57.74786 | 16 08 53.5655 | 0.859 | Q | 16.1 | 5.97 | |
| 2255282 | A,B | 22 58 05.96289 | 27 58 21.2568 | 0.927 | Q | 16.8 | … | ||
| 2345167 | B | 23 48 02.60851 | 16 31 12.0220 | 0.576 | Q | 17.5 | … |
Note. — Column designation: 1 - IAU source name; 2 - common name; 3 - observing epochs: A - October 2001; B - April 2002; C - October 2002; 4 , 5 - source coordinates; 6 - status: “” - not detected; “” - detected; “” - detected and only model fitted; “” - detected and imaged; 7 - redshift; 8 - optical class: Q - quasar; B - BL Lac object; G - radio galaxy; S - star; U - unidentified; 9 - optical magnitude; 7 , 8 - information obtained from Véron-Cetty & Véron (2006); 9 - information obtained from NASA/IPAC Extragalactic Database, http://nedwww.ipac.caltech.edu; 10 - total flux density [Jy] (obtained from pointing and calibration scan measurements made at Pico Veleta); : mean value of measurements on multiple epochs.
| Bit Rate | Frequency | Bandwidth | |||||
|---|---|---|---|---|---|---|---|
| Epoch | Code | (Mbit/s) | Channels | Sampling | (MHz) | Source | Telescopes |
| (1) | (2) | (3) | (4) | (5) | (6) | (7) | (8) |
| 2001 Oct 26-29 | A | 256 | 16 | 1 | 128 | 48 | VLBA + (Eb,PV,On,Mh,HA) |
| 2002 Apr 20-23 | B | 256 | 16 | 1 | 128 | 35 | VLBA + (Eb,PV,On,HA) |
| 2002 Oct 24-27 | C | 256 | 8 | 2 | 64 | 60 | VLBA + (Eb,PV,PdB,HA) |
Note. — Column designation: 1 - observation epoch; 2 - code of each epoch; 3 - total recorded bit rate in Mega–bits per second; 4 - number of baseband channels; 5 - sampling mode [bit]; 6 - total observing bandwidth; 7 - number of sources observed (12 of the 127 observed sources were observed during more than one session); 8 - telescopes participating: VLBA - Fort Davis, Hancock, North Liberty, Owens Valley, Pie Town, Mauna Kea, Los Alamos, Kitt Peak; Eb - Effelsberg; PV - Pico Veleta; On - Onsala ; Mh - Metsähovi; PdB - Plateau de Bure ; HA - Haystack.
| Threshold | ||||||||
|---|---|---|---|---|---|---|---|---|
| Name | code | (m) | (K/Jy) | (K) | (K) | (mJy) | (mJy) | |
| (1) | (2) | (3) | (4) | (5) | (6) | (7) | (8) | (9) |
| Effelsberg | Eb | 100 | 0.140 | 130 | 0.07 | 929 | 20 | 143 |
| Haystack | HA | 37 | 0.058 | 200 | 0.15 | 3448 | 39 | 273 |
| Plateau de Bure | PdB | 0.180 | 120 | 0.65 | 667 | 17 | 121 | |
| Pico Veleta | PV | 30 | 0.140 | 120 | 0.55 | 857 | … | … |
| Onsala | On | 20 | 0.053 | 250 | 0.45 | 4717 | 45 | 321 |
| Metsähovi | Mh | 14 | 0.017 | 300 | 0.30 | 17647 | 89 | 621 |
| Fort Davis | Fd | 25 | 0.034 | 120 | 0.17 | 3529 | 40 | 278 |
| Hancock | Hn | 25 | 0.035 | 120 | 0.17 | 3429 | 39 | 274 |
| North Liberty | Nl | 25 | 0.055 | 270 | 0.17 | 4909 | 47 | 328 |
| Owens Valley | Ov | 25 | 0.020 | 100 | 0.17 | 5000 | 47 | 331 |
| Pietown | Pt | 25 | 0.024 | 100 | 0.17 | 4167 | 43 | 302 |
| Kitt Peak | Kp | 25 | 0.025 | 110 | 0.17 | 4400 | 44 | 310 |
| Los Alamos | La | 25 | 0.051 | 160 | 0.17 | 3137 | 37 | 262 |
| Mauna Kea | Mk | 25 | 0.023 | 100 | 0.17 | 4348 | 44 | 308 |
Note. — Column designation: 1 - name of the participating telescope; 2 - abbreviation of the telescope name; 3 - diameter; 4 - typical zenith gain; 5 - system temperature; 6 - aperture efficiency; 7 - typical zenith SEFD obtained from the formula, ; 8 - baseline sensitivity on baseline to Pico Veleta, assuming a recording rate of 256 Mbps and a fringe-fit interval of 30 seconds; 9 - 7 detection threshold.
| Telescope | Session A | Session B | Session C |
|---|---|---|---|
| (1) | (2) | (3) | (4) |
| Eb | 0.998 0.129 | 1.079 0.183 | 1.354 0.555 |
| HA | 1.160 0.179 | 1.155 0.315 | 1.180 0.350 |
| PdB | … | … | 0.964 0.150 |
| PV | 0.971 0.157 | 0.938 0.156 | 0.952 0.192 |
| On | 1.033 0.110 | 0.956 0.121 | … |
| Mh | … | … | … |
| Fd | 1.215 0.216 | 1.213 0.298 | 1.080 0.321 |
| Hn | … | … | 1.055 0.235 |
| Nl | 0.996 0.136 | 1.003 0.116 | 1.002 0.231 |
| Ov | 1.053 0.158 | 1.107 0.181 | 1.079 0.221 |
| Pt | 1.139 0.286 | 1.131 0.284 | 1.046 0.183 |
| Kp | 1.104 0.172 | 1.059 0.150 | 1.123 0.259 |
| La | 1.009 0.163 | 1.058 0.266 | 1.076 0.182 |
| Mk | 1.191 0.240 | 1.543 0.499 | 1.241 0.268 |
Note. — Column designation: 1 - abbreviation for the name of telescopes; 2 - average and rms of antenna gains for observing session A; 3 - average and rms of antenna gains for observing session B; 4 - average and rms of antenna gains for observing session C.
| Name | Obs | ||||||||||||
|---|---|---|---|---|---|---|---|---|---|---|---|---|---|
| (1) | (2) | (3) | (4) | (5) | (6) | (7) | (8) | (9) | (10) | (11) | (12) | (13) | (14) |
| 0003066 | C | 2.16 | 0.71 0.30 | 60 | 0.29 0.16 | 2450 | 461 | 49 | -6.2 | 613 | 209 | 17 | 0.86 |
| 0007106 | C | 0.60 | 0.59 0.00 | 10 | 0.35 0.06 | 2470 | 457 | 54 | -2.7 | 372 | 181 | 9 | 1.00 |
| 0016731 | B | 0.84 | 0.48 0.13 | 60 | 0.25 0.08 | 3130 | 75 | 51 | -11.6 | 434 | 181 | 8 | 0.91 |
| 0048097 | C | 0.60 | 0.43 0.13 | 60 | 0.11 0.06 | 2440 | 466 | 42 | -3.3 | 486 | 163 | 6 | 0.75 |
| 0106013 | A | 1.36 | 0.49 0.06 | 100 | 0.24 0.05 | 2390 | 900 | 45 | -8.6 | 447 | 354 | 15 | 0.62 |
| 0119041 | C | 0.68 | 0.20 0.06 | 70 | 0.20 0.09 | 2390 | 602 | 79 | -9.9 | 233 | 227 | 9 | 0.77 |
| 0119115 | C | 0.68 | 0.34 0.12 | 60 | 0.16 0.06 | 2390 | 400 | 44 | -7.1 | 232 | 176 | 10 | 0.63 |
| 0133476 | A | 3.96 | 1.99 0.86 | 60 | 0.09 0.03 | 3140 | 170 | 51 | -16.4 | 2148 | 675 | 17 | 0.80 |
| B | 4.53 | 0.70 0.39 | 30 | 1.36 0.54 | 2430 | 206 | 43 | 5.1 | 4164 | 881 | 20 | 0.79 | |
| 0149218 | A | 0.96 | 0.38 0.14 | 130 | 0.07 0.04 | 2450 | 266 | 39 | -7.1 | 425 | 230 | 12 | 0.68 |
| C | 0.99 | 0.41 0.12 | 50 | 0.06 0.03 | 2420 | 262 | 50 | -5.4 | 529 | 278 | 10 | 0.77 | |
| 0201113 | C | 0.39 | 0.27 0.10 | 60 | 0.16 0.05 | 2470 | 455 | 47 | -2.6 | 212 | 159 | 8 | 0.66 |
| 0202149 | A | … | 0.32 0.08 | 140 | 0.21 0.04 | 2470 | 381 | 44 | -6.0 | 370 | 193 | 9 | 0.81 |
| 0202319 | C | 1.01 | 0.59 0.16 | 60 | 0.10 0.05 | 3140 | 230 | 44 | -15.3 | 684 | 263 | 8 | 0.84 |
| 0212735 | A | 0.77 | 0.16 0.06 | 60 | 0.11 0.03 | 2960 | 109 | 48 | -44.5 | 174 | 136 | 4 | 0.87 |
| B | 0.79 | 0.33 0.14 | 230 | 0.20 0.07 | 670 | 1354 | 151 | -65.3 | 430 | 229 | 11 | 0.49 | |
| 0218357 | C | 0.58 | 0.14 0.04 | 60 | 0.11 0.03 | 3140 | 229 | 43 | -17.2 | 182 | 109 | 4 | 0.90 |
| 0221067 | C | 0.59 | 0.42 0.06 | 110 | 0.11 0.02 | 2470 | 582 | 68 | -0.2 | 357 | 272 | 25 | 0.59 |
| 0224671 | B | 1.34 | 0.27 0.10 | 40 | 0.29 0.06 | 2380 | 183 | 50 | 38.5 | 362 | 209 | 9 | 1.04 |
| 0234285 | A | 2.98 | 2.07 0.30 | 210 | 0.13 0.07 | 2380 | 215 | 37 | -3.3 | 2110 | 549 | 12 | 0.95 |
| B | 3.24 | 2.44 0.48 | 210 | 0.17 0.06 | 2310 | 218 | 42 | 2.9 | 2691 | 1073 | 25 | 0.74 | |
| C | … | 1.47 0.20 | 60 | 0.24 0.04 | 2460 | 466 | 53 | -6.4 | 1662 | 931 | 38 | 0.75 | |
| 0235164 | A | 1.62 | 0.99 0.30 | 410 | 0.45 0.06 | 2470 | 298 | 37 | 2.1 | 966 | 482 | 22 | 0.73 |
| 0238084 | B | … | 0.27 0.06 | 250 | 0.08 0.02 | 2420 | 425 | 35 | -6.2 | 246 | 155 | 8 | 0.74 |
| C | 0.63 | 0.33 0.11 | 60 | 0.12 0.00 | 2430 | 1001 | 51 | -4.7 | 307 | 247 | 9 | 0.67 | |
| 0300470 | B | 3.11 | 0.91 0.15 | 240 | 0.13 0.05 | 2460 | 178 | 36 | -9.5 | 953 | 377 | 4 | 0.99 |
| 0316413 | A | 4.76 | 1.84 0.28 | 60 | 0.21 0.07 | 2470 | 203 | 43 | -15.6 | 2849 | 426 | 20 | 1.20 |
| B | 4.80 | 1.23 0.51 | 30 | 0.22 0.09 | 2380 | 353 | 61 | -1.1 | 1530 | 419 | 12 | 0.76 | |
| C | 4.56 | 0.90 0.20 | 60 | 0.17 0.06 | 3140 | 187 | 47 | -23.7 | 1347 | 339 | 8 | 0.94 | |
| 0333321 | A | 1.77 | 0.42 0.16 | 210 | 0.34 0.07 | 2440 | 211 | 42 | -2.6 | 624 | 273 | 16 | 0.98 |
| 0336019 | A | 2.11 | 1.09 0.60 | 300 | 0.22 0.03 | 2280 | 368 | 52 | -3.4 | 1971 | 461 | 14 | 0.69 |
| 0355508 | A | 6.76 | 3.86 0.79 | 60 | 0.27 0.06 | 3140 | 150 | 47 | -28.6 | 4198 | 653 | 47 | 0.82 |
| C | 7.59 | 4.03 0.40 | 70 | 1.36 0.54 | 1470 | 697 | 90 | -31.3 | 4140 | 2487 | 95 | 1.01 | |
| 0415379 | B | 2.17 | 0.56 0.26 | 90 | 0.18 0.06 | 2460 | 203 | 44 | -7.9 | 2696 | 508 | 24 | 0.77 |
| C | 2.57 | 1.53 0.23 | 60 | 0.13 0.07 | 3120 | 220 | 42 | -16.7 | 1445 | 375 | 30 | 0.69 | |
| 0420022 | C | 0.48 | 0.33 0.15 | 60 | 0.10 0.04 | 2470 | 684 | 51 | -0.7 | 234 | 161 | 7 | 0.76 |
| 0420014 | B | 5.83 | 1.42 0.89 | 50 | 0.48 0.12 | 2470 | 445 | 48 | -5.8 | 1866 | 879 | 43 | 0.84 |
| 0422004 | B | 1.46 | 0.62 0.25 | 60 | 0.37 0.09 | 2460 | 438 | 48 | -5.3 | 667 | 409 | 12 | 0.92 |
| 0430052 | B | 4.05 | 0.14 0.08 | 100 | 0.20 0.05 | 2460 | 359 | 43 | -5.7 | 3585 | 555 | 26 | 0.71 |
| C | 2.32 | 0.87 0.12 | 60 | 0.39 0.07 | 2460 | 594 | 56 | -0.8 | 1523 | 542 | 16 | 0.77 | |
| 0440003 | C | 0.88 | 0.37 0.12 | 70 | 0.31 0.06 | 2470 | 497 | 56 | -2.4 | 481 | 337 | 12 | 0.87 |
| 0458020 | B | 1.12 | 0.50 0.18 | 50 | 0.17 0.04 | 2460 | 433 | 49 | -5.4 | 501 | 357 | 9 | 0.77 |
| 0521365 | C | … | 0.43 0.17 | 40 | 0.22 0.09 | 1400 | 1196 | 150 | -13.5 | 330 | 297 | 18 | 0.53 |
| 0528134 | A | 2.02 | 0.54 0.06 | 140 | 0.29 0.05 | 2410 | 336 | 50 | -1.3 | 1051 | 391 | 6 | 0.82 |
| 0529075 | A | 1.13 | 0.29 0.07 | 270 | 0.25 0.07 | 2250 | 840 | 52 | 2.9 | 267 | 260 | 20 | 0.68 |
| 0552398 | A | 1.34 | 0.72 0.12 | 60 | 0.15 0.03 | 2470 | 248 | 41 | -9.9 | 778 | 348 | 11 | 0.77 |
| 0607157 | B | … | 1.00 0.40 | 60 | 0.41 0.14 | 1350 | 718 | 127 | -23.9 | 1188 | 798 | 16 | 0.84 |
| 0642449 | B | 1.67 | 1.16 0.11 | 60 | 0.18 0.05 | 2470 | 214 | 43 | -6.1 | 1295 | 486 | 7 | 0.73 |
| 0707476 | C | 0.27 | 0.08 0.02 | 330 | 0.08 0.02 | 2470 | 255 | 37 | -4.9 | 75 | 72 | 3 | 0.67 |
| 0716714 | B | 1.16 | 0.51 0.10 | 50 | 0.29 0.04 | 2470 | 141 | 49 | 3.5 | 565 | 369 | 12 | 0.92 |
| C | 2.51 | 0.61 0.43 | 100 | 0.61 0.06 | 3120 | 122 | 40 | -15.9 | 1020 | 865 | 29 | 0.89 | |
| 0727115 | B | … | 0.65 0.24 | 70 | 0.45 0.15 | 620 | 928 | 265 | -21.8 | 675 | 545 | 25 | 0.69 |
| 0735178 | B | 1.23 | 0.30 0.11 | 50 | 0.12 0.05 | 2390 | 315 | 42 | -0.5 | 629 | 141 | 5 | 0.71 |
| 0736017 | A | 2.24 | 1.36 0.48 | 320 | 0.24 0.09 | 2400 | 341 | 49 | -1.9 | 1990 | 577 | 18 | 0.79 |
| 0738313 | C | 0.47 | 0.41 0.08 | 30 | 0.08 0.04 | 2320 | 303 | 51 | 6.1 | 439 | 254 | 8 | 0.81 |
| 0748126 | B | 1.80 | 0.52 0.20 | 270 | 0.33 0.09 | 2400 | 333 | 42 | -2.0 | 1628 | 506 | 14 | 0.84 |
| 0804499 | C | 0.38 | 0.20 0.07 | 40 | 0.10 0.04 | 2360 | 213 | 40 | 0.0 | 175 | 113 | 4 | 0.71 |
| 0814425 | C | 0.50 | 0.39 0.10 | 40 | 0.05 0.01 | 2380 | 232 | 43 | 2.8 | 409 | 178 | 7 | 0.74 |
| 0823033 | A | 1.02 | 0.59 0.09 | 60 | 0.15 0.05 | 2400 | 348 | 39 | -3.6 | 590 | 239 | 8 | 0.71 |
| 0827243 | B | 2.16 | 0.55 0.16 | 70 | 0.50 0.06 | 2380 | 314 | 54 | -19.7 | 720 | 535 | 13 | 1.02 |
| 0836710 | C | 1.16 | 0.39 0.11 | 90 | 0.16 0.09 | 3000 | 156 | 62 | 21.1 | 451 | 361 | 14 | 0.85 |
| 0850581 | C | 0.26 | 0.14 0.01 | 50 | 0.09 0.03 | 2470 | 247 | 37 | -13.8 | 165 | 72 | 4 | 0.83 |
| 0851202 | B | 2.71 | 0.60 0.20 | 60 | 0.29 0.12 | 3140 | 366 | 52 | -12.0 | 901 | 505 | 19 | 0.83 |
| 0859470 | C | 0.42 | 0.33 0.09 | 40 | 0.14 0.03 | 2330 | 230 | 43 | 10.5 | 306 | 174 | 8 | 0.88 |
| 0906015 | B | 2.43 | 0.73 0.29 | 60 | 0.36 0.09 | 2470 | 452 | 46 | -5.1 | 649 | 488 | 16 | 0.86 |
| 0917624 | A | 1.01 | 0.27 0.12 | 50 | 0.07 0.04 | 2350 | 154 | 44 | -16.8 | 142 | 116 | 6 | 0.92 |
| 0945408 | A | 0.95 | 0.11 0.06 | 170 | 0.22 0.07 | 2890 | 180 | 46 | -16.8 | 798 | 229 | 13 | 0.93 |
| 0954658 | A | 1.16 | 0.43 0.12 | 50 | 0.27 0.02 | 3040 | 144 | 45 | -4.0 | 784 | 336 | 8 | 0.95 |
| 1012232 | B | 1.01 | 0.77 0.11 | 60 | 0.09 0.05 | 3110 | 345 | 41 | -12.4 | 693 | 191 | 7 | 0.99 |
| 1044719 | B | 0.87 | 0.26 0.14 | 60 | 0.30 0.06 | 2470 | 218 | 49 | -30.2 | 204 | 181 | 8 | 0.92 |
| 1101384 | C | 0.58 | 0.33 0.09 | 90 | 0.12 0.03 | 2470 | 220 | 44 | -6.8 | 407 | 169 | 5 | 0.84 |
| 1128385 | C | 0.97 | 0.44 0.19 | 170 | 0.10 0.03 | 3140 | 213 | 43 | -2.0 | 482 | 258 | 10 | 0.74 |
| 1150497 | C | 1.02 | 0.46 0.14 | 160 | 0.33 0.14 | 2390 | 284 | 48 | 13.1 | 616 | 392 | 11 | 0.92 |
| 1156295 | A | 4.42 | 2.97 0.62 | 220 | 0.93 0.21 | 2470 | 188 | 37 | -8.5 | 3006 | 1176 | 28 | 0.97 |
| 1219285 | C | 0.36 | 0.23 0.06 | 50 | 0.09 0.01 | 2470 | 343 | 38 | -5.3 | 179 | 104 | 3 | 0.75 |
| 1226023 | A | 10.81 | 2.05 0.33 | 100 | 0.32 0.17 | 2440 | 439 | 54 | -5.5 | 2160 | 630 | 27 | 0.65 |
| 1228126 | A | 4.16 | 0.94 0.16 | 180 | 0.16 0.07 | 1590 | 198 | 78 | -4.8 | 897 | 568 | 35 | 0.61 |
| 1253055 | C | 16.90 | 2.32 0.83 | 70 | 3.04 0.54 | 2460 | 440 | 56 | -4.3 | 8653 | 4286 | 158 | 1.29 |
| 1308326 | A | 1.44 | 0.45 0.07 | 150 | 0.44 0.05 | 2330 | 215 | 46 | 1.4 | 734 | 466 | 12 | 0.76 |
| 1502106 | C | 0.82 | 0.45 0.12 | 150 | 0.28 0.02 | 2450 | 440 | 47 | -2.3 | 564 | 298 | 11 | 0.76 |
| 1508055 | C | … | 0.49 0.15 | 130 | 0.16 0.07 | 2310 | 469 | 45 | -0.3 | 1192 | 285 | 16 | 0.62 |
| 1510089 | C | 2.10 | 0.67 0.24 | 130 | 0.66 0.10 | 2350 | 400 | 42 | -4.7 | 1864 | 576 | 46 | 0.69 |
| 1511100 | C | 0.81 | 0.64 0.15 | 120 | 0.18 0.03 | 2440 | 580 | 40 | -1.3 | 598 | 264 | 16 | 0.67 |
| 1546027 | C | 1.04 | 0.50 0.26 | 140 | 0.28 0.07 | 2470 | 407 | 44 | -4.0 | 436 | 220 | 19 | 0.74 |
| 1548056 | C | 1.71 | 0.63 0.16 | 260 | 0.18 0.07 | 2470 | 464 | 44 | -2.8 | 551 | 248 | 12 | 0.84 |
| 1606106 | C | 1.26 | 0.37 0.10 | 70 | 0.53 0.11 | 3140 | 401 | 52 | -10.1 | 397 | 344 | 16 | 0.98 |
| 1637574 | C | 1.70 | 1.13 0.37 | 110 | 0.61 0.08 | 3130 | 118 | 36 | -58.1 | 1186 | 741 | 12 | 1.10 |
| 1642690 | C | 1.36 | 0.50 0.11 | 60 | 0.23 0.09 | 3140 | 107 | 43 | -59.9 | 512 | 360 | 12 | 1.11 |
| 1652398 | A | … | 0.24 0.09 | 230 | 0.10 0.05 | 720 | 805 | 145 | 78.7 | 245 | 159 | 10 | 0.57 |
| 1655077 | C | 1.00 | 0.49 0.22 | 130 | 0.27 0.08 | 2470 | 381 | 44 | -7.4 | 569 | 330 | 11 | 0.85 |
| 1739522 | C | 1.45 | 1.12 0.11 | 320 | 0.45 0.08 | 3140 | 115 | 35 | -46.6 | 1030 | 693 | 8 | 0.96 |
| 1741038 | C | 4.16 | 3.73 0.58 | 160 | 0.34 0.13 | 2470 | 448 | 38 | -4.7 | 3210 | 1293 | 41 | 0.87 |
| 1749096 | C | 4.03 | 2.37 0.50 | 70 | 1.47 0.14 | 2470 | 390 | 46 | -7.6 | 2388 | 1978 | 26 | 0.89 |
| 1800440 | B | 1.07 | 0.71 0.11 | 60 | 0.18 0.07 | 3140 | 170 | 49 | -18.8 | 508 | 357 | 11 | 1.00 |
| 1803784 | C | 1.48 | 1.00 0.19 | 240 | 0.21 0.06 | 3140 | 85 | 38 | -39.4 | 996 | 382 | 5 | 0.89 |
| 1807698 | A | 1.54 | 0.25 0.05 | 200 | 0.22 0.07 | 2360 | 181 | 49 | 84.7 | 231 | 225 | 7 | 0.75 |
| 1823568 | A | 1.30 | 0.21 0.08 | 100 | 0.29 0.09 | 3080 | 130 | 50 | 24.5 | 1000 | 332 | 14 | 0.91 |
| 1828487 | A | 1.96 | 0.87 0.45 | 220 | 0.18 0.04 | 2940 | 182 | 65 | -47.2 | 1995 | 587 | 19 | 0.76 |
| 1842681 | A | 0.74 | 0.24 0.03 | 120 | 0.10 0.02 | 3110 | 162 | 50 | 24.1 | 259 | 159 | 7 | 0.79 |
| 1901319 | C | 0.59 | 0.27 0.06 | 50 | 0.12 0.05 | 2370 | 312 | 94 | -12.3 | 248 | 185 | 6 | 0.70 |
| 1921293 | A | … | 2.78 0.41 | 60 | 0.22 0.11 | 1770 | 727 | 102 | -24.0 | 2896 | 1477 | 44 | 0.67 |
| 1923210 | B | 1.73 | 1.22 0.17 | 60 | 0.23 0.04 | 2470 | 280 | 46 | -10.1 | 919 | 443 | 13 | 0.93 |
| 1928738 | A | 2.60 | 0.62 0.18 | 60 | 0.14 0.03 | 3130 | 106 | 57 | 41.1 | 487 | 294 | 9 | 0.86 |
| C | 2.43 | 0.75 0.33 | 60 | 0.27 0.07 | 3120 | 132 | 43 | -9.6 | 1383 | 325 | 24 | 0.85 | |
| 1954513 | C | 0.66 | 0.35 0.13 | 70 | 0.25 0.05 | 3110 | 137 | 49 | -44.4 | 354 | 276 | 13 | 1.06 |
| 1957405 | C | … | 0.17 0.08 | 480 | 0.13 0.04 | 2080 | 175 | 58 | -45.5 | 192 | 133 | 22 | 0.57 |
| 2007777 | A | 0.92 | 0.37 0.13 | 250 | 0.21 0.06 | 3130 | 108 | 39 | 64.8 | 352 | 215 | 6 | 1.00 |
| 2013370 | B | 2.89 | 2.07 0.21 | 60 | 0.29 0.10 | 3070 | 206 | 47 | -13.0 | 2083 | 958 | 26 | 0.89 |
| 2023336 | B | 1.77 | 0.98 0.27 | 60 | 0.18 0.12 | 2920 | 227 | 48 | -13.7 | 825 | 402 | 19 | 0.82 |
| 2037511 | B | 1.44 | 0.74 0.14 | 180 | 0.31 0.06 | 3130 | 146 | 46 | -37.3 | 596 | 317 | 16 | 0.87 |
| 2121053 | A | … | 0.39 0.10 | 350 | 0.11 0.02 | 2350 | 296 | 42 | -4.7 | 391 | 247 | 14 | 0.62 |
| 2128123 | A | … | 0.31 0.13 | 70 | 0.17 0.05 | 480 | 772 | 335 | -17.8 | 338 | 212 | 10 | 0.72 |
| 2134004 | A | 2.03 | 0.28 0.10 | 140 | 0.25 0.08 | 2350 | 346 | 44 | -5.3 | 186 | 187 | 18 | 0.68 |
| 2155152 | B | … | 0.38 0.10 | 190 | 0.16 0.09 | 1280 | 476 | 119 | -14.7 | 369 | 224 | 7 | 0.74 |
| 2200420 | A | 3.57 | 1.41 0.11 | 110 | 0.96 0.09 | 2400 | 326 | 48 | -20.5 | 1495 | 1137 | 17 | 0.67 |
| 2201315 | A | 2.97 | 1.02 0.31 | 220 | 0.60 0.19 | 710 | 287 | 169 | 75.3 | 1098 | 783 | 30 | 0.78 |
| 2216038 | B | 0.97 | 0.50 0.08 | 100 | 0.31 0.11 | 480 | 722 | 294 | -35.9 | 444 | 391 | 11 | 0.54 |
| 2223052 | B | 3.90 | 1.29 0.15 | 80 | 0.19 0.07 | 2460 | 399 | 48 | -4.7 | 1556 | 382 | 17 | 0.76 |
| 2234282 | A | 1.03 | 0.66 0.00 | 70 | 0.13 0.03 | 2320 | 242 | 58 | -22.5 | 365 | 271 | 13 | 0.77 |
| 2251158 | A | 5.97 | 1.67 0.17 | 110 | 0.92 0.11 | 2430 | 292 | 55 | -10.8 | 4084 | 865 | 18 | 0.86 |
| 2255282 | A | … | 1.56 0.40 | 30 | 0.84 0.26 | 600 | 2856 | 207 | -31.1 | 1861 | 1475 | 45 | 0.69 |
| B | … | 0.73 0.24 | 90 | 0.53 0.13 | 1280 | 666 | 129 | -23.3 | 1007 | 981 | 51 | 0.70 | |
| 2345167 | B | … | 0.33 0.14 | 70 | 0.24 0.00 | 340 | 1077 | 500 | 4.0 | 349 | 281 | 16 | 0.58 |
Note. — Column designation: 1 - source name; 2 - observing epochs: A - October 2001; B - April 2002; C - October 2002; 3 - total flux density [Jy] (obtained from pointing and calibration scan measurements made at Pico Veleta); 4,6 - correlated flux density [Jy] measured on baselines 5,7 [M]; 8-10 - restoring beam: 8 - major axis [as]; 9 - minor axis [as]; 10 - position angle of the major axis []; 11 - total CLEAN flux density [mJy]; 12 - peak flux density [mJy/beam]; 13 - off-source RMS in the image [mJy/beam]; 14 - quality of the residual noise in the image.
| Name | Obs | ||||||
|---|---|---|---|---|---|---|---|
| (1) | (2) | (3) | (4) | (5) | (6) | (7) | (8) |
| 0003066 | C | 21089 | 19360 | 40 | … | … | 2.9 |
| 20378 | 13844 | 4815 | 5808 | -3.0 0.8 | 1.91.2 | ||
| 8842 | 8730 | 46 | 8048 | 5.1 0.6 | 0.91 | ||
| 0007106 | C | 18593 | 19667 | 53 | … | … | 1.2 |
| 4863 | 6551 | 155 | 46160 | -138.3 7.4 | 0.036 | ||
| 0016731 | B | 312293 | 197157 | 28 | … | … | 18 |
| 5151 | 5638 | 6544 | 11522 | 114.610.8 | 0.550.77 | ||
| 0048097 | C | 26873 | 17941 | 4210 | … | … | 2.51.1 |
| 6332 | 5320 | 42 | 2668 | 6.3 1.7 | 0.6 | ||
| 7677 | 4438 | 127111 | 76055 | 7.7 4.2 | 0.0770.14 | ||
| 0106013 | A | 431125 | 35179 | 368 | … | … | 177.7 |
| 0119041 | C | 21798 | 22871 | 65 | … | … | 1.4 |
| 0119115 | C | 20172 | 18448 | 30 | … | … | 5.9 |
| 0133476 | A | 971180 | 689104 | 477 | … | … | 134.1 |
| 28486 | 19448 | 5113 | 976 | -70.2 3.7 | 3.31.7 | ||
| 464336 | 154106 | 212146 | 82273 | -10.7 5.1 | 0.320.43 | ||
| 0133476 | B | 1771725 | 1060372 | 4716 | … | … | 2417 |
| 670581 | 179150 | 206172 | 124786 | -1.9 4.0 | 0.480.81 | ||
| 267236 | 171127 | 194144 | 180772 | -14.3 2.3 | 0.220.33 | ||
| 301313 | 9594 | 317314 | 2803157 | -26.1 3.2 | 0.0910.18 | ||
| 208190 | 138105 | 498380 | 3776190 | -29.9 2.9 | 0.0260.039 | ||
| 0149218 | A | 427149 | 18459 | 6621 | … | … | 3.72.4 |
| 0149218 | C | 494209 | 303109 | 6122 | … | … | 5.13.6 |
| 0201113 | C | 16026 | 15918 | 15 | … | … | 51 |
| 5825 | 3814 | 6222 | 31511 | -20.8 2.0 | 1.10.82 | ||
| 0202149 | A | 246119 | 18371 | 34 | … | … | 4.8 |
| 13266 | 5726 | 8137 | 7819 | -93.613.4 | 0.460.43 | ||
| 0202319 | C | 532288 | 269130 | 6230 | … | … | 5.65.4 |
| 11681 | 8046 | 36 | 8910 | 65.1 6.7 | 3.5 | ||
| 0212735 | A | 16220 | 13713 | 293 | … | … | 112 |
| 0212735 | B | 16498 | 18473 | 184 | … | … | 0.27 |
| 359345 | 7772 | 457429 | 668214 | 113.517.8 | 0.0950.18 | ||
| 0218357 | C | 15494 | 11857 | 34 | … | … | 4.3 |
| 0221067 | C | 35589 | 29957 | 489 | … | … | 3.81.5 |
| 0224671 | B | 287178 | 219108 | 33 | … | … | 6.6 |
| 0234285 | A | 1250504 | 368142 | 6525 | … | … | 118.3 |
| 8084 | 6955 | 55 | 8422 | 128.114.6 | 0.96 | ||
| 611318 | 217106 | 6130 | 13915 | 20.3 6.1 | 65.8 | ||
| 423384 | 10189 | 8373 | 15037 | -161.513.7 | 2.23.9 | ||
| 0234285 | B | 1312349 | 604146 | 6616 | … | … | 115.3 |
| 672350 | 260126 | 8642 | 7621 | 12.215.4 | 3.33.2 | ||
| 505303 | 302155 | 6131 | 12116 | -170.9 7.4 | 4.95.1 | ||
| 0234285 | C | 986207 | 799131 | 396 | … | … | 247.7 |
| 48550 | 39231 | 423 | 2402 | -32.2 0.4 | 101.6 | ||
| 21824 | 17215 | 454 | 8382 | -17.8 0.1 | 3.90.67 | ||
| 0235164 | A | 38574 | 38852 | 13 | … | … | 69 |
| 678401 | 15891 | 8348 | 6824 | -89.619.4 | 3.13.6 | ||
| 0238084 | B | 26786 | 14240 | 4713 | … | … | 21.1 |
| 0238084 | C | 292100 | 25265 | 47 | … | … | 2.2 |
| 0300470 | B | 965317 | 26082 | 7323 | … | … | 31.9 |
| 6356 | 4030 | 5440 | 27620 | 126.3 4.2 | 0.350.54 | ||
| 0316413 | A | 724167 | 43186 | 5110 | … | … | 4.71.9 |
| 247109 | 19267 | 4114 | 1617 | 140.3 2.5 | 2.51.7 | ||
| 813383 | 19891 | 238109 | 43855 | 175.9 7.1 | 0.240.22 | ||
| 305173 | 12264 | 11963 | 104331 | -149.7 1.7 | 0.360.38 | ||
| 476425 | 9180 | 387339 | 1412170 | -160.1 6.8 | 0.0530.093 | ||
| 0316413 | B | 47459 | 39438 | 464 | … | … | 3.70.72 |
| 224109 | 18870 | 6223 | 39012 | -177.4 1.7 | 0.970.73 | ||
| 272130 | 15263 | 275114 | 85357 | -161.6 3.8 | 0.060.05 | ||
| 362289 | 12896 | 579435 | 2729218 | -165.9 4.6 | 0.0180.027 | ||
| 0316413 | C | 599129 | 35165 | 6212 | … | … | 2.60.97 |
| 13840 | 12527 | 286 | 2503 | 160.4 0.7 | 2.91.3 | ||
| 207111 | 9044 | 14471 | 50535 | 168.7 4.0 | 0.170.16 | ||
| 4444 | 5133 | 64 | 74921 | -159.4 1.6 | 0.18 | ||
| 5148 | 5535 | 58 | 105219 | -143.3 1.0 | 0.25 | ||
| 0333321 | A | 384135 | 28280 | 329 | … | … | 147.9 |
| 208169 | 8866 | 5642 | 7221 | -75.516.2 | 2.53.7 | ||
| 147153 | 5856 | 7270 | 14435 | -89.213.6 | 1.12 | ||
| 0336019 | A | 832138 | 49971 | 6710 | … | … | 5.61.6 |
| 477141 | 30877 | 5915 | 1997 | 89.8 2.1 | 4.22.1 | ||
| 706177 | 28165 | 13030 | 101115 | 58.9 0.9 | 1.30.59 | ||
| 0355508 | A | 1184776 | 637368 | 8247 | … | … | 2.93.4 |
| 239251 | 277190 | 60 | 15221 | 66.3 7.7 | 1.1 | ||
| 415236 | 440172 | 32 | 2486 | 136.4 1.4 | 6.8 | ||
| 209251 | 249192 | 70 | 36327 | 49.1 4.3 | 0.7 | ||
| 0355508 | C | 2953831 | 2557544 | 6313 | … | … | 125.2 |
| 1064629 | 769368 | 17383 | 37041 | 89.8 6.4 | 0.580.56 | ||
| 0415379 | B | 1307922 | 556361 | 6542 | … | … | 5.36.9 |
| 374264 | 198123 | 8754 | 27227 | 74.3 5.7 | 0.851.1 | ||
| 147205 | 161152 | 119112 | 165256 | 52.3 1.9 | 0.180.36 | ||
| 0415379 | C | 1104741 | 455282 | 6842 | … | … | 4.15.1 |
| 425159 | 22975 | 6220 | 9310 | 78.8 6.3 | 1.91.3 | ||
| 0420022 | C | 23068 | 17341 | 4310 | … | … | 6.73.2 |
| 0420014 | B | 1332493 | 902276 | 4714 | … | … | 1912 |
| 156137 | 177103 | 86 | 79925 | -167.9 1.8 | 0.66 | ||
| 0422004 | B | 629416 | 426233 | 49 | … | … | 5.6 |
| 0430052 | B | 805279 | 526153 | 4212 | … | … | 7.74.5 |
| 22714 | 21510 | 110 | 1480 | -114.8 0.1 | 322.8 | ||
| 747231 | 32291 | 7722 | 29411 | -112.2 2.1 | 2.11.2 | ||
| 563172 | 24068 | 8023 | 56711 | -112.6 1.1 | 1.50.84 | ||
| 573221 | 24687 | 8731 | 86615 | -115.2 1.0 | 1.30.91 | ||
| 1027856 | 252204 | 218176 | 117688 | -120.1 4.3 | 0.370.59 | ||
| 0430052 | C | 668157 | 566101 | 346 | … | … | 9.83.5 |
| 331137 | 22477 | 9131 | 6716 | -116.813.1 | 0.680.47 | ||
| 9687 | 11366 | 113 | 66433 | -108.7 2.9 | 0.13 | ||
| 14871 | 10942 | 10038 | 137419 | -118.0 0.8 | 0.250.19 | ||
| 7785 | 10668 | 14896 | 264548 | -121.6 1.0 | 0.060.083 | ||
| 0440003 | C | 364162 | 330109 | 46 | … | … | 5.2 |
| 6254 | 7040 | 98 | 30928 | -175.5 5.2 | 0.2 | ||
| 0458020 | B | 50185 | 37050 | 476 | … | … | 123.3 |
| 0521365 | C | 33127 | 30318 | 795 | … | … | 0.920.11 |
| 0528134 | A | 510219 | 405136 | 32 | … | … | 25 |
| 268103 | 16053 | 5819 | 9810 | 120.5 5.6 | 42.7 | ||
| 8523 | 8716 | 23 | 2172 | 70.0 0.6 | 8 | ||
| 11469 | 7337 | 6935 | 81518 | 35.7 1.2 | 1.21.2 | ||
| 0529075 | A | 25951 | 26036 | 27 | … | … | 13 |
| 0552398 | A | 48052 | 36231 | 353 | … | … | 223.7 |
| 12837 | 10223 | 266 | 483 | 68.9 3.5 | 104.7 | ||
| 12780 | 5733 | 8549 | 22425 | 112.0 6.2 | 0.971.1 | ||
| 0607157 | B | 965137 | 81488 | 859 | … | … | 2.90.63 |
| 13239 | 11726 | 5613 | 3406 | -53.1 1.1 | 0.920.41 | ||
| 4249 | 6541 | 270 | 39985 | 72.612.0 | 0.013 | ||
| 0642449 | B | 59095 | 35249 | 527 | … | … | 164.4 |
| 585180 | 16449 | 29086 | 17343 | 98.413.9 | 0.50.3 | ||
| 11969 | 5730 | 15480 | 119740 | 87.6 1.9 | 0.360.38 | ||
| 0707476 | C | 839 | 726 | 212 | … | … | 7.11.1 |
| 0716714 | B | 545276 | 398163 | 3414 | … | … | 7.76.4 |
| 0716714 | C | 1048304 | 872195 | 225 | … | … | 3616 |
| 0727115 | B | 64066 | 57344 | 14211 | … | … | 1.40.21 |
| 0735178 | B | 26466 | 9823 | 9222 | … | … | 0.730.34 |
| 14240 | 10824 | 317 | 1073 | 88.8 1.9 | 3.51.6 | ||
| 10335 | 6018 | 5015 | 2677 | 78.3 1.6 | 0.960.57 | ||
| 12154 | 5522 | 7731 | 43516 | 29.3 2.1 | 0.480.39 | ||
| 12227 | 5611 | 7114 | 6987 | 43.5 0.6 | 0.570.22 | ||
| 0736017 | A | 832352 | 589203 | 4014 | … | … | 107 |
| 387129 | 23266 | 6017 | 1299 | -94.6 3.8 | 2.11.2 | ||
| 329144 | 21579 | 5018 | 2009 | -92.2 2.6 | 2.61.9 | ||
| 160190 | 119114 | 124118 | 41359 | -67.2 8.2 | 0.20.4 | ||
| 0738313 | C | 426207 | 262108 | 5824 | … | … | 3.42.8 |
| 4437 | 4827 | 69 | 80120 | -167.6 1.4 | 0.25 | ||
| 0748126 | B | 571138 | 49690 | 234 | … | … | 3312 |
| 430135 | 25870 | 4713 | 2376 | 77.4 1.5 | 63.3 | ||
| 17973 | 11239 | 4215 | 4897 | 77.5 0.8 | 3.12.2 | ||
| 0804499 | C | 14038 | 11324 | 306 | … | … | 6.22.6 |
| 0814425 | C | 31198 | 17147 | 5816 | … | … | 2.31.3 |
| 0823033 | A | 374161 | 21179 | 4316 | … | … | 53.8 |
| 262204 | 5743 | 10076 | 6938 | 87.128.9 | 0.650.99 | ||
| 0827243 | B | 598222 | 557151 | 30 | … | … | 21 |
| 0836710 | C | 583508 | 375275 | 42 | … | … | 17 |
| 0850581 | C | 10430 | 7718 | 358 | … | … | 3.21.5 |
| 0851202 | B | 618186 | 533121 | 266 | … | … | 209 |
| 150118 | 11672 | 14489 | 105445 | -118.5 2.4 | 0.160.2 | ||
| 0859470 | C | 22259 | 18037 | 276 | … | … | 125.1 |
| 9147 | 4219 | 6430 | 65215 | 9.4 1.3 | 0.90.84 | ||
| 0906015 | B | 670345 | 489204 | 40 | … | … | 14 |
| 0917624 | A | 13568 | 11444 | 3714 | … | … | 43.1 |
| 0945408 | A | 36349 | 23927 | 526 | … | … | 51.1 |
| 246175 | 13986 | 11873 | 85236 | 159.2 2.4 | 0.650.81 | ||
| 0954658 | A | 325187 | 282122 | 28 | … | … | 9.5 |
| 223134 | 17482 | 3215 | 968 | -80.2 4.5 | 4.94.7 | ||
| 9670 | 6941 | 7846 | 66523 | -60.1 2.0 | 0.350.42 | ||
| 1012232 | B | 30575 | 18839 | 4610 | … | … | 3.71.6 |
| 23965 | 10927 | 6516 | 3248 | 100.4 1.4 | 1.50.72 | ||
| 11243 | 4215 | 8631 | 59315 | 118.3 1.5 | 0.390.28 | ||
| 1044719 | B | 20496 | 18063 | 30 | … | … | 8.3 |
| 1101384 | C | 264154 | 15979 | 4522 | … | … | 2.22.2 |
| 4625 | 2612 | 7133 | 105217 | -80.6 0.9 | 0.150.14 | ||
| 1128385 | C | 504266 | 273127 | 5325 | … | … | 8.17.5 |
| 4447 | 6038 | 75 | 20824 | -156.9 6.5 | 0.35 | ||
| 1150497 | C | 455165 | 376105 | 278 | … | … | 147.7 |
| 6936 | 7626 | 41 | 1357 | -155.7 3.0 | 0.9 | ||
| 7852 | 6333 | 7941 | 65121 | -129.7 1.8 | 0.270.29 | ||
| 1156295 | A | 1629388 | 919191 | 429 | … | … | 2611 |
| 1143379 | 517156 | 4915 | 797 | 66.7 5.4 | 148.2 | ||
| 177143 | 191105 | 45 | 8812 | 11.1 7.9 | 2.5 | ||
| 1219285 | C | 15522 | 10712 | 374 | … | … | 20.48 |
| 3717 | 239 | 4517 | 1689 | 125.3 2.9 | 0.330.25 | ||
| 1226023 | A | 828435 | 584251 | 4318 | … | … | 8.57.4 |
| 698404 | 291155 | 14175 | 12138 | -92.217.3 | 0.670.71 | ||
| 377300 | 279178 | 10768 | 42034 | 54.0 4.7 | 0.630.81 | ||
| 1228126 | A | 1046254 | 624130 | 9921 | … | … | 1.80.74 |
| 1253055 | C | 56152493 | 44531549 | 40 | … | … | 89 |
| 1308326 | A | 640219 | 482132 | 349 | … | … | 189.9 |
| 10641 | 8626 | 3611 | 3365 | -79.0 0.9 | 2.71.6 | ||
| 1502106 | C | 360102 | 31267 | 25 | … | … | 27 |
| 7725 | 6115 | 4311 | 5195 | 127.2 0.6 | 1.90.99 | ||
| 9257 | 5228 | 14881 | 143240 | 135.4 1.6 | 0.20.21 | ||
| 1508055 | C | 503153 | 31882 | 6316 | … | … | 4.62.4 |
| 270201 | 207122 | 6740 | 77620 | 88.6 1.5 | 2.22.6 | ||
| 199171 | 154105 | 8054 | 133227 | 59.9 1.2 | 1.11.5 | ||
| 1510089 | C | 668414 | 538260 | 46 | … | … | 7 |
| 483141 | 23963 | 6417 | 6958 | -6.4 0.7 | 2.61.4 | ||
| 1511100 | C | 33684 | 27152 | 316 | … | … | 145.6 |
| 246101 | 14251 | 5419 | 29310 | 89.0 1.9 | 3.52.5 | ||
| 1546027 | C | 306246 | 228147 | 58 | … | … | 2.1 |
| 223111 | 14260 | 4619 | 33310 | -176.7 1.7 | 2.42.1 | ||
| 1548056 | C | 367177 | 270105 | 38 | … | … | 10 |
| 241130 | 16874 | 5926 | 120113 | 1.9 0.6 | 2.82.4 | ||
| 1606106 | C | 342103 | 34573 | 29 | … | … | 15 |
| 1637574 | C | 1145323 | 777181 | 327 | … | … | 3215 |
| 14856 | 11935 | 299 | 584 | -123.3 4.2 | 5.13 | ||
| 5351 | 6639 | 43 | 14213 | -146.7 5.2 | 0.81 | ||
| 1642690 | C | 597396 | 389216 | 3318 | … | … | 1618 |
| 1652398 | A | 28350 | 15224 | 18830 | … | … | 0.140.043 |
| 1655077 | C | 459157 | 33793 | 3510 | … | … | 105.5 |
| 4341 | 4529 | 80 | 21126 | -26.1 7.1 | 0.18 | ||
| 1739522 | C | 979292 | 688168 | 297 | … | … | 4522 |
| 13060 | 13343 | 19 | 483 | 41.7 3.7 | 14 | ||
| 1741038 | C | 2404860 | 868292 | 6622 | … | … | 1913 |
| 656550 | 218173 | 9273 | 21037 | -122.9 9.9 | 2.64.2 | ||
| 1749096 | C | 2375510 | 1977326 | 295 | … | … | 6120 |
| 1800440 | B | 43284 | 37655 | 264 | … | … | 175.2 |
| 5753 | 7242 | 60 | 10117 | -88.4 9.7 | 0.43 | ||
| 1803784 | C | 785306 | 324117 | 5219 | … | … | 85.8 |
| 296371 | 4758 | 92114 | 13257 | -135.323.3 | 0.972.4 | ||
| 1807698 | A | 21866 | 22848 | 19 | … | … | 10 |
| 1823568 | A | 485202 | 380124 | 3110 | … | … | 149.1 |
| 21297 | 11847 | 11144 | 50322 | -157.2 2.5 | 0.470.38 | ||
| 334181 | 12162 | 18996 | 112948 | -168.4 2.4 | 0.260.26 | ||
| 295159 | 11658 | 14171 | 155135 | -171.2 1.3 | 0.410.41 | ||
| 1828487 | A | 1183331 | 708170 | 11227 | … | … | 2.61.3 |
| 232127 | 22589 | 5120 | 96310 | -55.1 0.6 | 2.52 | ||
| 952571 | 333189 | 210119 | 398259 | -31.4 0.9 | 0.60.68 | ||
| 1842681 | A | 20494 | 15857 | 3011 | … | … | 5.54 |
| 8330 | 6519 | 4212 | 1356 | 117.5 2.6 | 1.10.66 | ||
| 1901319 | C | 21263 | 18842 | 429 | … | … | 3.21.4 |
| 5936 | 4421 | 232113 | 116457 | 114.2 2.8 | 0.0290.029 | ||
| 1921293 | A | 2069549 | 1594335 | 10823 | … | … | 3.91.7 |
| 328234 | 272150 | 214118 | 103059 | -12.0 3.3 | 0.160.18 | ||
| 313230 | 264148 | 250140 | 108870 | -37.3 3.7 | 0.110.13 | ||
| 1923210 | B | 574160 | 41594 | 419 | … | … | 5.62.5 |
| 387181 | 17675 | 15064 | 18632 | -114.7 9.7 | 0.280.24 | ||
| 1928738 | A | 349137 | 25681 | 4013 | … | … | 4.73 |
| 14948 | 10628 | 4612 | 566 | -6.7 6.1 | 1.50.79 | ||
| 1928738 | C | 656395 | 461227 | 5125 | … | … | 5.45.4 |
| 618554 | 264218 | 166137 | 103768 | 140.8 3.8 | 0.480.79 | ||
| 1954513 | C | 279123 | 27987 | 247 | … | … | 1811 |
| 1957405 | C | 17865 | 14441 | 339 | … | … | 2.81.6 |
| 2007777 | A | 19549 | 19635 | 11 | … | … | 37 |
| 10885 | 4834 | 7654 | 7127 | -77.721.0 | 0.410.59 | ||
| 2013370 | B | 1252213 | 1005133 | 345 | … | … | 184.7 |
| 307123 | 25679 | 4012 | 1956 | 176.4 1.8 | 3.21.9 | ||
| 2023336 | B | 579157 | 507104 | 439 | … | … | 6.32.6 |
| 17687 | 15457 | 8933 | 29417 | -15.9 3.2 | 0.440.33 | ||
| 2037511 | B | 34548 | 31632 | 192 | … | … | 428.6 |
| 11688 | 9054 | 6941 | 15221 | -134.0 7.7 | 1.11.3 | ||
| 2121053 | A | 414159 | 23077 | 4816 | … | … | 8.75.9 |
| 2128123 | A | 23723 | 21215 | 15811 | … | … | 0.230.034 |
| 6661 | 7245 | 353222 | 1210111 | 26.9 5.2 | 0.0130.017 | ||
| 2134004 | A | 220147 | 18494 | 48 | … | … | 4.6 |
| 2155152 | B | 29365 | 25442 | 6411 | … | … | 20.66 |
| 10433 | 6618 | 16846 | 72023 | 35.1 1.8 | 0.10.055 | ||
| 2200420 | A | 113783 | 113658 | 6 | … | … | 550 |
| 16880 | 15454 | 37 | 1597 | -138.8 2.4 | 2.1 | ||
| 2201315 | A | 817349 | 700227 | 5919 | … | … | 53.3 |
| 341268 | 12794 | 242178 | 25889 | 63.419.1 | 0.120.18 | ||
| 2216038 | B | 45872 | 40748 | 15719 | … | … | 0.580.14 |
| 2223052 | B | 642129 | 39567 | 5910 | … | … | 7.32.5 |
| 28387 | 20551 | 4712 | 3476 | 146.6 1.0 | 5.12.5 | ||
| 18375 | 11139 | 6523 | 48011 | 146.8 1.4 | 1.71.2 | ||
| 13980 | 6634 | 7237 | 73619 | 91.2 1.5 | 1.11.1 | ||
| 2234282 | A | 405179 | 278101 | 5219 | … | … | 4.43.2 |
| 2251158 | A | 696332 | 764246 | 41 | … | … | 13 |
| 138145 | 189117 | 97 | 10530 | -116.516.0 | 0.45 | ||
| 238159 | 267119 | 57 | 24713 | -100.2 2.9 | 2.2 | ||
| 275207 | 268145 | 60 | 33916 | -105.2 2.7 | 2.3 | ||
| 124167 | 172135 | 131 | 61852 | -105.6 4.8 | 0.22 | ||
| 354308 | 214159 | 193143 | 232372 | -97.4 1.8 | 0.290.43 | ||
| 2255282 | A | 1868330 | 1470204 | 17124 | … | … | 20.56 |
| 2255282 | B | 993403 | 981283 | 77 | … | … | 5.3 |
| 2345167 | B | 365112 | 29470 | 28869 | … | … | 0.110.054 |
| 5957 | 7946 | 512 | 1259148 | 121.7 6.7 | 0.0058 |
Note. — Column designation: 1 - source name; 2 - observing epoch: A - October 2001; B - April 2002; C - October 2002; 3 - model flux density of the component [mJy]; 4 - peak brightness of individual component measured in the image [mJy/beam]; 5 - size [as]: italic numbers indicate upper limits; 6 - radius [as]; 7 - position angle []; 8 - measured brightness temperature [K]: italic numbers indicate lower limits.
| [Jy] | |||||||||
|---|---|---|---|---|---|---|---|---|---|
| Sample | Number | Mean | Median | Mean | Median | Mean | Median | ||
| IDV | 26 | 0.360.06 | 0.26 | 0.530.08 | 0.46 | 0.750.04 | 0.78 | ||
| non-IDV | 83 | 0.310.04 | 0.21 | 0.510.04 | 0.44 | 0.760.03 | 0.75 | ||
| [Jy] | [mas] | ||||||||
| Sample | Number | Mean | Median | Mean | Median | Mean | Median | ||
| IDV | 26 | 0.700.11 | 0.42 | 0.0390.004 | 0.035 | 11.10.1 | 11.1 | ||
| non-IDV | 83 | 0.620.08 | 0.46 | 0.0570.005 | 0.043 | 10.80.1 | 10.8 | ||
Note. — Each mean value is presented with its corresponding 1- error, assuming a normal distribution.