Ab-initio study of the vibrational properties of crystalline TeO2: the , , and phases
Abstract
Based on density functional perturbation theory, we have studied the vibrational properties of three crystalline phases of tellurium dioxide: paratellurite -TeO2, tellurite -TeO2 and the new phase -TeO2, recently identified experimentally. Calculated Raman and IR spectra are in good agreement with available experimental data. The vibrational spectra of - and -TeO2 can be interpreted in terms of vibrations of TeO2 molecular units.
I Introduction
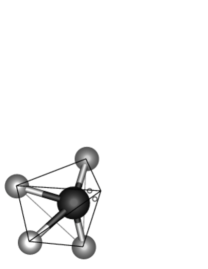
Tellurium oxide (TeO2) and TeO2-based glasses are promising active materials for optical switching devices due to their large non-linear polarizabilitytghandbook and for optical amplifiers due to their large cross section for Stimulated Raman Scattering (SRS).daitassone ; ramangain Three crystalline phases of TeO2 are well documented. The paratellurite -TeO2 thomas and the tellurite -TeO2 beyer phases have been known for a long time. Recently, a third crystalline polymorph metastable at normal conditions, -TeO2, gamma1 ; gamma2 has been identified by x-ray powder diffraction of recrystallized tellurite glasses doped with metal oxides. The three phases can be described as different arrangements of corner sharing TeO4 unit (the distorted trigonal bipyramids in Fig. 1). These units have two longer bonds (axial bonds) and two shorter ones (equatorial bonds) whose length varies in the different phases. Paratellurite, -TeO2, has a 3-dimensional fully connected structure, while -TeO2 has a layered structure with weakly bonded sheets. In -TeO2, one bond is substantially larger than the other three and by breaking this latter bond in a 3-dimensional visualization of the network, a chain-like structure appears. The -TeO2 phase has then been described in terms of a polymeric form made of TeO3 units.gamma1 ; gamma2 By comparing the Raman spectra of TeO2 glasses with those of the crystalline phases, it has also been proposed that the chain-like structure of -TeO2 would represent the main structural feature of the glass.fononi_beta Theoretical lattice dynamics calculations of the phonon spectra of crystalline TeO2 have already appeared in literature, gamma2 ; fononi_gamma ; fononi_beta ; alfashell ; tesi based on empirical interatomic force constants from two- and three body interactions or shell models. alfashell The lattice dynamics calculations revealed that the phononic spectra of -TeO2 and -TeO2 can be well interpreted in terms of vibrations of weakly coupled TeO2 molecules.gamma2 ; tesi ; fononi_gamma ; fononi_beta Accordingly, tellurite and paratellurite would be seen as molecular crystals made of TeO2 molecules. The polymeric -TeO2 would represent a chain-like polymerization of TeO2 molecules giving rise to a structure more connected than paratellurite and tellurite phases.
In this paper, we investigate further the three crystalline phases of TeO2 (, , ) by computing their structural and vibrational properties from first principles. We aim at providing a compelling assignment of the experimental Raman and IR peaks to specific phonons which would allow to identify the vibrational signature of the different structural units in the crystals and in the glass.
After a brief description of our theoretical framework in section II, we present our results on the structural and electronic properties in section III and on the vibrational properties in section IV. Section V reports our conclusions.
II Computational details
Calculations are performed within the framework of Density Functional Theory (DFT) within the simple local density approximation (LDA) and with gradient corrected exchange and correlation energy functionals (PBE pbe and BLYP blyp ), as implemented in the codes PWSCF and PHONONS. pwscf Calculations are performed with ultrasoft pseudopotentials.vanderbilt Kohn-Sham (KS) orbitals are expanded in a plane waves basis up to a kinetic cutoff of 30 Ry. Brillouin Zone (BZ) integration has been performed over Monkhorst-Pack (MP) meshes of 888, 444 and 666 for -, -, and -TeO2, respectively. MP Equilibrium geometries have been obtained by optimizing the internal and lattice structural parameters at several volumes and fitting the energy versus volume data with a Murnaghan function. murna Residual anisotropy in the stress tensor at the optimized lattice parameters at each volume is below 0.6 kbar. Infrared and Raman spectra are obtained from effective charges, dielectric susceptibilities and phonons at the point within density functional perturbation theory. dfpt Effective charges have been computed with norm-conserving pseudopotentials,TM and a kinetic cutoff of 70 Ry. Relevant formula for the calculation of the IR and Raman spectra are given in section IV. Preliminary tests on the transferability of the pseudopotentials and on the accuracy of the exchange and correlation functionals have been performed on the structure and vibrational frequencies of the TeO2 molecule. Results are presented in Table 1 for PBE and BLYP functionals and compared with experimental data and previous B3LYP all-electrons calculations.
| Te-O (Å) | Te-O-Te (deg.) | ||||
|---|---|---|---|---|---|
| PBE | 1.832 | 111.7 | 266 | 804 | 806 |
| BLYP | 1.820 | 111.8 | 265 | 813 | 824 |
| B3LYP | 1.844 | 112.9 | 250 | 883 | 921 |
| Exp | 1.840 | 112 | 294 | 810 | 849 |
III Structural properties
III.1 -TeO2
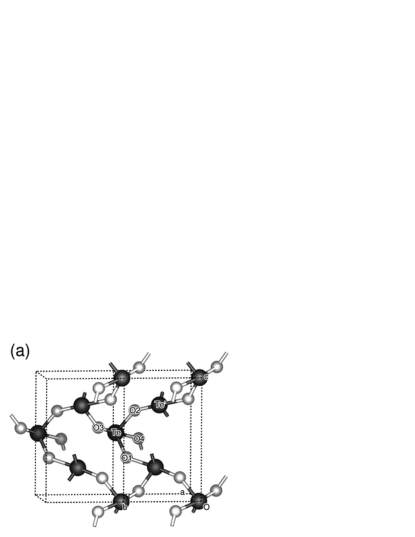
The paratellurite crystal (space group , , n. 92) has tetragonal symmetry with four formula units per unit cell. thomas Two atoms are independent by symmetry: one Te atom at position and one oxygen atom at position . The experimental and theoretical (LDA and PBE) lattice parameters and position of the symmetry independent atoms are given in table 2. As usual the LDA (GGA) underestimates (overestimates) the equilibrium volume with respect to experimental data. The bulk modulus and its derivative with respect to pressure obtained from the fitted Murnaghan equation of state (PBE functional) are =33.0 GPa and =8.1 to be compared with the experimental value of =45.3 GPa. bmodulus These results are in good agreement with previous all-electron calculations which confirms the transferability of our pseudopotentials. kleinman Concerning the internal structure of -TeO2, a Te atom is coordinated with four oxygen atoms, two equatorial atoms at closer distance (exp. 1.88 Å) and two axial atoms at larger distance (exp. 2.12 Å).thomas The structure can be seen as a network of corner-sharing TeO4 units (Fig. 2), the oxygen atoms bridging two Te atoms. The network is formed by six-membered rings of Te atoms with bridging oxygen atoms. As already mentioned, lattice dynamics calculations with empirical interatomic potentials suggest an alternative picture of -TeO2 as formed by weakly interacting TeO2 molecules. tesi ; fononi_gamma ; fononi_beta The calculated independent bond lengths and angles are compared with experimental data in Table 3 for LDA and PBE functionals at the theoretical equilibrium lattice parameters, and for PBE and BLYP functionals at the experimental lattice parameters. Although the error in the lattice parameters is within the expected accuracy for DFT calculations, the error in the bond lengths at the theoretical lattice parameters is somehow larger than usual (cfr. Table 3).
| LDA | PBE | PBEexp | BLYPexp | Exp | |
| Cell parameters (Å) | |||||
| a | 4.819 | 4.990 | - | - | 4.8082 |
| c | 7.338 | 7.546 | - | - | 7.612 |
| Atomic positions | |||||
| Te | 0.0025 | 0.0272 | 0.0156 | 0.0201 | 0.0268 |
| O | 0.1402 | 0.1467 | 0.1371 | 0.1388 | 0.1368 |
| O | 0.2379 | 0.2482 | 0.2492 | 0.2519 | 0.2576 |
| O | 0.2065 | 0.1968 | 0.1954 | 0.1926 | 0.1862 |

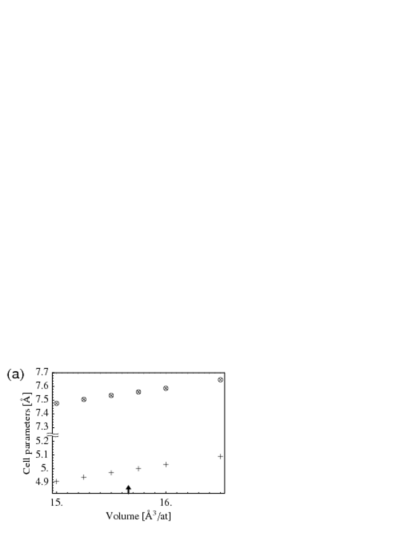
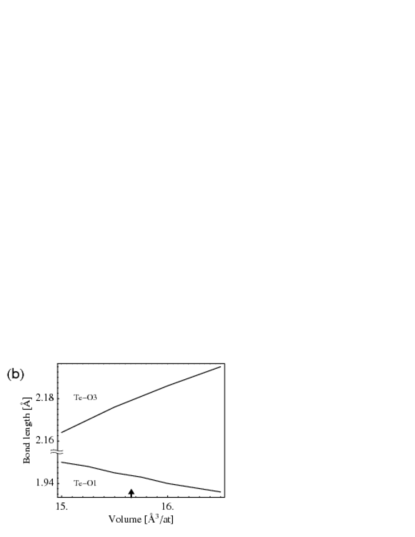
In particular the calculated equatorial and axial bond lengths are much closer to each other than in the experimental structure. This misfit is larger for LDA than for PBE functional, but it is sizably reduced by optimizing the internal geometry at the experimental lattice parameters with a marginal improvement for the BLYP functional (cfr. Table 3). The change in the lattice parameters, bond lengths and bond angles with volume is reported in Fig. 3. The increase of the ratio with pressure is in agreement with the experimental data of Ref. pressure_alfa . By increasing the volume, the length of the shorter equatorial bonds decreases while the longer axial bonds increases in length. This behavior would support the picture of -TeO2 as made of TeO2 molecules, inferred from previous lattice dynamics calculations tesi ; fononi_gamma ; fononi_beta which turns out to be in good agreement with our ab-initio phonon calculations reported in Sec. IV. Although useful for the analysis of the vibrational spectra, the picture of paratellurite as a molecular crystal does not account for all the properties of -TeO2. For instance, it can be hardly conciliated with the mostly ionic character and electronic bandwidths of several eV emerged from previous ab-initio calculations kleinman ; palmero .
| LDA | PBE | PBEexp | BLYPexp | Exp | |
| Bond lengths (Å) | |||||
| Te-O1 | 2.028 | 1.944 | 1.954 | 1.924 | 1.878 |
| Te-O3 | 2.170 | 2.118 | 2.145 | 2.134 | 2.122 |
| Te-Te’ | 3.855 | 3.838 | 3.806 | 3.779 | 3.742 |
| Angles (degrees) | |||||
| O1-Te-O2 | 99.8 | 103.6 | 103.6 | 103.7 | 103.4 |
| O3-Te-O4 | 161.5 | 171.2 | 165.3 | 166.7 | 168.0 |
| Te-O2-Te’ | 135.0 | 137.1 | 136.4 | 137.2 | 138.6 |
III.2 -TeO2
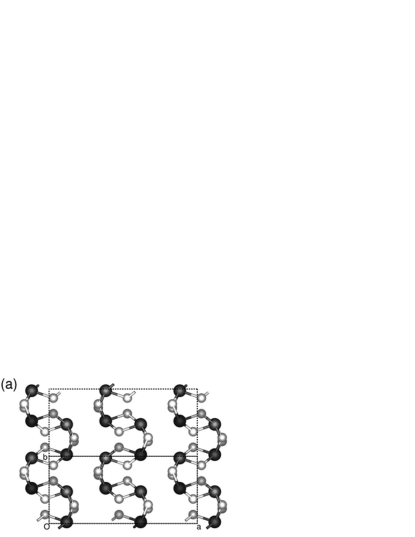
The tellurite crystal (space group , , n. 61) has orthorhombic symmetry with eight formula units per unit cell.beyer Two oxygen and one tellurium atoms are independent by symmetry. The experimental and theoretical (PBE) lattice parameters and positions of the symmetry independent atoms are given in table 4. The structural unit of -TeO2 is still a TeO4 trigonal bipyramid, as in -TeO2, which forms a network by sharing vertices (bridging oxygen atoms). However, as opposed to paratellurite, the -TeO2 crystal has a layered structure with layers oriented perpendicular to the axis (Fig. 4) and an interlayer distance of 3 Å. beyer We can still recognize two longer axial bonds and two shorter equatorial bonds, but here all the four bonds of the TeO4 unit differ in length. The 2D network is formed by two- and six-membered Te rings. Still, -TeO2 as well can be seen as a molecular crystal made of TeO2 molecules according to lattice dynamics calculations. tesi ; fononi_gamma ; fononi_beta
| PBE | PBEexp | BLYPexp | Exp | |
| Cell parameters (Å) | ||||
| a | 12.232 | - | - | 12.035 |
| b | 5.523 | - | - | 5.464 |
| c | 5.803 | - | - | 5.607 |
| Atomic positions | ||||
| Te | 0.1173 | 0.1193 | 0.1189 | 0.1181 |
| Te | 0.0263 | 0.0184 | 0.0211 | 0.0252 |
| Te | 0.3748 | 0.3677 | 0.3682 | 0.3378 |
| O(1) | 0.0314 | 0.3235 | 0.0318 | 0.028 |
| O(1) | 0.6491 | 0.6422 | 0.6412 | 0.634 |
| O(1) | 0.1613 | 0.1721 | 0.1703 | 0.171 |
| O(2) | 0.1714 | 0.1743 | 0.1723 | 0.168 |
| O(2) | 0.2174 | 0.2108 | 0.2124 | 0.221 |
| O(2) | 0.0812 | 0.0694 | 0.0714 | 0.081 |
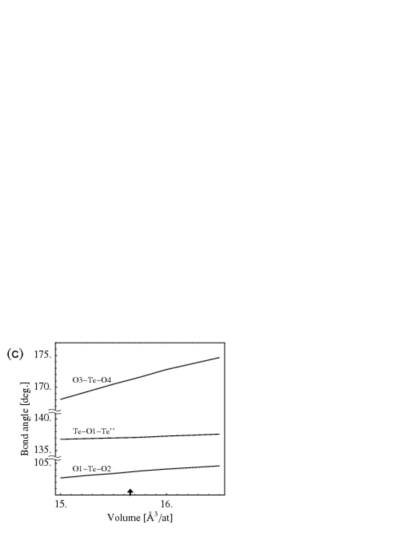
The calculated independent bond lengths and angles are compared with experimental data in Table 5 for PBE functional at the theoretical equilibrium lattice parameters, and for PBE and BLYP functionals at the experimental lattice parameters. The same comments on the internal structure presented for -TeO2 holds here for -TeO2. The spread in the bond lengths of the theoretical geometry at the theoretical lattice parameters (PBE) is reduced with respect to experiments. The misfit is reduced by optimizing the internal geometry at the experimental lattice parameters, with a marginal improvement for the BLYP over PBE functional. The error in the internal structure thus comes primarily from the overestimation of the equilibrium volume (6 ) by PBE functional. A possible source of error might be the neglect of van der Waals interactions among highly polarizable Te atoms, absent in LDA and GGA functionals, whose inclusion might bring theoretical and experimental lattice parameters to a closer agreement. The bulk modulus and its derivative with respect to pressure obtained from the fitted Murnaghan equation of state (PBE functional) are =18.4 GPa (B=33 GPa for -TeO2) and =18.1. The larger compressibility of -TeO2 with respect to -TeO2 is due to the weak interlayer interaction, as demonstrated by the evolution of the lattice parameters with volume reported in Fig. 5a. The axes, perpendicular to the layers, undergoes larger changes with pressure than the other two axes do. However the overestimation of the lattice parameters by the PBE functional is almost the same for all the three axes which implies that the interlayer interaction should have a strong electrostatic contribution. Would the interlayer cohesion be simply given by van der Waals interactions, absent in GGA functional, the overestimation of the axis by the PBE functional should have been much larger. The change of bond lengths and bond angles with volume is reported in Fig. 5b-c. By increasing the volume, the length of the shorter equatorial bonds decreases while the longer axial bonds increase in length. This behavior would support the picture of -TeO2 as made of TeO2 molecules, analogously to -TeO2.
| PBE | PBEexp | BLYPexp | Exp | |
| Bond lengths (Å) | ||||
| Te-O1 | 1.953 | 1.960 | 1.941 | 1.876 |
| Te-O2 | 1.968 | 1.975 | 1.967 | 1.893 |
| Te-O1’ | 2.192 | 2.186 | 2.181 | 2.153 |
| Te-O2’ | 2.110 | 2.083 | 2.067 | 2.068 |
| Te-Te’ | 3.232 | 3.240 | 3.230 | 3.168 |
| Angles (degrees) | ||||
| O1-Te-O2 | 97.4 | 96.8 | 96.9 | 98.8 |
| O1’-Te-O2’ | 169.5 | 168.9 | 168.6 | 165.9 |
| Te-O1-Te’ | 102.3 | 102.6 | 103.0 | 103.5 |


III.3 -TeO2
This phase has been recently identified by recrystallizing amorphous TeO2 doped with oxide (Nb, W oxides, 10 molar). gamma1 ; gamma2 The structure is orthorhombic (space group , , n. 19) with four formula units and three independent atoms per cell. The theoretical (PBE) and experimental lattice parameters and the positions of the independent atoms are reported in table 6. The error in the theoretical equilibrium volume (11 ) and lattice parameters (3 ) is slightly larger for -TeO2 than for the other phases. The structure of -TeO2 can still be seen as formed by corner sharing TeO4 units with two-fold coordinated oxygen atoms and four-fold coordinated Te atoms. However, the difference in length of the four bonds is 0.34 Å, a value sizably larger than in the other phases (0.27 Å for -TeO2 and 0.24 Å for -TeO2). By considering the longest bond (2.198 Å) as a non-bonding interaction, -TeO2 would appear as a network of TeO3 units with Te atoms three-fold coordinated, two oxygen atoms two-fold coordinated and one non-bridging one-fold coordinated oxygen atom.
| PBE | PBEexp | BLYPexp | Exp | |
| Cell parameters (Å) | ||||
| a | 5.176 | - | - | 4.898 |
| b | 8.797 | - | - | 8.576 |
| c | 4.467 | - | - | 4.351 |
| Atomic positions | ||||
| Te | 0.9581 | 0.9797 | 0.9771 | 0.9696 |
| Te | 0.1032 | 0.1003 | 0.1007 | 0.1016 |
| Te | 0.1184 | 0.1407 | 0.1380 | 0.1358 |
| O(1) | 0.7641 | 0.7827 | 0.7801 | 0.759 |
| O(1) | 0.2851 | 0.2905 | 0.2888 | 0.281 |
| O(1) | 0.1645 | 0.1853 | 0.1805 | 0.173 |
| O(2) | 0.8599 | 0.8656 | 0.8646 | 0.855 |
| O(2) | 0.0406 | 0.0371 | 0.0361 | 0.036 |
| O(2) | 0.7131 | 0.7237 | 0.7278 | 0.727 |
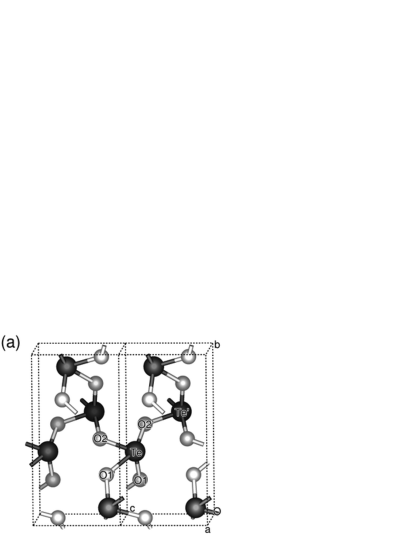

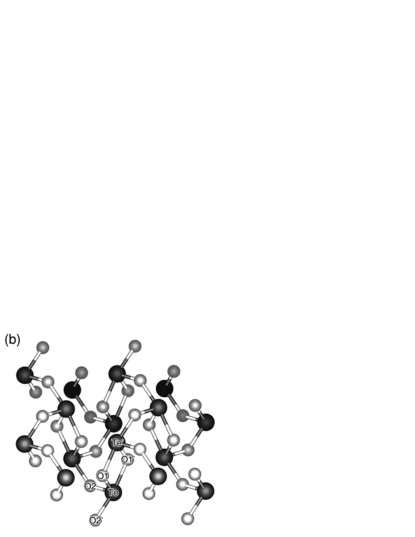
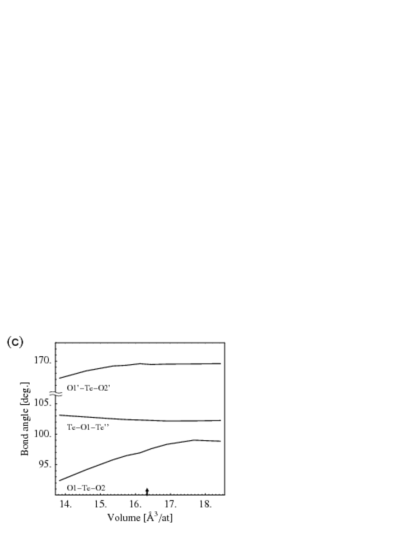
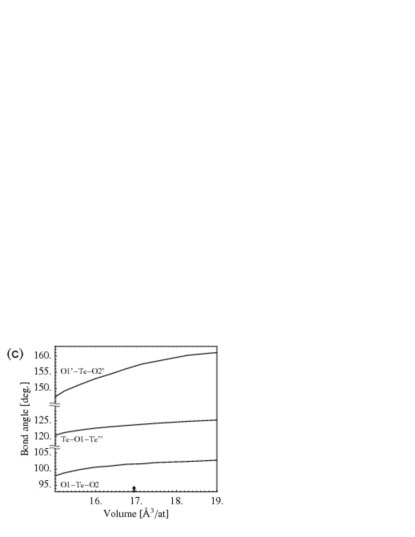
The structure of -TeO2 depicted as a fully connected 3D network or as a one-dimensional polymeric structure of TeO3 units is shown in Fig. 6a and Fig. 6b, respectively. The calculated independent bond lengths and angles are compared with experimental data in Table 7 for PBE functional at the theoretical equilibrium lattice parameters and for PBE and BLYP functionals at the experimental lattice parameters. Still, the spread in the bond lengths is reduced in the theoretical geometry at the theoretical lattice parameters (PBE) with respect to experiments. The larger error in the theoretical lattice parameters shows up in larger errors in the bond lengths in -TeO2 with respect to the other phases (cfr. tables 3 and 5). The misfit is largely reduced by optimizing the geometry at the experimental lattice parameters, with a marginal improvement for the BLYP over PBE functional. In particular, the optimized structure at the experimental lattice parameters reproduces the spread of 0.34 Å in the bond lengths. The change in the lattice parameters, bond lengths and bond angles with volume is reported in Fig. 7. The shorter bond does not vary with pressure, while both the equatorial bond and the longer axial bond decrease in length by increasing the volume. Regarding the picture of -TeO2 as a polymeric phase, we note that the longest bond of the TeO4 unit (2.198 Å) is only 5 longer than the other axial bond. On the other hand, one notes that in -TeO2 the difference in length between the longer equatorial bond and the short axial bond is the smallest among the three crystalline phases. The polymeric structure would then be seen as generated from the formation of strong intermolecular bonds between the TeO2 structural units of tellurite and paratellurite rather than from the breaking of one bond of the TeO4 units. gamma1 ; gamma2 ; fononi_gamma The one-dimensional character of -TeO2 has to be supported by the observation of strong anisotropies in the physical properties of this phase. To address this issue, we have calculated the elastic constants of -TeO2 from the difference in the total energy of strained crystals. A maximum strain of 3 has been considered. For stretching along the principal axes we obtain =38 GPa, =41 GPa, and =43 GPa, where the Voight notation has been used. The bulk modulus and its derivative with respect to pressure obtained from the fitted Murnaghan equation of state (PBE functional) are =16 GPa (=33 GPa for -TeO2) and =6.2. The elastic properties are thus nearly isotropic and do not support the picture of -TeO2 as made of one-dimensional polymeric structure. The elastic constants reported above differ from the results of calculations with empirical interatomic potentials (=30 GPa, =40 GPa, and =67 GPa, Ref. gamma2 ), mainly in the component which shows an appreciable lower compressibility along the chain () axis, not confirmed by our ab-initio results.
| PBE | PBEexp | BLYPexp | Exp | |
| Bond lengths (Å) | ||||
| Te-O1 | 1.900 | 1.905 | 1.889 | 1.859 |
| Te-O2 | 1.960 | 1.974 | 1.949 | 1.949 |
| Te-O1’ | 2.252 | 2.257 | 2.240 | 2.198 |
| Te-O2’ | 2.119 | 2.092 | 2.081 | 2.019 |
| Te-Te’ | 3.596 | 3.571 | 3.559 | 3.521 |
| Angles (degrees) | ||||
| O1-Te-O2 | 99.1 | 100.7 | 100.9 | 101.5 |
| O1’-Te-O2’ | 156.8 | 150.9 | 152.5 | 153.6 |
| Te-O1-Te’ | 123.6 | 122.8 | 124.0 | 125.0 |


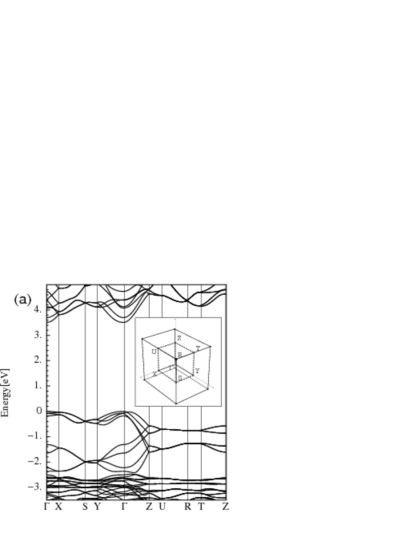
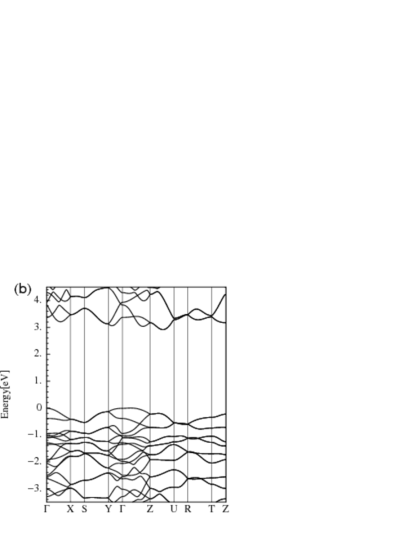
We have also contrasted the electronic band structure of -TeO2 and -TeO2 phases in Fig. 8. The electronic band structure of -TeO2 has been computed within DFT in a previous work. kleinman In -TeO2, the band dispersion along the direction -, perpendicular to the 2D layers, is sizably smaller than along the - and - directions within the layer plane. Conversely, in -TeO2, the dispersion is similar along the three orthogonal directions -, -, -. Nor the dispersion along - is much larger in -TeO2 than in -TeO2, as one would expect by comparing a polymeric phase with chains along ( phase) with a mainly molecular crystal made of TeO2 molecules ( phase). Therefore, the electronic band structure does not provide evidence of a polymeric nature of -TeO2.
We have also computed formation enthalpy and formation free energy at normal conditions (298.15 K, p=1 bar) for the three cristalline phases, by including the phononic contribution to free energy and enthalpy. Only -point phonons have been included in the calculation (see section IV). For - we have verified that the phononic contribution to the free energy of -7.8 kJ/mol, which includes only -point phonons, changes to -6.7 kJ/mol by including in the calculation the full phonon density of states. Formation free energies and enthalpies have been computed with PBE functionals at the theoretical equilibrium structure for all the three phases.
The calculated formation enthalpy () and free energy () of -, with respect to crystalline Te and gaseous O2 (the standard states), are -287.5 kJ/mol (exp. -322.6 kJ/mol)handbook , and -232.8 kJ/mol (exp. -270.3 kJ/mol)handbook . The error is within the usual accuracy of DFT methods. The free energies of gaseous Te2 and O2 have been calculated from the molecule optimized in the triplet state,o2te2 by including translational, vibrational and rotational contributions. The free energy of crystalline Te has been computed from theoretical and experimentalhandbook free energies of the gaseous Te2 molecule.
For - the calculated formation enthalpy and free energy are -289.3 kJ/mol and -236.3 kJ/mol, while for - -284.6 kJ/mol and -229.8 kJ/mol. To our knowledge, no experimental data on formation energies are available for - and -.
IV Vibrational properties
Phonons at the -point have been calculated within density functional perturbation theory.dfpt The modes which display a dipole moment couple to the inner macroscopic longitudinal electric field which shifts the LO phonon frequencies via the non-analytic contribution to the dynamical matrix dfpt
| (1) |
where and are the effective charges and electronic dielectric tensors, is the unit cell volume and q is the phononic wavevector. The macroscopic field contribution to the dynamical matrix (Eq. 1) introduces an angular dispersion of the phonons at the point, i.e. the limit of the phononic bands for depends on the angles formed by q with the principal axis. For a uniaxial crystal as -TeO2, the phonon frequencies depend on the angle formed by q with the optical axis. For the orthorhombic crystals -TeO2 and -TeO2, the phonon frequencies depend on the polar angles and which define the orientation of q with respect to the crystallographic axes, coinciding with the optical principal axes.
The dielectric tensor is given in terms of phonons and effective charges by
| (2) |
where is given by
| (3) |
The absorption coefficient for light polarized along the crystallographic axis is
| (4) | |||||
where is the velocity of light in vacuum and is the (frequency dependent) real part of the refractive index.
In order to compare the theoretical results with available experimental data we have also computed the IR absorption for a polycrystalline sample. This amounts to average the absorption coefficient for the two polarizations of the electromagnetic wave (ordinary and extraordinary waves for uniaxial crystals, for instance) over the solid angle of the possible wave vectors q of the transmitted wave. The absorption coefficient for a generic q is obtained by solving the Fresnel’s equations for the dielectric tensor defined by Eq. 2. claus
The differential cross section for Raman scattering (Stokes) in non-resonant conditions is given by the following expression (for a unit volume of scattering sample)
| (5) |
where is the Bose factor, is the frequency of the scattered light, and are the polarization vectors of the scattered and incident light, respectively. cardona ; bruesh The Raman tensor associated with the -th phonon is given by
| (6) |
where is the unit cell volume, is the position of the -th atom and is the electronic susceptibility. The tensor is computed from by finite differences, by moving the atoms independent by symmetry with maximum displacement of 0.01 Å.
Whenever the experimental Raman spectrum is available only for a polycrystalline sample, Eq. 5 must be integrated over the solid angle in order to compare the theoretical spectra with experiments. In particular, the Raman spectrum for non-polarized light is obtained by summing over all possible polarization vectors and consistent with the scattering geometry. In the case of -TeO2, the inner longitudinal macroscopic field has no effect on the Raman active modes due to the presence of an inversion symmetry. In fact, the Raman active -modes have no dipole moment to couple with the macroscopic longitudinal field. As a consequence for -TeO2 there is no angular dispersion for the Raman-active modes and the total cross section for unpolarized light in backscattering geometry is obtained from Eq. 5 with the substitution
| (7) |
Conversely, for -TeO2 and -TeO2 the presence of angular dispersion requires the integral over the solid angle to be performed by summing over discrete points in the polar angles. Phonon frequencies and eigenvectors entering in Eq. 5 and 6 are modified by the macroscopic longitudinal field along the direction assigned by the crystal momentum transferred in the scattering process.
| (8) |
with fitted on the experimental Raman peaks when available and otherwise assigned to a constant value of 4 cm-1 (cfr. Table 8).
IV.1 -TeO2
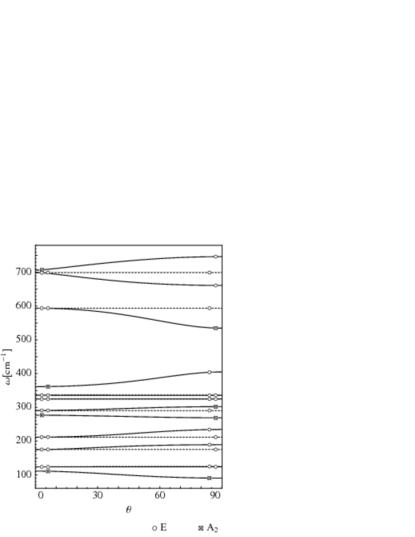
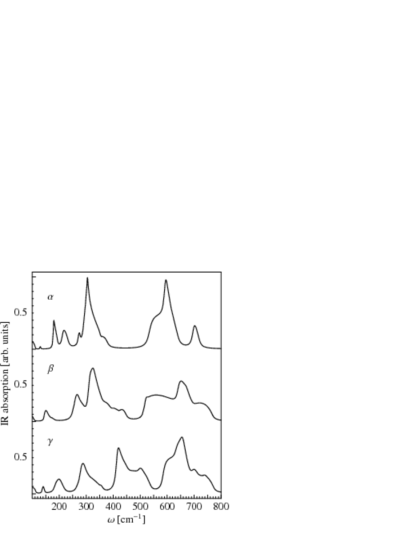
Phonons at the -point can be classified according to the irreducible representations of the point group of -TeO2 as , where the acoustic modes ( and ) have been omitted. The , , and modes and Raman active, while the and modes are IR active. The calculated phonon frequencies at the point neglecting the contribution of the macroscopic longitudinal field are given in Table 8 for the BLYP calculation at the experimental lattice parameters. The angular dispersion of and modes due to the macroscopic electric field is reported in Fig. 9; it is in good agreement with the angular dispersion obtained experimentally from the IR absorption peaks of the extraordinary waves (cfr. Fig. 3 of Ref. expIRalfa ). Experimental frequencies and IR activities of IR-active modes ( and (TO) modes) are also reported in Table 8. Experimental frequencies from Raman spectra are also reported in Table 8 for , and modes. For Raman active (LO) modes the comparison is made directly between the theoretical and experimental Raman spectra, since their frequencies depend on the scattering geometries. Phonon frequencies calculated with PBE or LDA functional at the theoretical lattice parameters and with PBE and BLYP functionals at the experimental lattice parameters are compared in Table 8. The best agreement with experiments is obtained for BLYP calculations at the experimental lattice parameters which give the equilibrium internal geometry closest to the experimental structure (cfr. section IIIA). The IR oscillator strengths are in good agreement with experiments, apart from the overestimation of the intensity of mode (2). Experimental data from a more recent work twoIR are very similar (within 5 cm-1) to the older experimental data reported in Table 8, but for the oscillator strength () of mode (2) which is 3.33 in Ref. twoIR , in closer agreement with our theoretical result. The IR absorption spectrum for a polycrystalline sample, computed as described in the previous section is reported in Fig. 12; it has to be compared with the experimental spectrum reported in Fig. 2 of Ref. fononi_beta . The linewidth of the phononic modes is chosen according to the IR experimental data on single crystal. expIRalfa The two broad bands and the shoulder at lower frequency in the experimental spectrumfononi_beta are well reproduced, but for the already mentioned redshift in the theoretical frequencies.
| Mode | (cm-1) | (, , ) | |||||
|---|---|---|---|---|---|---|---|
| (1) | 42 | (62) | 2.044 | ||||
| (1) | 90 | (76) | 7.758 | (12.95) | |||
| (1) | 124 | (124) | 0.919 | (1.28) | 5.158 | 2.9 | |
| (2) | 128 | 0.042 | |||||
| (1) | 143 | (152) | 4.939 | 7.561 | 5.8 | ||
| (1) | 148 | (157) | 2.767 | 2.2 | |||
| (3) | 175 | (179) | 0.324 | ||||
| (2) | 175 | (177) | 5.667 | (8.05) | 0.980 | ||
| (3) | 212 | (212) | 3.127 | (2.02) | 0.043 | ||
| (2) | 214 | (218) | 0.338 | 0.058 | |||
| (4) | 229 | (235) | 0.514 | ||||
| (2) | 269 | (265) | 3.156 | (0.77) | |||
| (2) | 272 | (281) | 0.330 | ||||
| (4) | 291 | (299) | 5.121 | (3.95) | 0.045 | ||
| (3) | 302 | (325) | 4.096 | (4.70) | |||
| (5) | 325 | (336) | 0.005 | (0.25) | 0.077 | ||
| (6) | 336 | (379) | 0.006 | (0.01) | 0.863 | 6.4 | |
| (3) | 383 | (391) | 2.421 | 7.923 | 12.1 | ||
| (3) | 406 | (415) | 0.136 | ||||
| (4) | 535 | (570) | 3.802 | (3.86) | |||
| (5) | 537 | (589) | 1.551 | 14.0 | |||
| (7) | 594 | (644) | 1.268 | (1.27) | 0.200 | ||
| (4) | 598 | (649) | 10.242 | 14.815 | 4.7 | ||
| (8) | 700 | (774) | 0.225 | (0.21) | 0.671 | ||
| (4) | 726 | (786) | 0.574 | ||||
The Raman tensor (Eq. 6) for the Raman-active irreducible representations has the following form:loudon
The coefficients ,,,, and calculated from first principles as outlined above are given for each mode in Table 8. The calculated derivatives of the dielectric tensor with respect to the displacement of the atoms independent by symmetry are given as additional materials.epaps
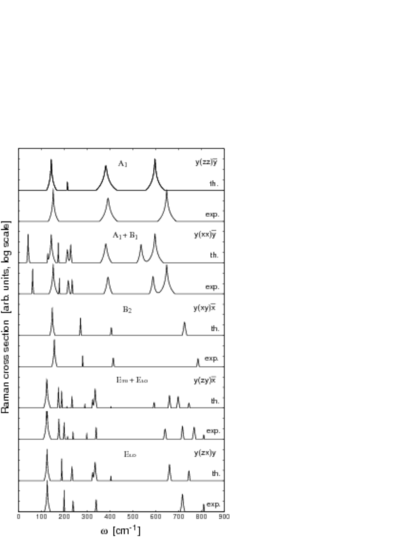

The theoretical Raman spectra for different scattering conditions, each selecting particular modes, are compared with experimental data,Pine ; gamma2 in Fig. 10. The theoretical spectra include the shift in phonon frequencies due to the contribution of the macroscopic longitudinal field along the direction assigned by the crystal momentum transferred in the scattering geometry. The Raman spectrum for a polycrystalline sample is also computed and compared with experimental data in Fig. 13. For each wavevector q transfered in the scattering process the phonon eigenvector and frequency is computed by including the non-analytic part of the dynamical matrix. The solid angle average is performed over 256 angles independent by symmetry. The linewidth of the most intense Raman peaks in the theoretical spectra has been obtained by fitting the experimental spectra with a sum of Lorentzian functions, either at 85 K for the single crystal spectra (Fig. 10) or at 295 K for the polycrystalline spectra. The high temperature linewidth are given in Table 8. The linewidth of the weaker or less identifiable peaks is set to 4 cm-1.
The calculated Raman spectra are in good agreement with experiments on peak intensities and also on peak frequencies in the low-frequency region, while the high-frequency modes appear too soft by nearly 8% (see Table 8). The discrepancy can possibly be ascribed to the partial homogenization of axial and equatorial bonds resulting from the use of approximate exchange-correlation functionals. This effect is smaller for BLYP than for PBE functionals (cfr. section IIIA). The experimental Raman peak at 218 cm-1 assigned to a mode in Ref. Pine can be better assigned to the (2) mode on the base of our calculations (cfr. Table 8) which is also not inconsistent with experimental two-phonons IR spectra of Ref. twoIR . More on the displacement pattern of the different modes is given in section IVD where the Raman spectra of the three phases are compared.
Phonon dispersion relations along the high symmetry directions of the Irreducible Brillouin Zone (IBZ) and phonon Density Of States (DOS) are reported in Fig. 11. The dynamical matrices have been computed for 30 q points along the path shown in Fig. 11, or on a grid in q-space for the DOS calculation. A Fourier interpolation technique provided the dynamical matrix at the other points of the BZ.dfpt For the DOS calculation, we have used the tetrahedron method on a mesh of points in the IBZ.
An energy gap separates the low-frequency phonon branches from the eight highest frequency bands, which can be assigned to stretching modes of the eight inequivalent bonds per cell, i.e. symmetric and antisymmetric stretching modes of the four TeO2 in the unit cell (see section IVD). This group of bands is slightly shifted downward with respect to experiments, as discussed above. Our results compare fairly well with previous lattice dynamics calculations of the DOS tesi ; fononi_beta and on dispersion relations. alfashell However, sizable quantitative differences are present especially on angular dispersion with respect to shell model calculations. alfashell To our knowledge, no experimental data are available on phonon dispersion relations.
| Mode | BLYPexp | PBEexp | PBE | LDA |
|---|---|---|---|---|
| (1) | 42 | 48 | 62 | 69 |
| (1) | 90 | 94 | 90 | 106 |
| (1) | 124 | 120 | 116 | 142 |
| (2) | 128 | 127 | 125 | 129 |
| (1) | 143 | 140 | 134 | 135 |
| (1) | 148 | 141 | 136 | 131 |
| (3) | 175 | 171 | 150 | 166 |
| (2) | 175 | 171 | 162 | 179 |
| (3) | 212 | 214 | 193 | 213 |
| (2) | 214 | 207 | 195 | 206 |
| (4) | 229 | 234 | 218 | 251 |
| (2) | 269 | 267 | 254 | 256 |
| (2) | 272 | 261 | 235 | 241 |
| (4) | 291 | 282 | 262 | 262 |
| (3) | 302 | 292 | 286 | 284 |
| (5) | 325 | 316 | 295 | 327 |
| (6) | 336 | 335 | 317 | 334 |
| (3) | 383 | 377 | 364 | 402 |
| (3) | 406 | 399 | 385 | 404 |
| (4) | 535 | 507 | 515 | 471 |
| (5) | 537 | 512 | 509 | 484 |
| (7) | 594 | 573 | 567 | 551 |
| (4) | 598 | 579 | 575 | 555 |
| (8) | 700 | 683 | 694 | 667 |
| (4) | 726 | 701 | 706 | 667 |
IV.2 -TeO2
Phonons at the -point can be classified according to the irreducible representations of the point group as . The three translation modes have been omitted. The -modes are Raman active while -modes are IR active. Only -modes couple to the macroscopic longitudinal field via the non-analytic part of the dynamical matrix. The calculated phonon frequencies at the -point, neglecting the contribution of the longitudinal macroscopic field is given in Table 10. The results refer to calculations at the experimental lattice parameters with the BLYP functional which turned out to provide the best agreement with experiments for -TeO2 and for -TeO2 as well.
The Raman tensor for the active modes of an orthorhombic crystal has the form:loudon
For -TeO2 only the -modes have to be considered.
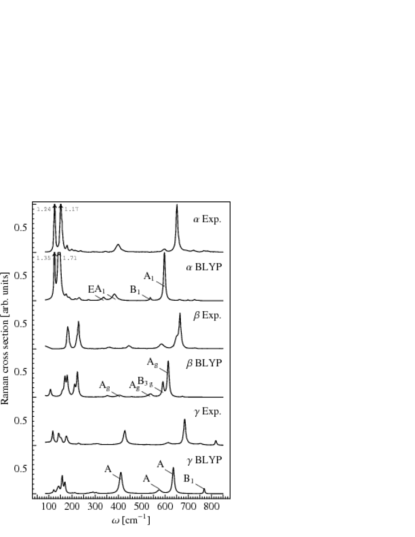
The calculated coefficients of the Raman tensor are given in Table 10 for all active modes. Experimental Raman spectra are available only for polycrystalline samples in backscattering geometry for unpolarized light. gamma2 The corresponding theoretical spectrum can be obtained by averaging the Raman cross section over the solid angle by making use of Eq. 7. The resulting theoretical Raman spectrum of -TeO2 is compared with the experimental powder spectrum in Fig. 13. The linewidth of the most intense Raman peaks in the theoretical spectra has been obtained by fitting the experimental spectra with a sum of Lorentzian functions. The results are given in Table 10. The linewidth of the weaker or less identifiable peaks is set to 4 cm-1. Overall the experimental spectrum is well reproduced, but for a redshift of the high frequency modes. The underestimation of the frequency of the stretching modes is probably due to the overestimation of the bond length (cfr. section IIIB). The frequency redshift with respect to experiments is even larger when the PBE functional is used, as occurs for the - (cfr. Table 9). The theoretical Raman spectrum allows to assign the character of the modes responsible for the experimental peaks. More on the displacement pattern of the different modes is given in section IV D where the Raman spectra of the three phases are compared.
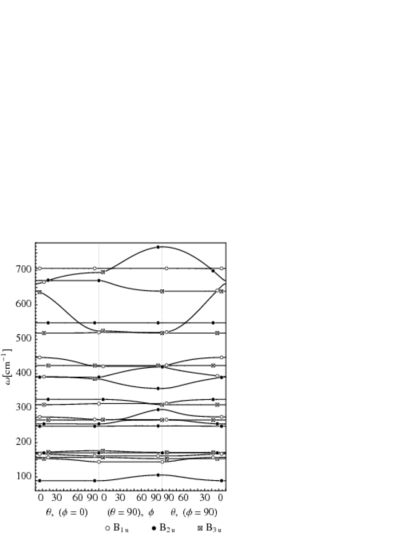
The -modes are subject to angular dispersion due to the coupling with the macroscopic longitudinal field. The dependence of the phonon frequencies on the polar angles of the q vector approaching the -point is given in Fig. 14. IR oscillator strength of the active modes is reported in Table 10. To our knowledge no experimental IR data are available for single crystals. To compare with experimental data available we have thus computed the IR absorption spectrum for a polycrystalline sample as described in the previous section. The result is reported in Fig. 12; it has to be compared with the experimental spectrum reported in Fig. 2 of Ref. fononi_beta . The experimental peaks are reproduced qualitatively, but for an inversion in the relative intensities of the two peaks around 600 and 700 cm-1. Moreover, the theoretical spectrum shows a shoulder at high frequency which is absent in the experimental spectrum. Our choice of the phonon linewidth might be partially responsible for these disagreements with the experimental data. In fact, in the lack of experimental data, the linewidth of the phononic modes is chosen similarly to those of -TeO2, i.e. 5 cm-1 for frequency below 150 cm-1 and 15 cm-1 for higher frequencies.
|
|
IV.3 -TeO2
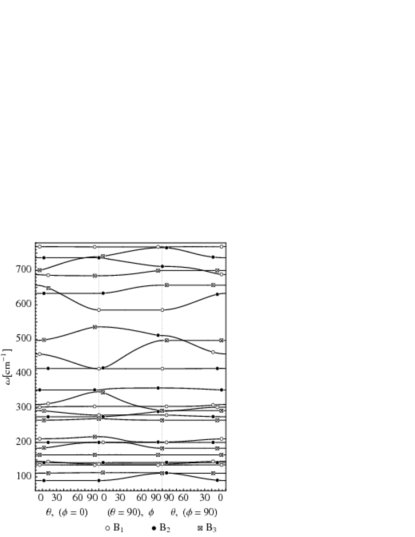
Phonons at the -point can be classified according to the irreducible representations of the point group as . The three translational modes have been omitted. The calculated phonon frequencies at the -point, neglecting the contribution of the longitudinal macroscopic field is given in Table 15. The results refer to calculations at the experimental lattice parameters with the BLYP functional. All the modes are Raman active while only -modes are IR active and display angular dispersion due to the coupling with the longitudinal macroscopic field (Fig. 15). IR oscillator strength of the active modes is reported in Table 11. Still no experimental IR data are available for -TeO2 single crystals. To compare with experimental data available we have thus computed the IR absorption spectrum for a polycrystalline sample as described in the previous section. The result is reported in in Fig. 12; it has to be compared with the experimental spectrum reported in Fig. 2 of Ref. fononi_beta . In the lack of experimental data, the linewidth of the phononic modes is chosen similarly to 5 cm-1 for frequency below 150 cm-1 and 15 cm-1 for higher frequencies, analogously to -TeO2. The theoretical spectrum reproduces all the main features of the experimental spectrum fononi_beta , but for a redshift of the theoretical modes at high frequency as occurs for -TeO2. The Raman tensor for active modes has been given in the previous section.
| Mode | (cm-1) | |||||
|---|---|---|---|---|---|---|
| 52 | 0.029 | 0.813 | 0.137 | |||
| 90 | 8.215 | 0.002 | ||||
| 111 | 0.549 | 0.084 | ||||
| 122 | 2.222 | 1.502 | 0.025 | 4.2 | ||
| 135 | 0.307 | 1.190 | 3.7 | |||
| 137 | 1.627 | 1.242 | 3.7 | |||
| 142 | 0.069 | 0.076 | ||||
| 158 | 0.693 | 0.612 | 2.512 | 4.5 | ||
| 164 | 0.144 | 0.000 | ||||
| 169 | 1.138 | 2.259 | 2.875 | 4.5 | ||
| 183 | 5.049 | 0.003 | ||||
| 200 | 0.141 | 0.117 | ||||
| 201 | 1.362 | 0.017 | ||||
| 212 | 0.311 | 0.455 | 0.112 | |||
| 265 | 0.517 | 0.264 | ||||
| 275 | 1.935 | 0.323 | ||||
| 280 | 2.097 | 0.457 | ||||
| 291 | 0.480 | 0.529 | 0.004 | |||
| 293 | 2.036 | 0.661 | ||||
| 305 | 0.037 | 0.387 | ||||
| 353 | 0.608 | 0.040 | ||||
| 410 | 1.467 | 0.794 | 29.271 | 13.4 | ||
| 414 | 1.670 | 0.601 | ||||
| 415 | 3.866 | 0.257 | ||||
| 496 | 0.895 | 0.119 | ||||
| 575 | 0.033 | 0.151 | 9.968 | 12.4 | ||
| 585 | 1.519 | 0.231 | ||||
| 633 | 1.147 | 0.006 | ||||
| 636 | 10.494 | 16.807 | 3.977 | 8.7 | ||
| 657 | 0.577 | 0.036 | ||||
| 699 | 0.158 | 0.026 | ||||
| 737 | 0.088 | 0.007 | ||||
| 768 | 0.005 | 1.955 | 4.5 |
The coefficients of the theoretical Raman tensor are given in Table XI for all the active modes. As for -TeO2, experimental Raman spectra are available only for polycrystalline sample in backscattering geometry. The corresponding theoretical spectrum can be obtained by averaging the Raman cross section over the solid angle. However, as opposed to the case of -TeO2, Raman active modes in -TeO2 can be subject to angular dispersion (cfr. Fig. 15 ). As a consequence, formula Eq. 7 can not be used and the integral over the solid angle has to be performed over discrete angular values of the phononic wavevector q approaching the point. For each wavevector q transfered in the scattering process the phonon eigenvector and frequency is computed by including the non-analytic part of the dynamical matrix. The solid angle average is performed over 256 angles independent by symmetry. The calculated powder Raman spectrum of -TeO2 is compared with the experimental spectra and with the spectra of the other phases in Fig. 13. The linewidth of the theoretical peaks are fitted to experiments as discussed for -TeO2 in the previous section. The linewidth of the weaker or less identifiable peaks is set to 4 cm-1. The linewidth of the Raman active modes are reported in Table XI. The angular dispersion has a minor effect on the Raman spectrum since the most intense peaks turn out to have character for which no coupling exists with the longitudinal macroscopic field: the Raman powder spectra of -TeO2 including or neglecting the angular dispersion are indistinguishable on the scale of Fig. 13. The agreement between theory and experiments is overall good as for the other phases. Still a sizable redshift of the high frequency modes is present. Analogously to the other phases, the error is still slightly larger by making use of the PBE functional. Moreover, a very weak experimental peak around 790 cm-1 has no counterpart in the calculated spectrum. Although three Raman active modes fall in that region, none of them has an appreciable Raman intensity. More on the displacement pattern of the different modes is given in section IV D where the Raman spectra of the three phases are compared.
IV.4 Comparison of Raman spectra of the three phases
In this section, we discuss the assignment of the experimental Raman peaks to specific phonons and compare the displacements patterns of these phonons in the three different phases. Firstly, we must say that the ab-initio results presented here are overall in good agreement with previous results from lattice dynamics calculations with empirical interatomic potentials. gamma2 ; fononi_gamma ; fononi_beta ; tesi The displacement patterns of the phonons responsible for the main Raman peaks of -, -, and -TeO2 are reported in Figs. 16, 17, 18.


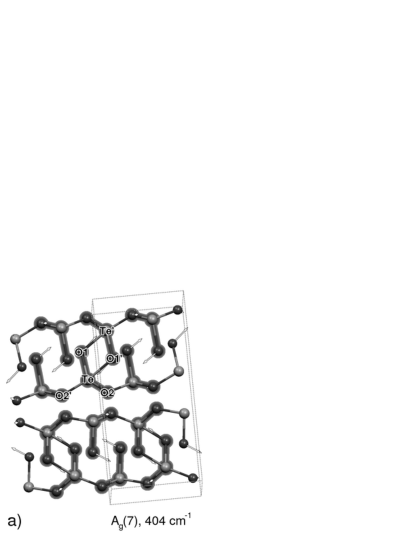


As pointed out in Ref. gamma2 ; tesi the -point phonons of -TeO2 can be interpreted in terms of the vibrations of the TeO2 molecule given in Table I. The modes (4) and (5) responsible for the strong Raman peak at 598 cm-1 and the weak peak at 537 cm-1 (cfr. Fig. 13) correspond to symmetric and antisymmetric stretching modes of the TeO2 molecular units (Fig. 16c-d). The mode (3) responsible for the Raman peak at 383 cm-1 (Fig. 13) is a bending mode of the TeO2 molecule (Fig. 16b). The mode (6) responsible for the weak Raman peak at 336 cm-1 is a librational mode of TeO2 molecule which modulates the length of the two axial bonds (Fig. 16a). The Raman peaks at lower frequencies (120-150 cm-1) are due to librational modes of the TeO4 units ((1), (1), (1) in Table VIII). The displacement pattern shown in Fig. 16 are in good agreement with those of the corresponding modes obtained in Ref. gamma2 ; tesi from lattice dynamics calculations with empirical interatomic potentials. However, the relative Raman intensities are better reproduced by our ab-initio calculations than by the Bond-Polarizability Model (BPM) used in Ref. gamma2 ; tesi .
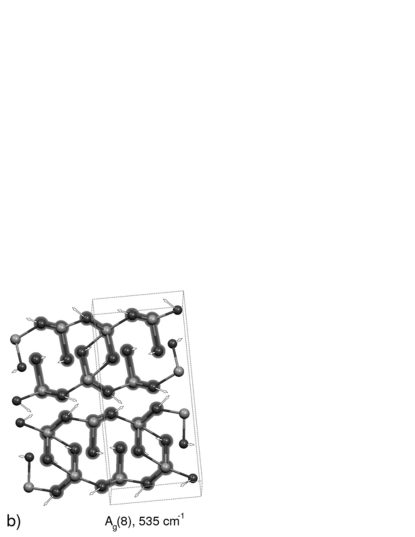
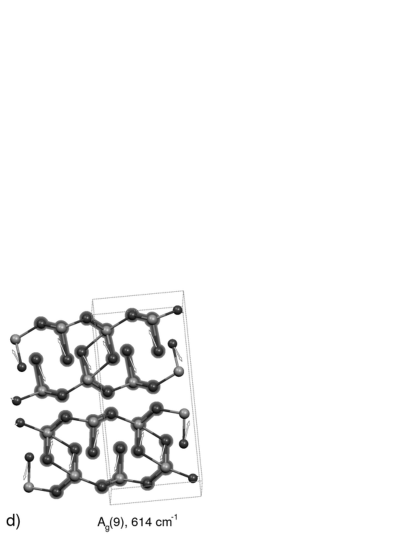
Concerning -TeO2, the mode (8) responsible for the Raman peak at 591 cm-1 is an antisymmetric stretching mode of the TeO2 molecular unit (Fig. 17c, in agreement with Ref. gamma2 ; tesi ). The mode (9) responsible for the Raman peak at 614 cm-1 is instead a stretching mode of just one (the shorter) of the two equatorial bonds (Fig. 17d). The mode (8) at 535 cm-1 is the stretching mode of the other longer equatorial bond (Fig. 17b). This is in contrast with the results of lattice dynamics calculations with empirical potentials of Ref. gamma2 ; tesi , which gives a mixing of the two modes to produce a symmetric and antisymmetric stretching mode of the TeO2 molecule. The mode (7) at 404 cm-1 is a vibration of the Te2O2 ring which modulates the length of the axial bonds, in agreement with Ref. gamma2 ; tesi . However, the bond-polarizability model used in Ref. gamma2 ; tesi gives unsatisfactory results for the relative Raman intensities.
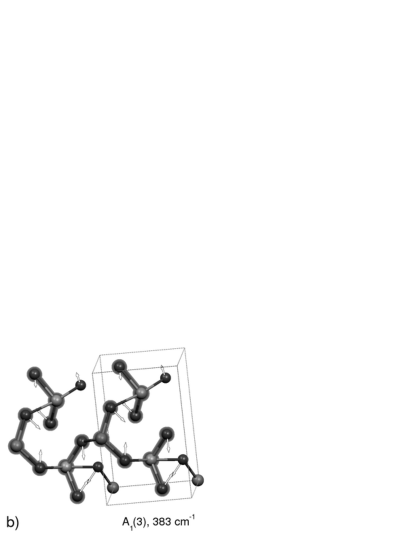
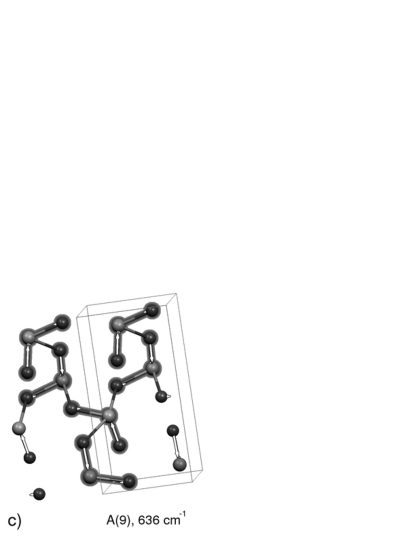
Concerning -TeO2, the Raman peaks at 768 and 636 cm-1 correspond to stretching modes of the shortest bond in-phase ((9)) or out-of-phase ((8)) within the four TeO2 molecules in the unit cell, respectively (Fig. 18c-d). The modes (8) and (7) responsible for the Raman peaks at 575 and 410 cm-1 are mixed stretching and bending modes of the bridge with the Te atoms fixed (Fig. 18a-b). Again, the displacement pattern of these modes are in good agreement with those calculated in Ref. gamma2 ; tesi from empirical interatomic potentials. The analysis of the vibrational spectra of -TeO2 and -TeO2, presented above, identify clearly the TeO2 molecules as the building units of the crystal. However, the interaction between the molecules is large. For instance, the symmetric stretching modes of the TeO2 unit shifts from 598 cm-1 ((4)) to 726 cm-1 ((4)) depending on the phase relation between the motion of the different molecules. As pointed out in Ref. gamma2 ; tesi , the -TeO2 phase behaves differently with respect to - and -TeO2 for what concerns the vibrational properties. Indeed, the displacement patterns reported in Fig. 18 suggest a chain-like structure, the most intense Raman peaks consisting of stretching modes of the bridge and of the shortest bond which might be seen as side group of the polymeric chain. Still, the chains are strongly interacting since the (9) and (8) modes which consists of the same intrachain vibration with different interchain phase relation differ in frequency as much as 130 cm-1. We note that in the phase the lowest energy phonons ((1), (1), (1) at 38-55 cm-1) correspond to rigid out of-phase translational modes of the two layers in the unit cell. In -TeO2, the lowest mode at 52 cm-1 corresponds to a rigid translation of the chains along the chain axes, out-of-phase between the two chains in the unit cell. The other two modes at higher frequency (80, 111 cm-1) involve instead sizable deformations of the chains themselves. In -TeO2 the low frequency modes (below 140 cm-1) can be well described as rigid motions of the TeO4 units around the bridging oxygen atoms.
V Conclusions
Based on first principles calculations, we have studied the structural and vibrational properties of the three crystalline phases of TeO2 (, , ). Phonon dispersion relations and IR and Raman spectra have been computed within density functional perturbation theory. The calculated Raman and IR spectra are in good agreement with available experimental data, and with previous lattice dynamics calculations based on empirical interatomic potentials gamma2 ; fononi_gamma ; fononi_beta ; tesi , but for an underestimation of the frequency of the Te-O stretching modes (above 500 cm-1). The modes at high frequency (400-800 cm-1) can be well described in terms of vibrations of TeO2 molecular units in - and -TeO2 which would then be seen as molecular crystals. The analysis of the vibrational spectrum of -TeO2 suggest instead a stronger intermolecular interaction supporting the picture of -TeO2 as a chain-like structure, more connected than - and -TeO2. However, the calculated elastic constants and electronic band structure do not show strong anisotropies which would have been expected from the description of -TeO2 as the assembling of aligned polymers proposed experimentally. As a matter of fact, TeO2 molecules in - and -TeO2 and polymerized TeO2 chains in -TeO2 are strongly interacting, possibly via electrostatic coupling, as suggested by the strong ionic character of the Te-O bond emerged from previous ab-initio calculations.kleinman ; palmero
VI Acknowledgments
This work is partially supported by the INFM Parallel Computing Initiative. Discussion with G. Dai and F. Tassone are gratefully acknowledged.
References
- (1) R. A. H. El-Mallanwany, Tellurite glasses handbook (CRC Press, Boca Raton (FL), 2002).
- (2) D. Dai, F. Tassone, A. Li Bassi, V. Russo, C. E. Bottani, D. D’Amore, IEEE Photonic Technology Letters 16, 1011 (2004).
- (3) C. Rivero, K. Richardson, R. Stegeman, G. Stegeman, T. Cardinal, E. Fargin, M. Couzi, V. Rodriguez, J. Non-Cryst. Solids 345&346, 396 (2004).
- (4) P. A. Thomas, J. Phys. C 31, 4611 (1988).
- (5) V. H. Beyer, Z.Kristallogr. 124, 228 (1967).
- (6) S. Blanchandin, P. Marchet, P. Thomas, J. C. Champarnaud-Mesjard, and B. Frit, J. Mater. Chem 9, 1785 (1999).
- (7) J. C. Champarnaud-Mesjard, S. Blanchandin, P. Thomas, A. P. Mirgorodsky, T. Merle-Mejean, and B. Frit, J. Phys. Chem. Solids 61, 1499 (2000).
- (8) O. Noguera, T. Merle-Mejean, A. P. Mirgorodsky, M. Smirnov, P. Thomas, and J. C. Champarnaud-Mesjard, J. Non-Cryst. Solids 330, 50 (2003).
- (9) N. Kimura and T. Sato, J. Phys. Soc. Jap. 63, 3704 (1994).
- (10) A. P. Mirgorodsky, T. Merle-Mejean, J. C. Champarnaud-Mesjard, and B. Frit, J. Phys. Chem. Solids 61, 1499 (2000).
- (11) O. Noguera, Phd thesis, University of Limoges (2003), available on-line at http://www.unilim.fr/scd/.
- (12) J.P. Perdew, K. Burke, M. Ernzerhof, Phys. Rev. Lett. 77, 3865 (1996).
- (13) A. D. Becke, Phys. Rev. A 38, 3098 (1988); C. Lee, W. Yang, and R. G. Parr, Phys. Rev. B 37, 785 (1988).
- (14) Pwscf and Phonons, S. Baroni, A. dal Corso, S. de Gironcoli, and P. Giannozzi, http://www.pwscf.org
- (15) D. Vanderbilt, Phys Rev. B 41, 7892 (1990).
- (16) H. J. Monkhorst, J. D. Pack Phys. Rev. B 13, 5188 (1976).
- (17) D. Murnaghan, Proc. Nat. Acad. Sci. USA 30, 224 (1944).
- (18) S. Baroni, S. de Gironcoli, A. Dal Corso and P. Giannozzi, Rev. Mod. Phys. 73, 515 (2001).
- (19) N. Troullier and J. L. Martins, Phys. Rev. B 43, 1993 (1991).
- (20) H. Ogi, M. Fukunaga, M. Hirai, and H. Ledbetter, Phys. Rev. B 69, 024104 (2004).
- (21) B. R. Sahu and L. Kleinman, Phys. Rev. B 69, 193101 (2004).
- (22) Handbook of Chemistry and Physics, 84th Edition, edited by D. R. Lide (CRC Press, 2004)
- (23) The calculated (PBE) bond lengths and vibrational frequencies of O2 and Te2 in the triplet states are respectively: O2 d=1.254 Å (exp. 1.208 Å)handbook , =1570 cm-1 (exp. 1580.2 cm-1)handbook ; Te2 d=2.584 Å (exp. 2.557 Å)handbook , =247 cm-1 (exp. 247.1 cm-1)handbook .
- (24) T. G. Worlton and R. A. Beyerlein, Phys. Rev. B 12, 1899 (1975).
- (25) E. Menendez-Proupin, G. Gutierrez, E. Palmero and J.L. Pena, Phys. Rev. B 70, 035112 (2004).
- (26) R. Claus, Phys. St. Sol (b) 100, 9 (1980).
- (27) Light Scattering in Solids II, edited by M. Cardona and G. Güntherodt (Springer-Verlag, Berlin, 1982).
- (28) P. Brüesch, Phonons: Theory and Experiments II (Springer-Verlag, Berlin, 1986).
- (29) D. M. Korn, A. S. Pine, G. Dresselhaus, and T. B. Reed, Phys. Rev. B 8, 768 (1973).
- (30) N.N. Syrbu and R.V. Cretu, Infrared Phys. Techn. 37, 769 (1996).
- (31) R. Loudon, Adv. Phys. 50, 813 (2001)
- (32) See EPAPS Document No. [XXXXX] for derivatives of dielectric tensor with respect to the displacement of symmetry-independent atoms. For more information on EPAPS see http://www.aip.org/pubservers/epaps.html
- (33) A. S. Pine and G. Dresselhaus, Phys. Rev. B 5, 4087 (1972).
- (34) O. Noguera, M. Smirnov, A. P. Mirgorodsky, T. Merle-Mejean, P. Thomas, and J. C. Champarnaud-Mesjard, Phys. Rev. B 68, 94203 (2003).
- (35) M. Spoliti, S. Cesaro, and E. Coffari, J. Chem. Thermodyn. 4, 507 (1972).