Avalanche dynamics on a rough inclined plane
Abstract
Avalanche behavior of gravitationally-forced granular layers on a rough inclined plane are investigated experimentally for different materials and for a variety of grain shapes ranging from spherical beads to highly anisotropic particles with dendritic shape. We measure the front velocity, area and the height of many avalanches and correlate the motion with the area and height. We also measure the avalanche profiles for several example cases. As the shape irregularity of the grains is increased, there is a dramatic qualitative change in avalanche properties. For rough non-spherical grains, avalanches are faster, bigger and overturning in the sense that individual particles have down-slope speeds that exceed the front speed as compared with avalanches of spherical glass beads that are quantitatively slower, smaller and where particles always travel slower than the front speed. There is a linear increase of three quantities i) dimensionless avalanche height ii) ratio of particle to front speed and iii) the growth rate of avalanche speed with increasing avalanche size with increasing where is the bulk angle of repose, or with increasing , the slope of the depth averaged flow rule, where both and reflect the grain shape irregularity. These relations provide a tool for predicting important dynamical properties of avalanches as a function of grain shape irregularity. A relatively simple depth-averaged theoretical description captures some important elements of the avalanche motion, notably the existence of two regimes of this motion.
pacs:
45.70.Ht, 45.70.-n, 47.57.GcI Introduction
Granular materials form phases with strong similarities with ordinary phases of matter, i.e., solids, liquids or gases jana1996 . In many natural processes, the coexistence of two of these phases is observed, requiring a complex multi-phase description. An example is avalanche formation, which occurs under various circumstances in nature (snow avalanches, sand avalanches on dunes, rock avalanches, land slides, etc.) as well as in industrial processes involving granular materials. Although laboratory realizations of granular avalanches do not have the full complexity of avalanches encountered in nature, laboratory studies of this phenomena are important for understanding the fundamental behavior of avalanches where there is a interesting combination of stick-slip friction, yield criteria for the solid phase, and the fluid-like motion of the avalanche itself. Although the statistics of avalanche occurrences is a fascinating area of research fe1995 , we focus here on the dynamics of individual avalanche events.
There are several classes of experiments for avalanches, each with advantages and disadvantages. One is to slowly rotate a closed cylinder that is about 50% full of granular material ra1990 ; ra2002 ; boda2002 ; cogo2005 . As the cylinder rotates, the angle of the granular surface exceeds the critical angle , and material starts to flow along the surface. At rapid rotation rates the flow is continuous but for slower rotation rates, avalanches occur because the rate of depletion of the granular material in the avalanche brings the surface back to the angle of repose faster than the rotation can maintain a surface angle greater than . Significant advantages of this approach are that there is no need to continuously supply grains to the system, and the flow rate is easily controlled by the rotation rate. Further, using transparent boundaries enables direct observation of the velocity profile in the flowing layer because avalanches in this system typically extend to the side walls. From such optical measurements one finds that the vertical velocity profile of an avalanche follows an exponential decay cogo2005 in contrast to steady flows where it has an upper linear part. On the other hand, the role of friction at the side boundaries on the vertical velocity profile is unclear and may be quite important because the horizontal velocity profile is a plug flow with two exponential boundary layers at the walls.
A second realization of avalanches is to add granular material to a heap near its peak to induce granular motion ledu2000 ; du2000 ; neag2003 . The heap can be three dimensional or can be confined between rigid barriers, typically transparent glass or plastic plates, to form a unidirectional flow. For high input mass flux near the top, the grains flow continuously down the surface formed by other grains. For lower incoming mass flow, avalanches form intermittently. The transition between continuous and avalanching flow as a function of input mass flux is hysteretic ra1990 ; liha1999 . Studies using diffusing-wave spectroscopy du2000 and molecular dynamics simulations si2005 provided detailed properties of this intermittency. The experimental results show that the microscopic grain dynamics are similar in the continuous and intermittent flow regimes ledu2000 . In the continuous flow regime for a bulk heap, the grain velocity decreases linearly as a function of the depth below the surface. Below some depth, however, a much slower “creep” motion is observed with an exponential velocity profile koin2001 ; boda2002 ; ando2001 . For the case of avalanches, theoretical results suggest that the avalanche amplitude should depend strongly on the velocity profile arra1999 ; emcl2005 .
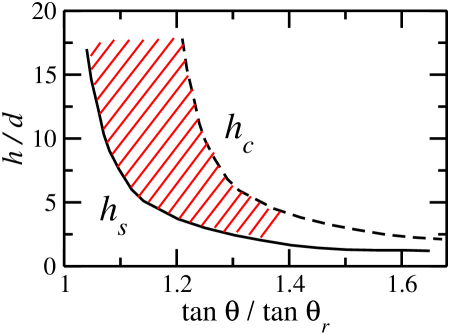
A third laboratory system for avalanche studies is a layer of grains on a rough plane inclined at an angle with respect to horizontal dado1999 ; da2000 ; da2001 ; ivre2000 ; arts2001 ; ra2002aug ; feth2004 ; mala2006 ; clma2007 ; arma2006 . Because we use this system in the experiments reported below, we review some aspects of these inclined layer flows in more detail. Grains on a rough inclined plane form a thin stable static layer even for and the onset of the flow is expected only above a critical thickness , while the flow subsides at pona1996 ; po1999 . The values of and are rapidly decreasing by increasing as is schematically illustrated in Fig. 1. Here is an average of the curves measured for 8 different materials (for the data see Section III), and is an approximate curve for illustration.
According to Bagnold ba1954 , the shear stress in granular flows is proportional to the square of the strain rate. This hypothesis has been checked in various configurations and has been proven to work relatively well for dense inclined plane flows gdrmidi2004 . The Bagnold stress-stain relationship leads to a velocity profile of the form where the surface velocity depends on as . The above convex velocity profile is recovered in MD simulations for relatively thick flows sier2001 ; sila2003 . As the internal velocity profile is difficult to determine experimentally, the most straightforward experimental test of the Bagnold hypothesis is to measure the height dependence of the surface velocity or the depth-averaged velocity . This relationship, called the flow rule (FR), was obtained for homogeneous flows with glass beads or sand po1999 ; fopo2003 ; boec2007 and is found to be consistent with the Bagnold flow profiles. Two slightly different forms of the FR are the Pouliquen flow rule
| (1) |
and a modified form due to Jenkins je2006 which we denote the Pouliquen-Jenkins flow rule:
| (2) |
where is the vertical asymptote of the curve.
In the inclined layer system, one can either prepare the layer in a metastable state and mechanically induce a single avalanche dado1999 ; da2000 ; da2001 ; arts2001 , or an intermittent series of avalanches can be produced by slowly adding grains near the top of the inclined layer as is done here. In the former case the whole layer becomes metastable dado1999 ; da2000 ; da2001 , and the shape and propagation of the avalanches depends critically on (the level of metastability), giving rise to downward and also upward expanding avalanches when triggered with a small perturbation. For both kinds of avalanches on an inclined plane the angle at which flow starts or stops depends on the thickness of the layer contrary to the heap experiments, on the properties of the bottom boundary such as surface roughness (which controls the zero-velocity boundary condition), and on the particular granular particle properties including inter-particle friction and particle shape. The distinct advantages of this system for the study of avalanches include the robust flow rule relationship in the continuous flow regime po1999 ; anda2002 ; boec2007 that relates depth-averaged velocity and height, a simpler vertical velocity profile, and the ability to adjust the stability of the layer by changing the plane inclination angle . Note that both flow rules connect the rheology deep in the flowing state with properties of the boundary between the flowing and the stationary states.
The majority of laboratory experiments use spherical beads - an idealized granular material. However, properties of waves, either on a rough incline fopo2003 or in hopper flows babe1989 , depend on the shape anisotropy of the grains. Also, in recent numerical simulations the velocity profile in Couette flow depends strongly on the angularity of the particles cl2008 . Thus, it is natural to expect that avalanches will be similarly affected by the shape of the individual granular particles. Indeed, glass beads and sand show qualitatively different avalanching behavior boha2005 despite qualitatively similar flow rules in the steady flow phase. Avalanches formed by sand particles are larger with more dynamic grain motion than avalanches formed by glass beads. By plugging the known flow properties fopo2003 into the depth-averaged model equations these basic differences can be explained boha2005 .
In this paper, we present the results of an extensive study, using a set of different materials, and describe the details of our experimental methods used for the results presented in boha2005 . Our aim is to capture how the dynamical properties of the avalanches depend on the grain shape irregularity, including the effects due to deviations from the idealized spherical shape of the overall grain form and effects of the microscopic surface roughness of the particles. We find relations by which we can quantitatively predict major properties of avalanches as a function of the angle of repose or the slope of the flow rule , both of which provide a measure of grain shape irregularity.
We study the case where the layer is initially stable to small perturbations. As new grains are added to the layer at the top section () of the plane, the granular layer becomes locally unstable in a cyclic manner leading to the intermittent formation of avalanches. These avalanches propagate down the plane on top of the stable static layer in a stationary manner, i.e., the shape and velocity of the avalanche does not change appreciably. The dynamical properties of these avalanches are studied far down the plane from where they are formed. We use eight different materials including rough irregular shaped particles of different sizes and spherical beads. The materials are characterized in Sec. II where the experimental conditions are also described. In Sec. III we discuss how the properties of the avalanches depend dramatically on the shape (spherical, or irregular) of the grains. We describe a simple theory of avalanche flow for glass beads in Sec. IV. Conclusions are drawn in Sec. V.
II Experimental section
In this section we describe the experimental apparatus and the characteristics of the granular materials. The experimental techniques and apparatus have been described in detail elsewhere boha2005 ; boec2006 so only essential features are presented here.
II.1 Experimental setup
A sketch of the experimental setup is shown in Fig. 2. The granular material flows out of the hopper at a constant flow rate . The grains first hit a small metal plate that disperses the material so that the mass flux per unit width is relatively homogeneous in the y direction transverse (of total width ) to the inclination direction . The grains are deposited on the top of the plane. The metal plate helps reduce possible electric charging of the particles during the hopper flow. The granular layer reaches a critical state locally and an avalanche is formed and travels down the plane. The layer into which the avalanche moved has approximate thickness . The stable static layer is prepared by releasing grains at the top of the plane and letting the system relax, or by letting the hopper run for a longer period of time. The glass plate has dimensions of 220 cm x 40 cm with a rough surface prepared either by gluing one layer of the same particles onto it or by using sandpaper with different roughnesses. The two main control parameters of the system are the plane inclination angle and the nature of the granular material used. The incoming flux and the roughness of the plane could be also varied. As we show in the following, within the limits presented below, variations in these latter parameters do not influence the results presented in this paper. The dynamics of the avalanches are recorded with a fast video camera (up to 2000 frames per second) about 150 cm below the incoming flow (Camera 1).
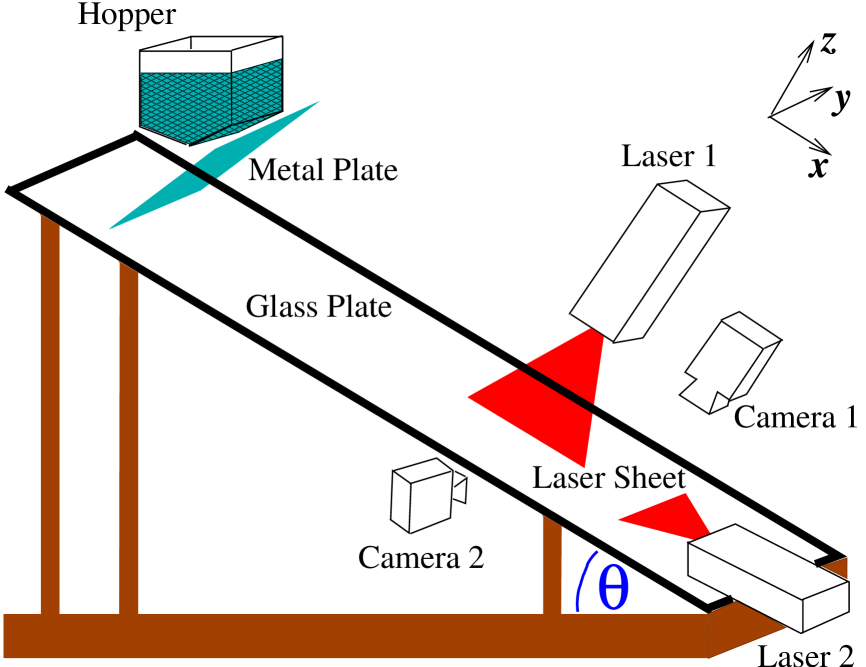
The vertical profiles of the avalanches along their symmetry axes are recorded with Camera 2 using a vertical laser sheet to detect the height differences (Laser 1). With another laser sheet (Laser 2) slightly inclined with respect to the glass plate, 2D height profiles of avalanches are reconstructed.
The incoming mass flow rate (per unit width along ) is fairly constant for all measurements of one material and is in the range g/cm-s depending on the material. The value of is chosen by determining the flux needed to produce a wave state where the entire width of the layer is in motion. The properties of such waves were explored experimentally for glass beads da2001 . The flux is set to approximately to obtain a reasonable number of distinct avalanches in the measurement area. For , adjusting only affects the total number of avalanches and their size distribution rather than the individual avalanche characteristics that are the focus of this paper.
II.2 Characterization of the materials
The shape of the granular particles has a large impact on the qualitative and quantitative behavior of avalanches in our system whereas other properties such as the mean particle diameter have less effect. For example, despite some relatively low polydispersity for the materials investigated ( except for fine sand which had ), we do not observe any effects attributable to size-induced segregation. To show the nature of the shape anisotropy qualitatively, we first show in Fig. 3 images of the glass beads (), fine () and coarse () sand and salt particles ().
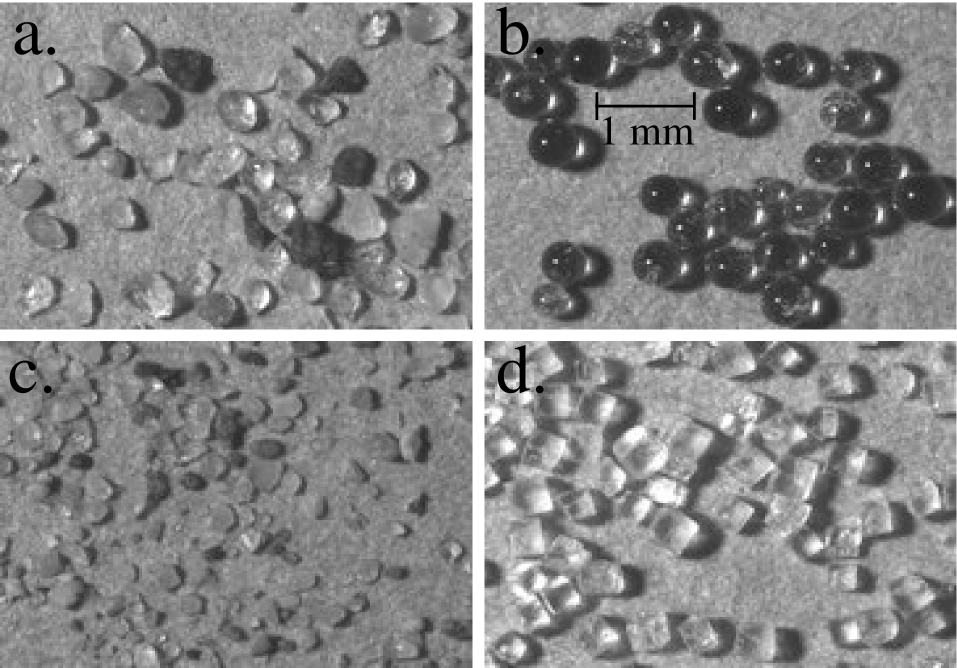
The glass beads are quite spherical although no attempt has been made to eliminate slightly aspherical particles, and no quantitative analysis of asphericity has been done. The sand has many irregular shapes ranging from approximately spherical to very angular. Finally, the salt grains take on very angular shapes reflecting the cubic symmetry of salt crystals. For the purposes of our studies, we assume that the grains do not change appreciably with time because the number of realizations of flows is limited, and the particle velocities are small. Thus, grains are not subjected to the repetitive collisions that might smooth their shape thereby changing the shape anisotropy or inter-particle friction.
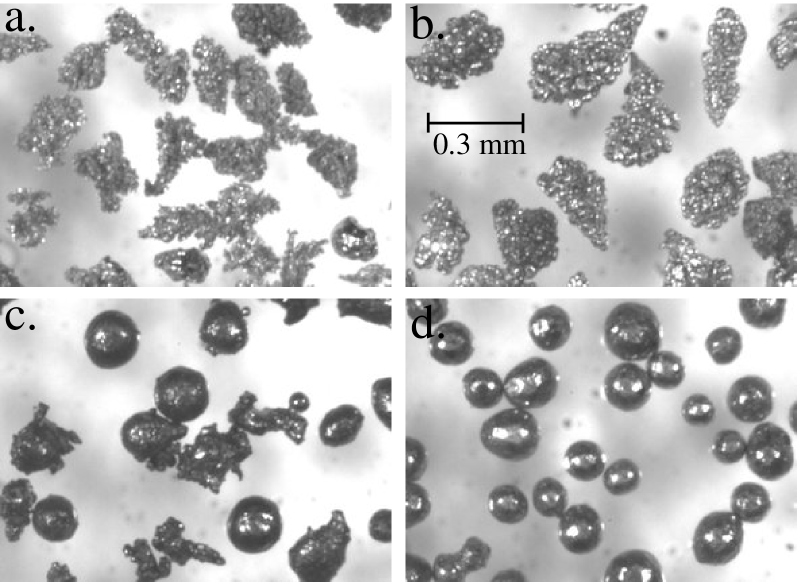
The copper materials are used to explicitly introduce a controlled shape distribution and explore the consequences of very different shapes on avalanche behavior. In Fig. 4, we show images of commercial (ECKA Granules GmbH Co.,KG.) copper particles (mean diameter m) with very different average shapes. The particles range from highly irregular, dendritic-like shapes to almost spherical. The overall anisotropy is measured by the static packing fraction for each shape, ranging from 0.25 for irregular particles to 0.63 for spherical copper particles. For comparison, the packing fraction for sand is about 0.56 and for spherical glass beads is 0.63.
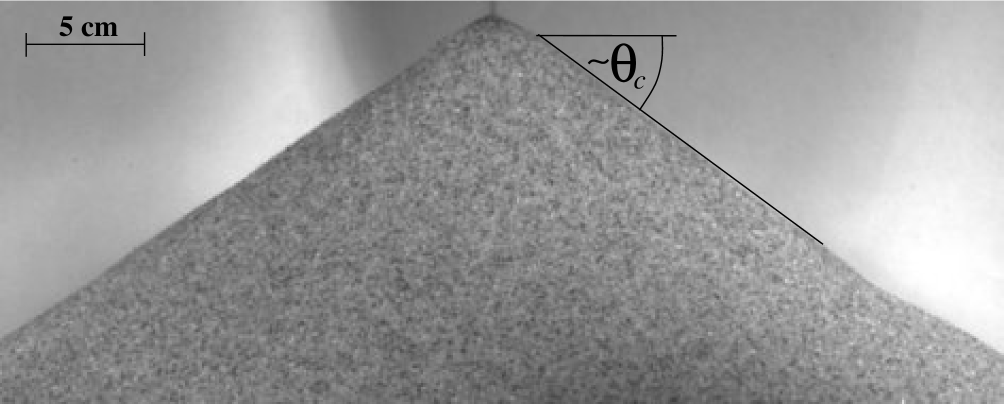
The next thing to consider is how the different shapes and properties of the materials affect the basic granular flow properties, in particular and of the bulk material. We do so by observing avalanches on bulk heaps with a high speed video camera. As material is added at a very small rate to the top of the pile, avalanches form and propagate downwards intermittently. The basic configuration is shown in Fig. 5 where a bulk pile of sand is shown with a line indicating the determination of local (just before an avalanche) or (just after an avalanche, not shown).
The distribution of the critical angle and that of the angle of repose is plotted for 100 avalanches for each of the different materials investigated.
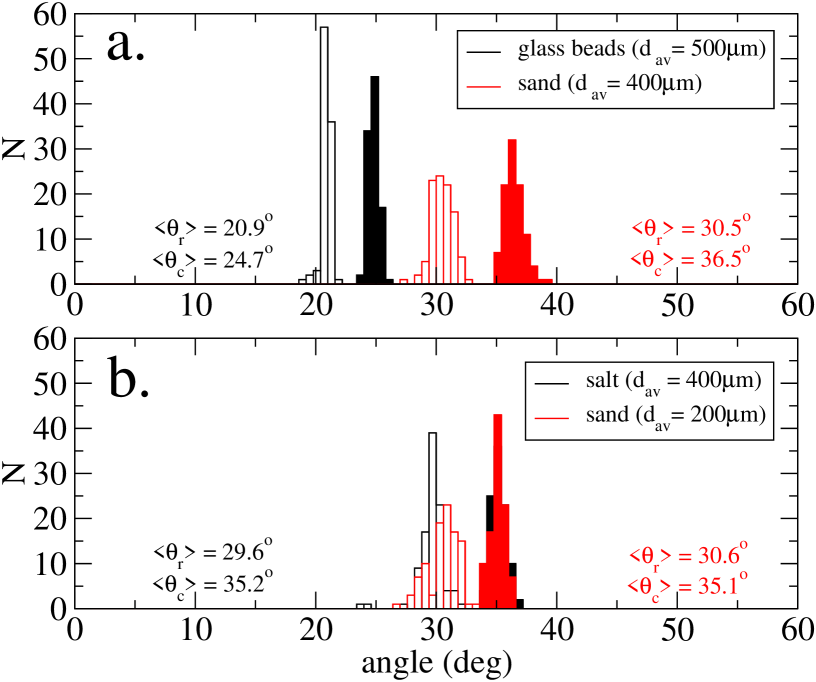
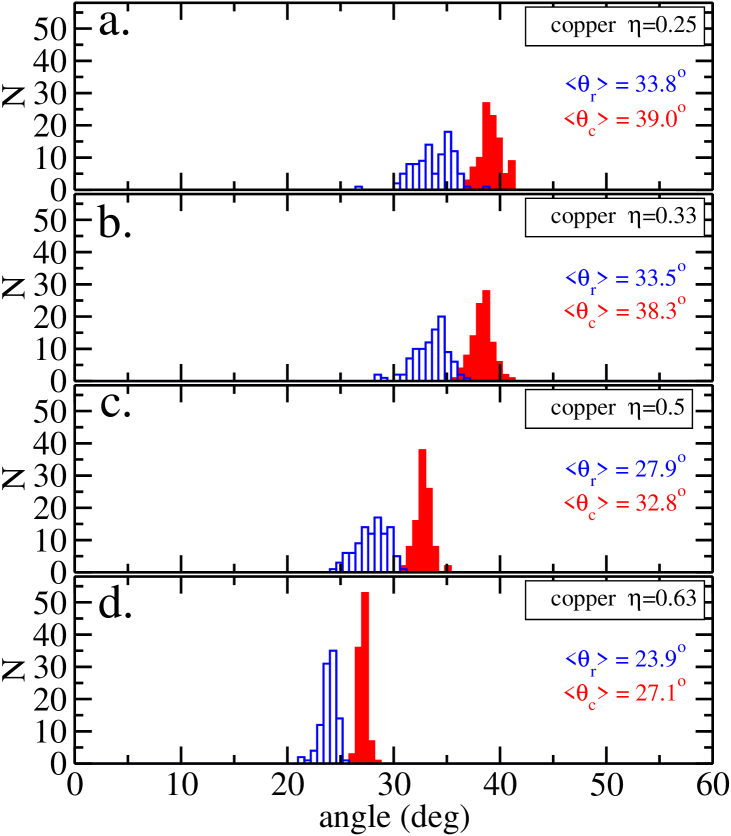
The distributions for the glass, sand and salt are shown in Fig. 6 and the distributions for the copper particles are presented in Fig. 7. The average values of and are indicated. As expected, and are significantly higher for the piles formed by particles of irregular shape compared to piles of spherical particles. The widths of the distributions are also larger for irregular particles because shape irregularity gives rise to a larger variety of configurations and a wider range of angles at which avalanches start or stop.
For thin layers on an inclined plane, grains start or stop flowing at angles determined by the layer thickness as well as by their individual properties such as shape or surface roughness. In our experiments, we determine for each material the height at which the material stops flowing, the thin layer equivalent of the bulk angle of repose. In a technique described in detail elsewhere boec2007 , we allow material to flow by slowly adding grains at the top of the plane resulting in intermittent avalanches. Upon stopping the input, the layer comes to rest, and the volume of grains on the whole plane is determined. Knowing the surface area of the plate allows a determination of the mean height with high precision, typically 2. Alternatively, a large quantity of grains is placed on the inclined plane, and a continuous flow persists over the entire plane for 10 - 20 seconds. After the flow subsides, the thickness of the resulting static layer is the same to within experimental error as that determined by the first method.
Many of the details of the characteristics of flow on our inclined plane, including the detailed comparison with the Pouliquen flow rule po1999 and the effects of surface roughness, have been presented elsewhere boec2007 . We summarize our results for the particular materials used here by collapsing the data using a normalized ratio of where is determined from the bulk measurement and normalizing the height by the particle diameter , see Fig. 8.
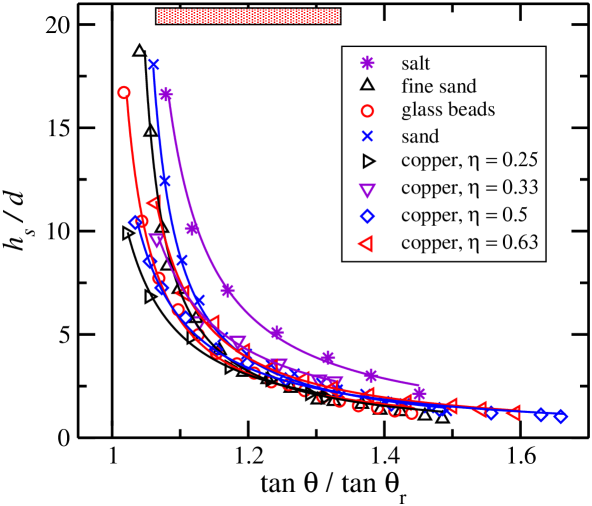
The continuous lines are best fits to the formula . The resulting values for the fitting parameters and are indicated in Table 1. For all the materials, the stopping height decreases with increasing as shown in Fig. 8, dropping rapidly for angles close to the bulk angle of repose and more gradually for larger .
| sample | ||
|---|---|---|
| salt | 0.63 | |
| fine sand | 0.35 | |
| glass beads | 0.26 | |
| sand | 0.4 | |
| copper, | 0.66 | |
| copper, | 0.52 | |
| copper, | 0.43 | |
| copper, | 0.35 |
The curves in Fig. 8 are for sandpaper with a roughness of mm. The corresponding data curve for sand on a surface prepared by glued sand particles is identical within experimental error. The collapse of the data suggest that differences in plane roughness do not translate into significant changes in . We have also tested the influence of the incoming flux and kinetic energy of the incoming particles on . For all the above configurations tested using different initial flow rates, the data points fall on the same curve within for . When approaching the measurements become less accurate with the rapid increase of leading to a uncertainty of the data points for .
There are several additional remarks about the system that are important. First, the majority of our measurements do not require detailed information about , the thickness at which grains start to flow for a particular . Thus, we have not made measurements of . When data about this quantity are needed as in the modeling section presented below, is estimated from measurements in similar systems po1999 . Second, avalanches are observed in the range of as indicated by the bar on the top of Fig. 8. For higher , even if a homogeneous static layer is prepared beforehand, the kinetic energy of the incoming grains is enough to slowly erode the pre-existing layer, and avalanches can only be observed for a short time.
II.3 Experimental procedures and analysis
For different materials and for different angles , we produce avalanches by adding grains continuously at the top of the plane. The main quantities of interest are the velocity of the front or of the individual grains, the lateral extent of the avalanche measured by the avalanche area , and the height of the layer as a function of position. These quantities are measured by analyzing images taken with the high-speed video cameras. Two images taken of transmitted light (Camera 1) for coarse sand at and are shown in Fig. 9.
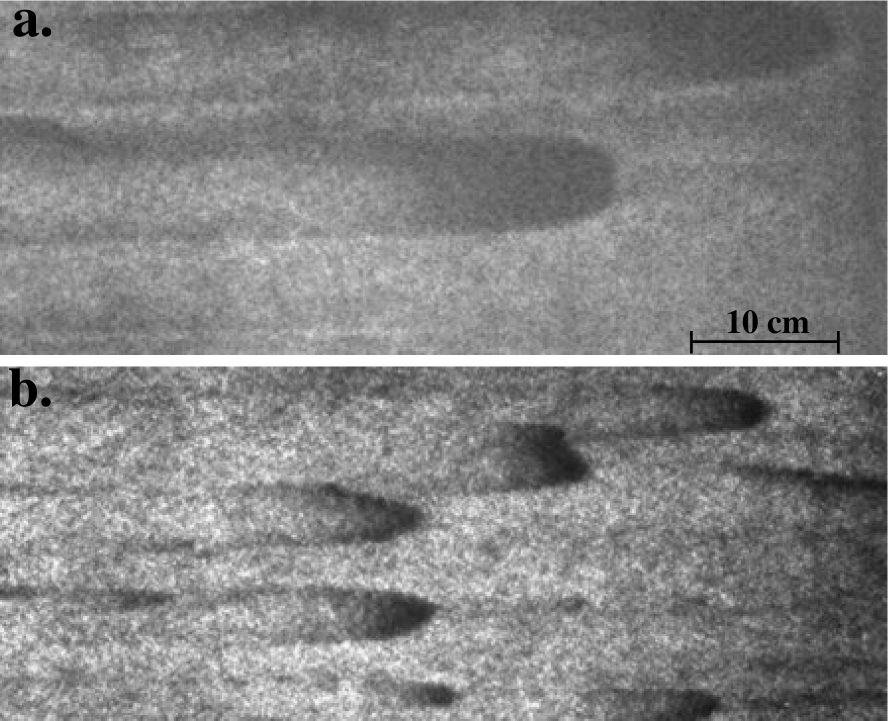
These avalanches are localized objects that can be isolated by differencing of subsequent images because regions were the grains move become visible on a uniform background. The area of the avalanche is determined by the areal extent over which finite displacements in image differencing are measured. Similarly the location of the front of the image differencing region is used to determine the front velocity .
To track the motion of individual grains inside the avalanches, a sequence of images are extracted from movies of the granular flow dynamics movieweb . Space-time plots are created by taking the intensity along the symmetry axis of the avalanche from movies taken by Camera . An example is shown in Fig. 10 for sand.
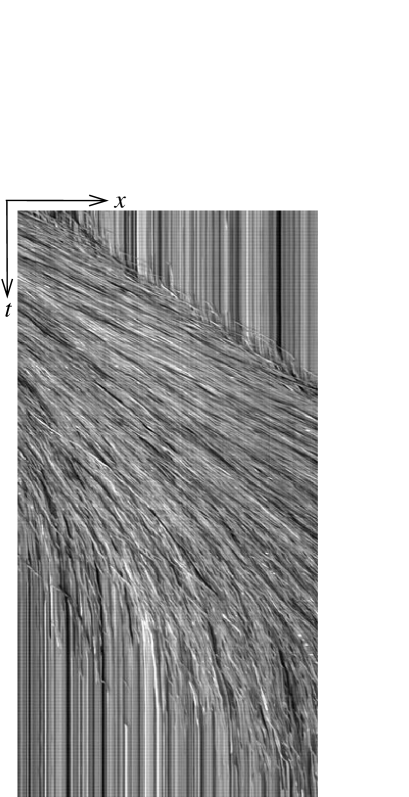
The vertical lines starting on the top of the diagrams are the traces of particles on the top of the static layer in front of the avalanche. The tilted trajectory dividing this region from the dynamic region is the trace of the avalanche front, providing a second method for determining . The traces of moving individual grains inside the avalanche are tilted lines. The change in the tilt of these traces as we go downwards (towards the end of the avalanche) indicates the decreasing particle velocity behind the front. By analyzing the space-time plots the mean particle velocity has been measured at several locations and the velocity profile has been determined. For this example using sand particles, the particles in the avalanche core (close behind the front) move faster than the front velocity of the avalanche.
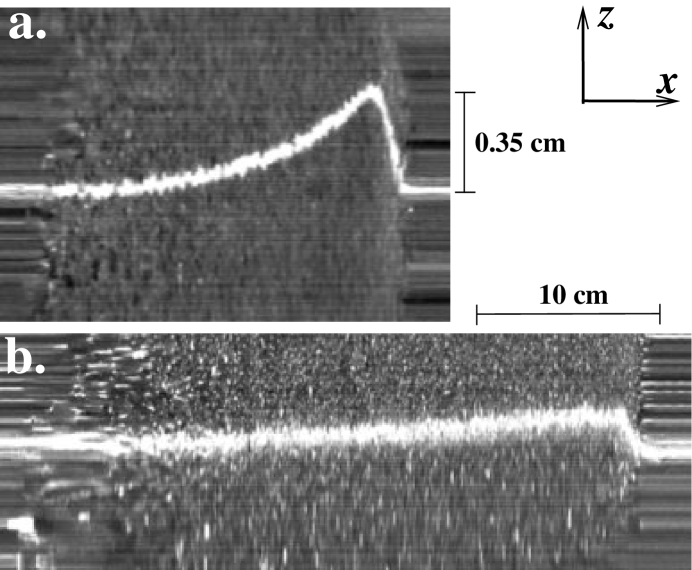
In order to trace the height profile of avalanches, a vertical laser sheet ( plane) is projected onto the plane. Movies are taken of avalanches that are cut by the laser sheet near their center (symmetry axis). The camera is mounted for these experiments on the side at an angle of about with respect to the plane (Camera 2 in Fig. 2). By measuring the speed of the avalanche and taking the intensity only along one vertical line of these movies, the profile of the avalanches can be traced assuming that the profile does not change as it passes through. In Figs. 11(a) and 11(b), profiles are shown for a sand and for a glass avalanche, respectively. The images are contracted by 25 times in the horizontal direction. This technique allows the instantaneous profile along one line to be determined.
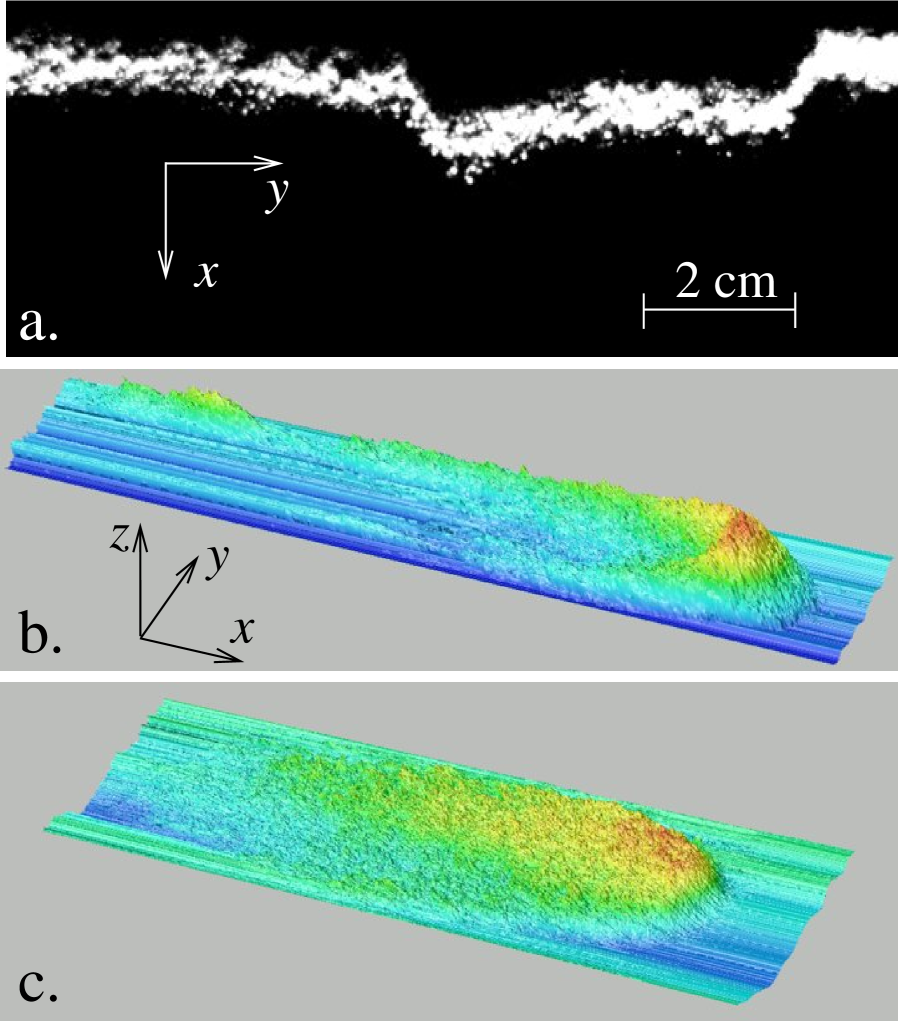
Another way to visualize the avalanches is to trace a laser line (Laser 2), see Fig. 2, across the direction of avalanche propagation, i.e., transverse to the plane inclination direction. Using the deflections of this laser line, the whole 2D surface of the avalanche is obtained. A sample image (from Camera 2) is shown in Fig. 12(a) for a sand avalanche. From the image sequence, the 2D height profile is reconstructed and is shown in Fig. 12(b) for the same avalanche and similarly for an avalanche formed by glass beads in Fig. 12(c).
III Results
The main objective of our experimental investigation is to understand the similarities and differences between avalanches of granular materials with different properties, particularly grain shape irregularity. We first describe some of the qualitative characteristics of the avalanches and then provide quantitative measures of those properties.
The avalanches we investigated are stationary (do not change with time) above a certain size with an overall shape that depends on the granular material. Glass bead avalanches have an oval shape, Fig. 12(c), whereas medium sized or large sand avalanches have two tails, Figs. 9(b) and 12(b), which can break off and form very small avalanches. Small sand avalanches typically do not have these tails. Very small avalanches are not stationary, but decelerate, lose grains, and eventually come to rest. The length of the observation area is about 8-12 times the length of small avalanches. Avalanches that are decelerating or that stop in the field of observation are not included in the data presented here. Interacting/merging avalanches are also eliminated.
To demonstrate the stationarity of avalanche size and speed, the time evolution of the front velocity and the characteristic size (the square root of the lateral area ) is shown for a set of avalanches in Figs. 13(a) and 13(b) for sand taken at . The smallest, slowest moving avalanches have a discernibly downward slope indicating a shrinking, decelerating avalanche. If the decay is exponential, the linear slope would yield a decay time of about 40 s for both the size and speed. For two avalanches of this initial size, one drops below a threshold, about 7 cm/s, and then quickly shrinks and decelerates until it vanishes. Another with about the same initial conditions, decreases in size and speed for awhile but seems to recover and survive.
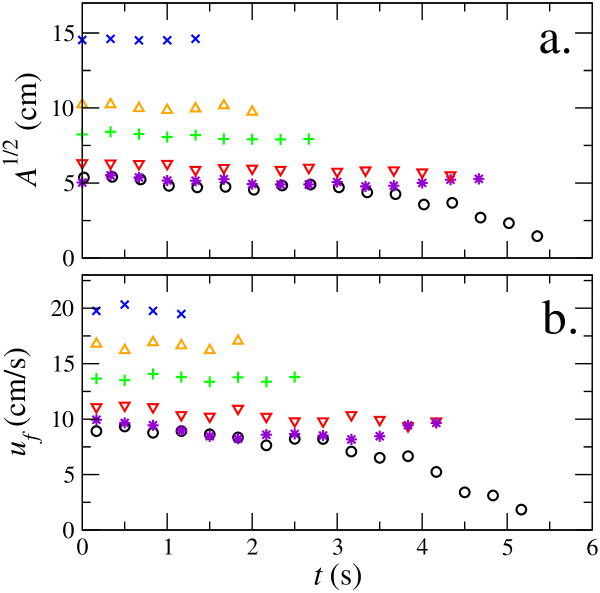
To understand the difference in avalanche survival for small sand avalanches, one needs to take account of the response of the static layer to the passage of an avalanche. Medium or big sand avalanches typically take material with them along their center and deposit grains along their edges (see Figs. 9 and 12). The change in the layer height is about 10 of . Thus, the different fates of austensibly similar sand avalanches suggests that small differences in residual layer thickness influence their evolution in that a small avalanche that encounters a slightly thinner region behind a recent large avalanche does not survive whereas a small avalanche propagating along the ridge formed by a large avalanche picks up a bit of mass and manages to survive (at least over the size of the interrogation window). No formation of residual ridges left by the wake of the avalanche is observed for small sand avalanches or for avalanches formed by glass beads. Although we have not studied this effect in detail for all the materials, one might surmise that the residual wake structure is a property of irregular grain avalanches whereas the spherical grain avalanches do not have this property.
We now present a quantitative analysis of the speed and size of avalanches whose properties are stationary over the length of the channel, about 200 cm. The avalanche velocity increases with avalanche size as shown in Figs. 14(a) and 14(b) for fine sand and glass beads, respectively.
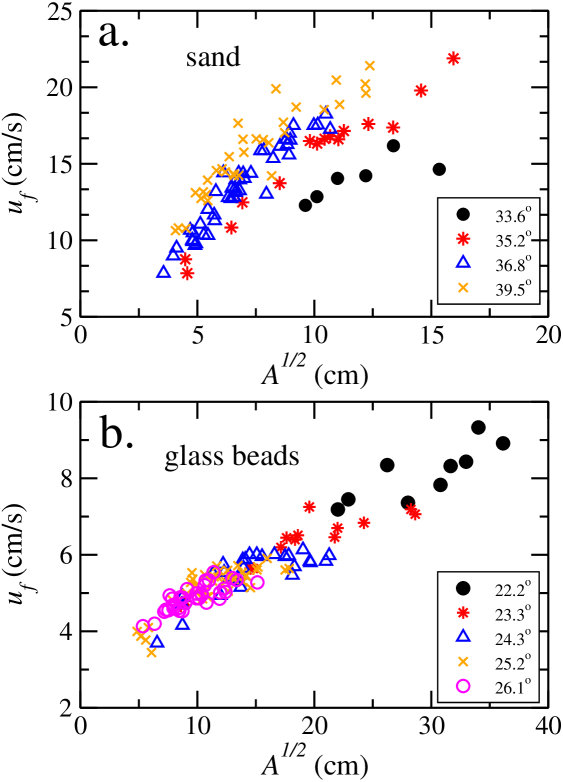
Similar sets of data were obtained for all eight materials. For anisotropic grains, avalanches move faster with increasing , see Fig. 14(a). On the other hand, avalanches formed by spherical beads are independent of in the sense that the curves obtained at various plane inclinations collapse, see Fig. 14(b). This observation is not in contradiction with data presented in da2001 , where avalanche speed for glass beads increases with decreasing . In fact, the tendency is the same here for the case of glass beads, as the average avalanche size increases with decreasing , Fig. 14(b), so that bigger avalanches (with larger velocity) are observed for less steep inclines. A similar analysis for the anisotropic particles is less conclusive, owing to the wide range of sizes and velocities measured. Nevertheless, after averaging for all avalanches of different sizes, the curve for anisotropic grains is fairly independent of as well.
To compare the curves for the different materials, it is useful to employ dimensionless parameters. For gravity driven flows on an incline the relevant length scale is and the appropriate velocity scale is erha2002 . The non-dimensionalization of the curves by these quantities collapses the data taken at various plane inclinations for each material. The collapsed curves are shown in Fig. 15(a) for sand, salt, and glass beads and in Fig. 15(b) for the copper particles.
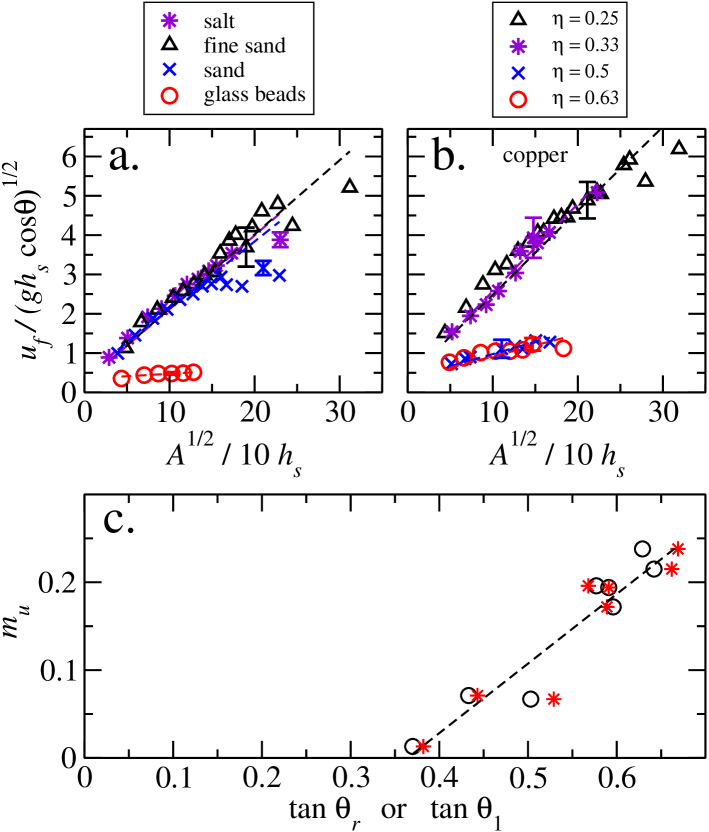
The dimensionless avalanche velocity increases linearly with increasing dimensionless avalanche size for all materials. The data fall into two classes: irregular shaped particles form avalanches that reach sizes about two to four times larger than those formed by spherical beads. Further, the speed of the avalanches from the irregular grains is about 4 times larger than that of the avalanches formed by spherical beads. For a better characterization of these differences, we compare the slope of the best fits to the data (shown with dashed lines in Fig. 15(a) and Fig. 15(b)) for all materials. In Fig. 15(c) is plotted as a function of the tangent of the angle of repose (or the vertical asymptote of the curve), both of which provide a measure of grain shape irregularity. We find that systematically increases with grain shape irregularity. In other words, the avalanche velocity increases with increasing avalanche size systematically for more irregular grains. Note that goes to zero at about , implying that for materials with a small angle of repose (below about ) the dimensionless avalanche velocity is small (about ) and independent of avalanche size.
Another measure of the avalanche size is its height, in particular the maximum height along the avalanche profile. We determine the height profile using the laser line method described in Sec. II. In Figs. 11(a) and 11(b), we see qualitatively that the height of glass avalanches is considerably smaller than that of sand avalanches. A second difference is that after the rapid increase in height at the front, a fast (exponential like) decrease is observed for sand avalanches whereas the height variation is straighter for avalanches formed by glass beads.
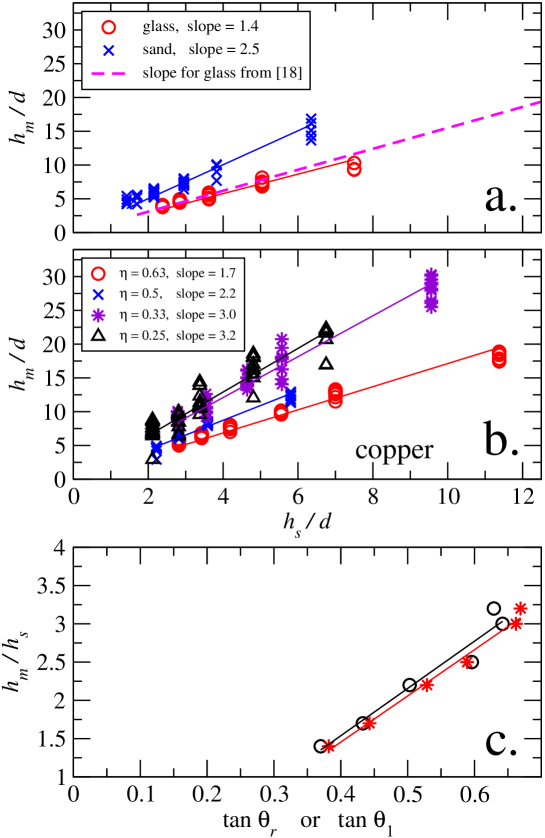
Numerous avalanche profiles have been recorded for sand, glass beads and all copper samples at the same sequence of plane inclinations as before to provide a quantitative analysis of avalanche heights. Plotting the avalanche peak height as a function of the thickness of the underlying layer , we find a systematic linear increase as shown for glass beads and sand in Fig. 16(a), implying that at lower plane inclinations where the static layer is thicker the avalanche height is proportionally larger. The slope of the curves gives a measure of the dimensionless avalanche height for a given material which is basically independent of the avalanche size and plane inclination and is and for glass beads and sand, respectively. Also shown is the slope for glass bead waves on a velvet cloth da2001 . The close correspondence despite the considerable differences in systems (cloth versus hard, rough surface) and phenomena (waves versus avalanches) is striking. For the copper particles (see Fig. 16(b)) falls in the range of as changes between . The general trend is that irregular particles form higher avalanches compared to avalanches of more spherical particles. To quantify this trend we again plot as a function of the tangent of the angle of repose (or the asymptote of the curve). As seen in Fig. 16(c), increases systematically with . This is an important relation as it provides a tool for predicting typical avalanche heights (for a given material) just by measuring the angle of repose of the material.
Having demonstrated that both the dimensionless avalanche height and the growth rate of avalanche speed with increasing avalanche size (defined as ) depend systematically on increasing grain shape irregularity, we can further explore whether such a tendency can be observed in other properties of avalanches. Using the space-time technique described in Sec. II, we can explore the ratio of the mean particle speed near the front to the front velocity .
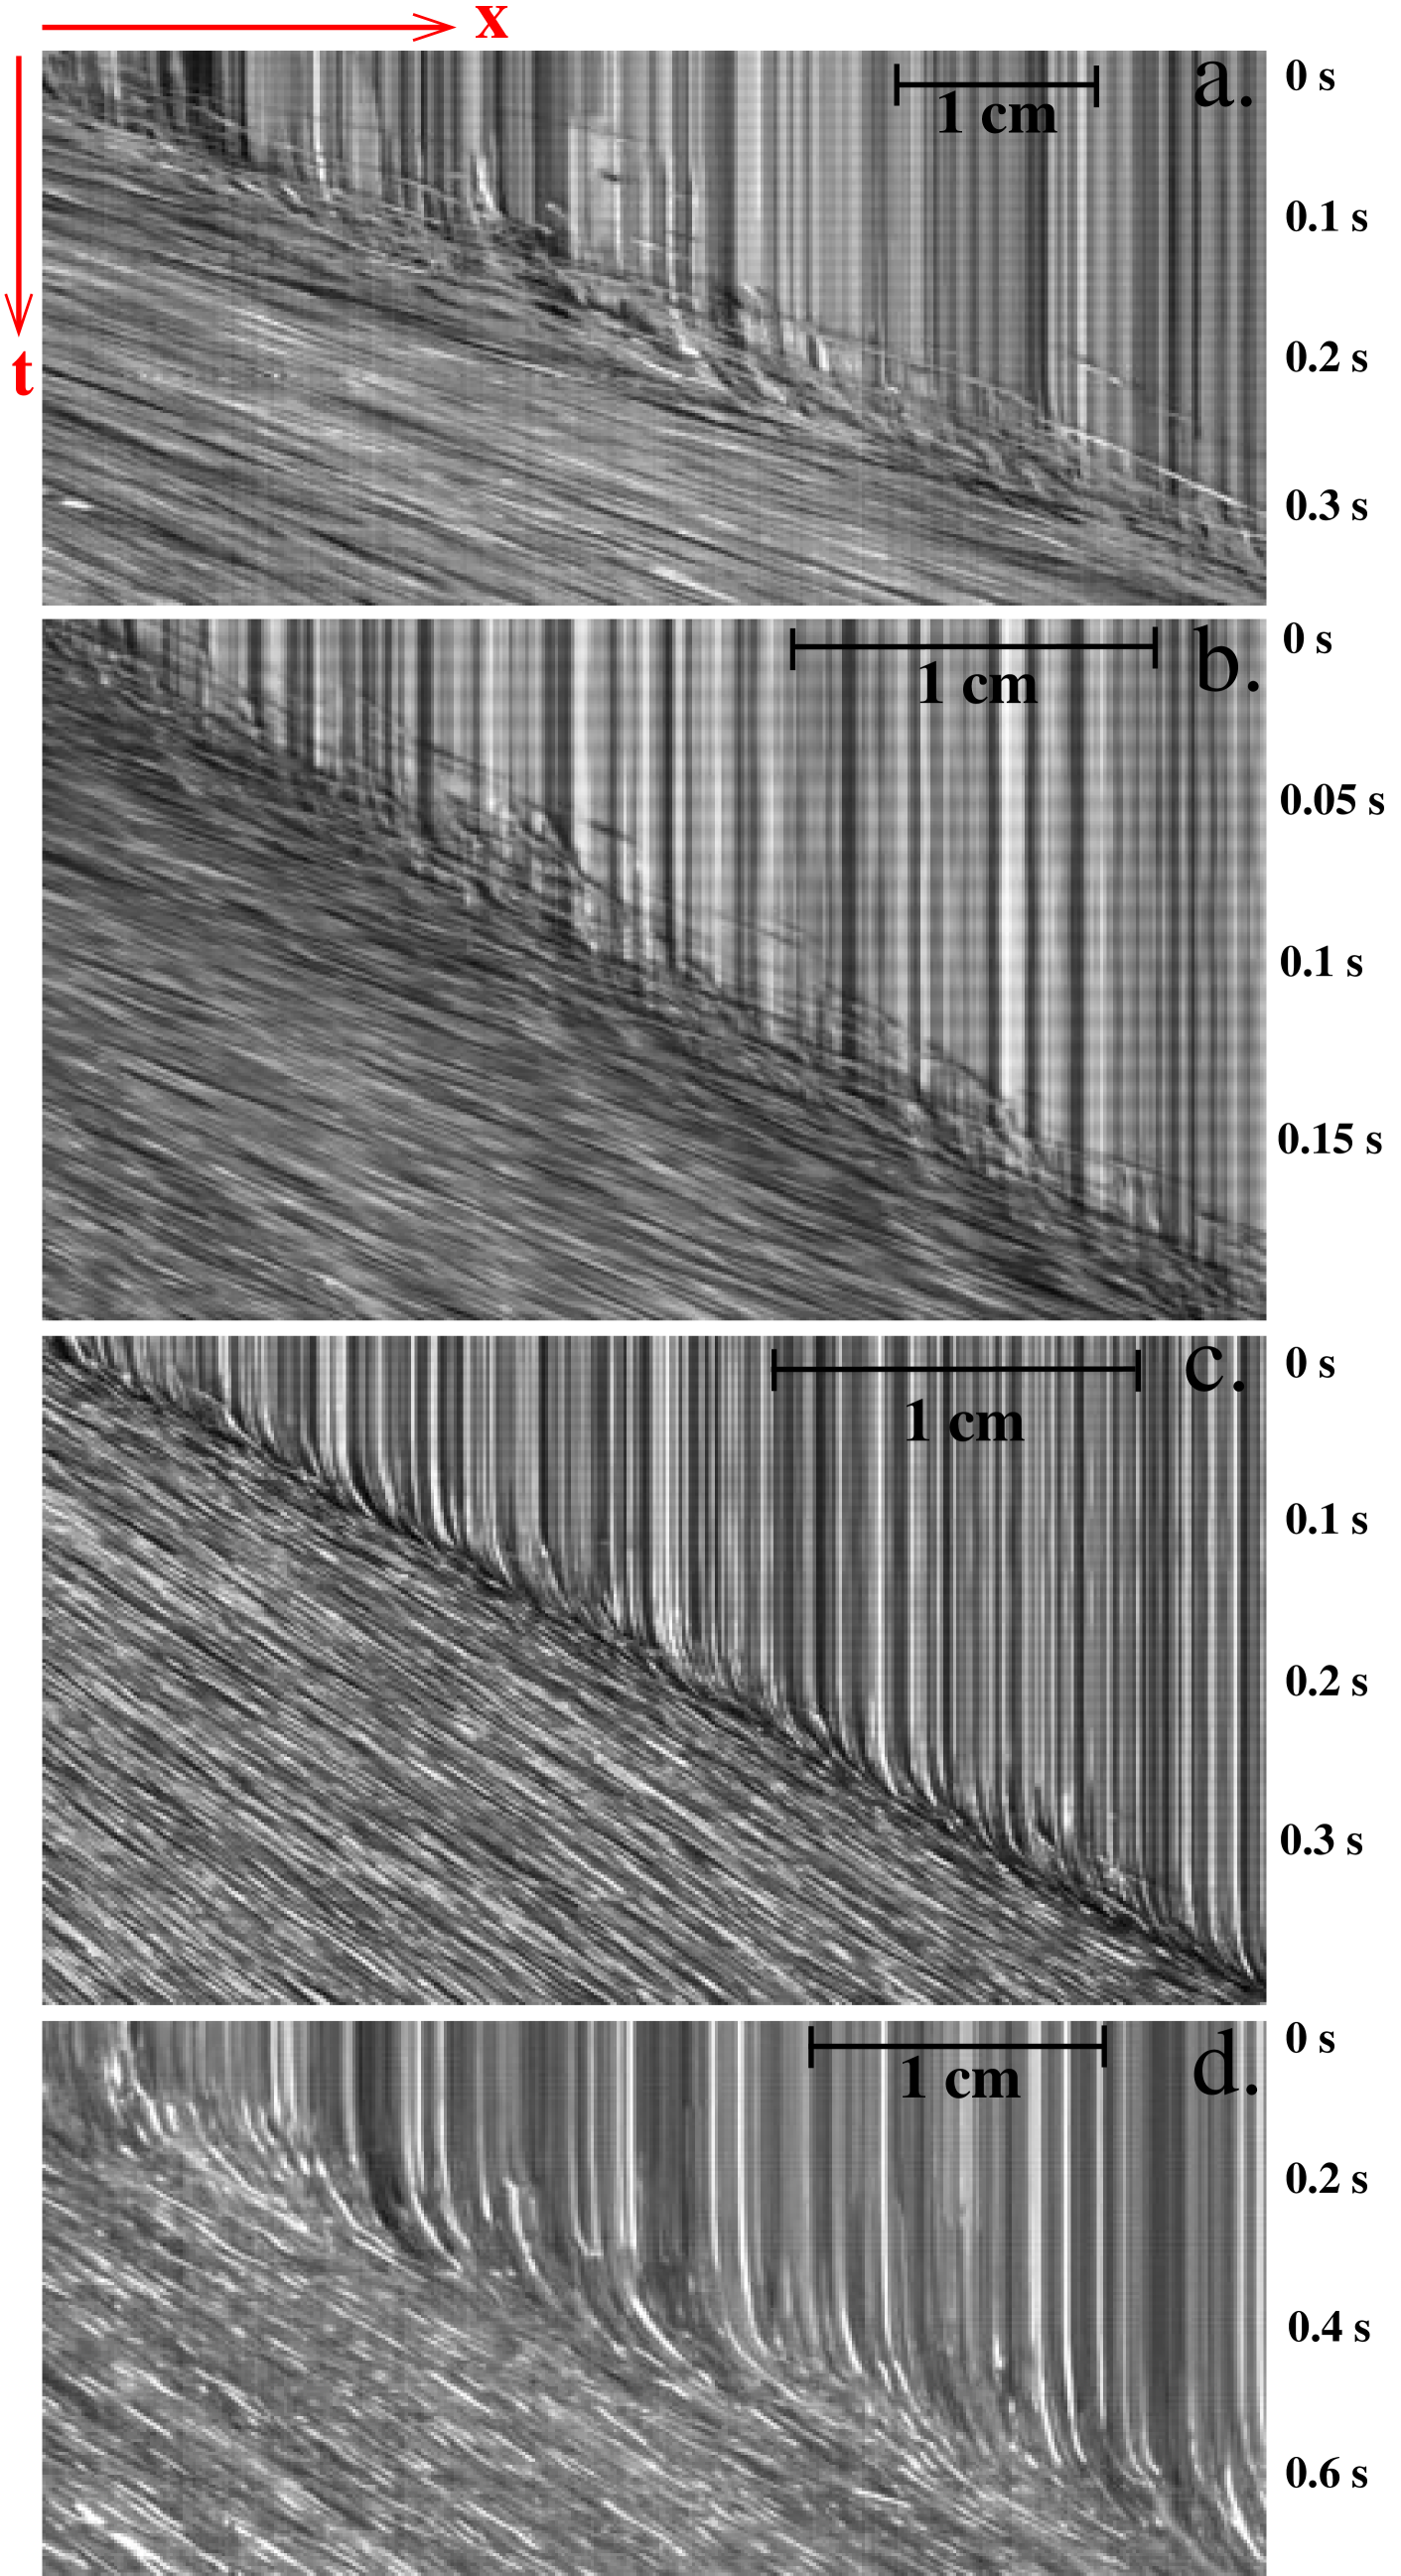
To compare the behavior at the front, four examples are shown in Figs. 17(a)-17(d) for sand, copper with , copper with , and glass beads, respectively. In Figs. 17(a) and 17(b) one sees that for anisotropic particles the velocity of particles is larger than the front velocity; in many cases particles are flying out of the main body of the avalanche and are stopped by the static layer in front of the avalanche. On the contrary for the avalanches formed by spherical beads, Figs. 17(c) and 17(d) particles are slower than the avalanche front, and particles in the static layer begin moving just before the actual particles in the avalanche arrive at that position. This is clearly seen in Figs. 17(c) and 17(d) by the curved trajectories of particles near the front which are initially at rest. To quantify these qualitative differences between particle and front motion, the average velocity of individual particles near the avalanche front and the front velocity are measured for numerous avalanches. At a given plane inclination the particle velocity as a function of the front velocity shows a linear dependence, as indicated in the inset of Fig. 18.
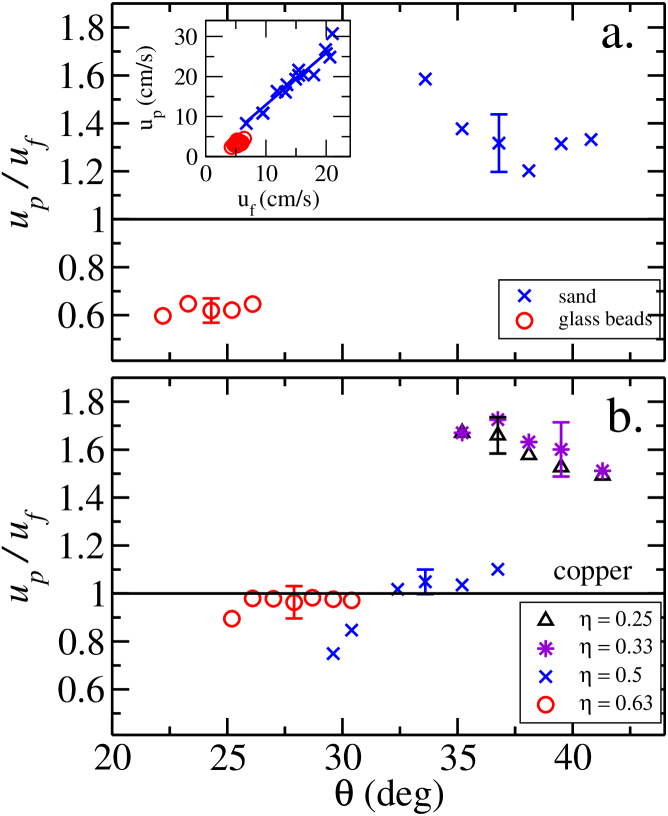
The ratio is plotted in Figs. 18(a) and 18(b) as a function of the plane inclination for sand/glass-beads and copper particles, respectively. For glass beads and sand particles, the separation is very clean with the spherical particles moving slower than the front with whereas the irregular sand particles overtake the front with . There may be a slight downward trend with increasing for irregular particles but the data do not differentiate that trend from a near constant ratio.
The ratios are again less clearly separated for copper particles with ratios close to one for the and particles. For whatever reason - perhaps inter-particle friction - spherical copper particles are marginal with respect to the separation of particle velocity and front velocity. The irregular copper particles have , considerably greater than one, and are well separated from the more spherical particles. For the irregular particles there is a definite decrease in with increasing .
To quantify how the ratio varies with grain shape irregularity, we again consider correlations between the ratio and the angle of repose (or ). There is a linear increase of as a function of (or ) with a slope of about 3.5 as shown in Fig. 19(a) for the 6 materials presented in Fig. 18.
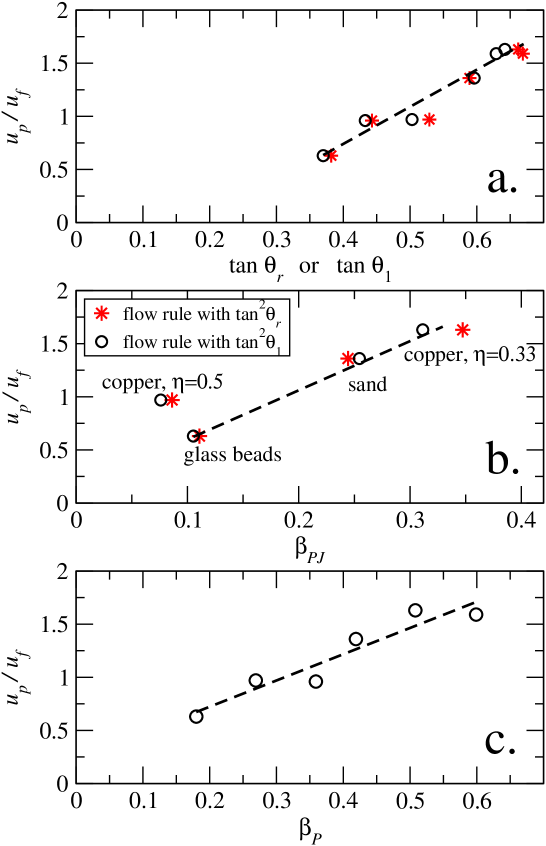
We also compare how the ratio varies with the equation relating and in the continuous flow regime, i.e., the granular flow rule. Earlier, we reported values of the slope in Eq. 2 for various materials boec2007 and found a systematic increase of with increasing grain shape irregularity, i.e., with increasing (or ). Plotting as a function of , we again find a systematic linear increase with a slope of about 2.8. The copper sample with seems to be anomalous, perhaps related to the peculiar dynamics of this set of copper in that it is the only copper sample emitting strong sound during shearing. This emission is similar to but much stronger than the sand from the Kelso dune which is known to be an example of “booming sand dunes” doma2006 . Interestingly this peculiarity is not reflected in the dependence of on , see Fig. 19(a).
Although the Pouliquen flow rule (Eq. 1) does not perfectly describe the flow properties of homogeneous flows, especially for the case of copper particles boec2007 , for the classification of avalanches we have determined by taking only data for relatively shallow flows where . Plotting as a function of (see Fig. 19(c)) we again find a systematic linear increase. We will come back to this observation in Sec. IV.
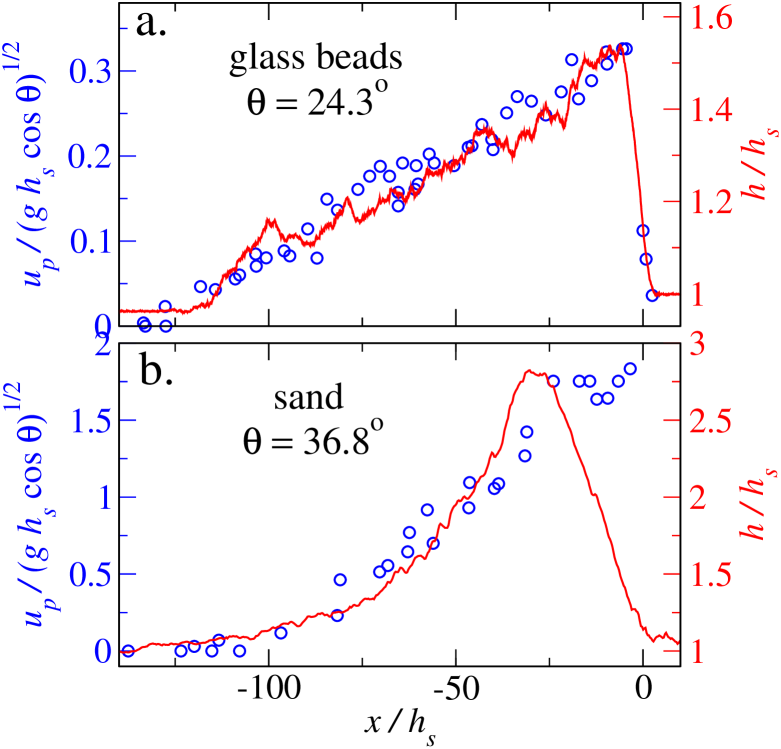
Finally, we consider the detailed profiles of velocity and height along the propagating direction of the avalanche. The particle velocity is obtained from space-time plots and the height profile from laser line measurements. The measurements are not made simultaneously but can be compared for avalanches with similar properties. We show profiles for glass beads and coarse sand in Figs. 20(a) and 20(b) with scaled velocity and height on opposite axes. The differences for sand and glass beads are striking. For glass beads, both velocity and height are approximately linear up to the maximum and then fall quickly over a steep but continuous front with a width of order 10. The slope of the surface behind the front is only slightly shallower than the unperturbed layer with whereas the fractional angular increase near the front is about 0.1, i.e., a difference of about 3-4∘ relative to the plane inclination angle.
For sand avalanches, a quite different picture emerges as shown in Fig. 20(b). First, the velocity maximum and the height maximum occur at different values of downstream distance with height peaking before velocity. Second, the height and velocity increase faster than linear from the back of the avalanche towards the front. Although we have adjusted the axes to align the maximal velocity and height of the avalanche, one can still see that the functional dependence for scaled velocity greater than one and are different. In other words, velocity and height are proportional for small values near the back of the avalanche but separate above values that, interestingly, differentiate in the mean between the spherical and irregular avalanche behavior. Despite the quite different width of the sand front, of order 25 , the fractional angular increase at the front is only slightly shallower than for glass beads, i.e., . The difference in profile for the sand arises from the nature of the particles near the front. Whereas the glass beads form a compact avalanche with a sharp but distinct front, the sand particles overtake the front as defined by the motion of the layer underneath creating a dynamics similar to a breaking wave. In the theory section below, we explore a depth-averaged approach for explaining the different avalanche behavior of spherical and irregular granular particles.
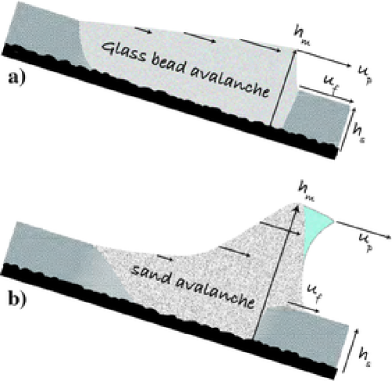
Although we cannot directly measure the interior profile of the avalanche, it is useful to provide a schematic illustration of the different type of avalanches to summarize what we have learned about them. In Fig. 21, we show the salient features of the two avalanche types. The case of shallower avalanches formed in materials with spherical particles is shown in Fig. 21(a). Here the granular layer fails, i.e., starts moving, just ahead of the avalanche (of order 5-10 ), leading to slower maximal particle velocities than the front velocity. The velocity and height of the avalanche are proportional and the variation of both quantities is linear in the down-plane direction. The form of the avalanche is reminiscent of a viscous Burgers shock as discussed in more detail below. In contrast, in Fig. 21(b) a sand avalanche is visualized having a larger maximal particle velocity than the front velocity and a considerably higher avalanche height. The avalanche seems to behave like a “breaking wave” with low density particles spilling over the crest at speeds higher than the front speed. The material directly under the front seems to be solid with the avalanche more slowly entraining the underlying material. Direct measurements of this entrainment and the form of the avalanche profile would be very useful but are beyond the scope of the present work.
IV Theory
The theory of avalanche behavior is complicated by the existence of a moving fluid phase in contact with a solid-like immobile granular phase. Thus, a complete theoretical picture of avalanche behavior certainly requires a multi-phase approach. On the other hand, since the granular material is moving over most of its extent except for small regions at the front and back, a simpler approach neglects the solid state ahead and behind the avalanche. We can then use a depth-averaged approximation, leading to the Saint-Venant shallow flow equations, adapted for granular media by Savage and Hutter sahu1989 . This approach was used in the analysis of wave formation in dense granular flows fopo2003 and was applied by us to sand and glass-bead avalanches described previously boha2005 .
For a flow of height and mean velocity , granular flow down a plane, with the plane parallel to the -direction, is described by the averaged equations for mass:
| (3) |
and momentum balance:
| (4) |
The value of is determined by the profile of the flow, for plug flow (as in Ref. sahu1989 ), for a linear flow profile, or 5/4 for a convex Bagnold profile doan1999 . The parameter is determined by the ratio of the normal stresses in the flow: the stress parallel to the bed, , and that perpendicular to the bed, . Numerical results show that for steady-state flows sier2001 .
The complicated part of this analysis concerns the friction coefficient fopo2002 . For example, if the layer is too thin at a particular , the flow stops and a friction coefficient appropriate for the flowing state is no longer valid. This transition from dynamic to static friction and the resulting yield condition for the solid phase in front of and behind the avalanche are not included in our approach and would be difficult to handle in a depth-averaged fashion. We will consider the consequences of this assumption later. For now we assume that the friction coefficient is determined by the requirement that the steady flow obeys the rheology specified in Eq. (5), and will thus vary with the particle type. For simplicity, we consider only the Pouliquen flow rule; the Pouliquen-Jenkins flow rule adds algebraic complexity without improved understanding of this model of avalanche behavior.
From the flow rule relation for steady-state flows (Eq. (1)) we obtain an expression for in terms of and :
| (5) |
The avalanches we will describe are observed for angles not very far from (i.e., ). In that range, the relationship
| (6) |
works very well in fitting the data for all the materials. The values for the two fitting parameters and are shown in Table 1 for sand, glass, and copper. As we obtain from (6)
| (7) |
The slower avalanches we describe correspond to the case of low Froude numbers . For example, glass beads avalanches correspond to . Since the left hand side (LHS) of Eq. (4) scales like , we can set the LHS to zero. Plugging the expression for (7) into the right hand side (RHS), we get:
| (8) |
| (9) |
Finally we use this form for to substitute into (3):
| (10) |
which yields:
where
| (11) |
This equation has solutions similar to those of Burger’s equation wh1999 . Thus, there is a solution consisting of a single hump propagating down the slope with velocity , with a smooth structure determined by the competition between this nonlinear velocity term on the LHS and the dissipative term (RHS) of Eq. (11). Numerical solution of this equation yields a fairly linear ramp behind the front, very similar to Fig. 20(a) for glass beads. Further, one can estimate the width of the front by balancing the dispersive term and the dissipative term, taking and where is the front width. Inserting values for the parameters in Eq. (11) yields a scaled front width , consistent with the height profile for glass beads in Fig. 20(a). We can also compare the predicted group velocity with the measured avalanche front velocity for glass beads. Using the peak height to evaluate , we obtain , again consistent agreement between theory and experiment.
The full equations of mass and momentum conservation are hyperbolic with characteristic velocities
| (12) |
If the velocity appearing in Eq. (11) does not obey , then Eq. (11) predicts a structure that moves faster than the maximum rate at which information can be propagated in the full system of equations, which is clearly impossible. For faster avalanches such as sand, the small Froude number limit is not valid since Fr 1. In these circumstances, the Burger’s type solution transforms itself into a truly discontinuous solution traveling at velocity wh1999 , which is described by the full system Eqs. (3-4) rather than by Eq. (11).
We can directly test the conditions for which is valid in terms of avalanche height. The normalized avalanche height as taken from the slope of the fits in Figs. 16(a) and 16(b) is shown in Fig. 22 for glass beads, sand and all four copper samples as a function of the flow rule slope (using ). We find a systematic increase of as a function of ,
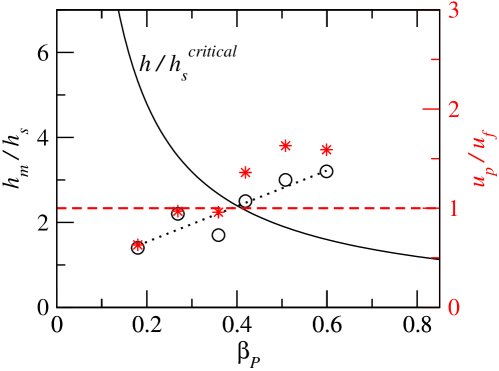
as we did when plotting as a function of (see Fig. 16(c)). On the other hand, the boundary between the two regimes corresponding to results in a critical thickness of the flow that strongly decreases with increasing (see the continuous line in Fig. 22). The range below corresponds to smooth solutions of Eq. (11), with , whereas above theory predicts discontinuous solutions of the full system traveling at velocity . The line corresponding to the normalized avalanche height as a function of crosses this boundary, and the data points for sand and the two anisotropic (dendritic) copper grains fall above the curve, whereas data points for glass beads and the spherical copper samples fall below the boundary. This observation matches well with the result that the ratio of the particle velocity and the front velocity of the avalanche also increases with increasing and crosses the value 1 at about the same location corresponding to (see Fig. 22).
Thus, we conclude that the glass bead avalanches, or more generally avalanches formed in materials with small , reflect smooth solutions of Eq. (11), with , whereas avalanches in sand or copper samples with highly anisotropic grains, or more generally in materials with higher , represent discontinuous solutions of the full system traveling at velocity . The latter avalanches propagate into a quiescent bed because they are traveling at the characteristic velocity for the medium. In the experiments the signature of these “discontinuous” solutions is that grains move faster than the front speed, spilling or breaking ahead of the front in a low density “foam-like” phase. The crossover between these two regimes happens at . The glass bead avalanches are analogous to “flood waves” in river flows, whereas the sand avalanches are analogous to “roll waves” in these flows wh1999 ; dr1949 . Note that ahead of the flowing avalanche, the moving material propagates into a material at rest, which is presumably in a state close to the critical Mohr-Coulomb state nedderman . Unlike the flowing state, for which , in this critical state . Thus the transition region, in which the flow accelerates from rest into a pseudo-steady state described by the continuum theory, can be viewed as a region of passive Rankine failure, through which the compressive stress parallel to the bed, , is decreasing with time. The mechanics of this region are complex, and cannot be described by the Saint-Venant equations alone.
We should point out that in the linear theory of the instability of steady flows, developed by Forterre and Pouliquen, the criterion corresponds to the stable regime of these flows with respect to wave disturbances fopo2003 . Thus, our observation of discontinuous avalanches for sand and smooth avalanches for glass beads dovetails nicely with their observation that steady flows of sand are far more unstable to such disturbances than are steady flows of glass beads.
The theory as presented has several nice features that semi-quantitatively describe the dynamics of avalanches in a range of materials with varying shapes and inter-particle friction. Nevertheless, the theory fails to account for several important aspects of the flow. First, the generalized Burgers equation fails to capture the soliton-like nature of the individual avalanches, namely that they travel at constant speed and maintain uniform shape. One can include more physics by following Forterre and Pouliquen fopo2002 in providing a parameterization of the friction coefficient that accounts for the static friction component and hysteresis between flowing and solid phases. Numerical simulations of either the full 2D equations or a 1D version of the Saint-Venant equation with a more realistic friction, fail to resolve this difference SlimPC . In particular, for glass beads one obtains a solitary localized solution but one with a flat rather than linear height profile behind the front. In that case, the speed is controlled by a front condition rather than by the mechanism consistent with our theory. We find empirically that the predicted velocity is greater than the measured , so perhaps a similar control is at play for the glass beads. For sand avalanches, full numerical simulations yield a form similar to our theory but again the height decays rather than assuming a constant profile. Thus, although the theory presented here captures some of the ingredients of our experimental avalanches, the two phase nature of the avalanches is probably necessary for a more quantitative description of our results.
V Conclusions
The main conclusion of our experimental study of avalanches is that the form of the avalanche depends on the granular particles. Differences are found not only at the quantitative level, but in the qualitative features (front propagation, avalanche shape, grain dynamics) which reflect the dramatic differences between smooth grains such as glass beads and irregular grains like sand. Measuring the basic avalanche properties such as velocity and size, we find a systematic linear increase of the normalized avalanche peak height with increasing or , where is the angle of repose of the material and is the slope of the depth-averaged flow rule, both measures of grain shape irregularity. Similarly, the slope of the dimensionless velocity versus size curves increases linearly with increasing , suggesting that the avalanche velocity increases with increasing avalanche size systematically faster for more anisotropic grains. These two relations enable us to predict typical avalanche sizes and the growth rate of avalanche velocity as a function of increasing size for various materials, by simply measuring or .
When focusing on the dynamics of individual grains (and comparing it to the propagation of the avalanche), another characteristic difference is found for spherical and non-spherical particles. Particles with irregular shape move considerably faster than the avalanche front, indicating that inertia is an important ingredient in these faster moving avalanches. For avalanches formed by spherical particles, on the other hand, front propagation is transmitted through the contact points (force chains) near the front, thereby inducing motion through a collective yield (failure) condition at the front. In the latter case, the velocity of individual grains is considerably smaller than the front velocity. When quantifying this important property of avalanches we again find a direct correspondence between and either , the angle of repose of the material, or the slope of the depth averaged flow rule (or ). The value increases linearly with increasing or . These relationships again provide a tool for predicting the dynamical properties of avalanches by simply measuring or for a given material. The direct correspondence should be valid for moderately polydisperse materials, but may not be valid for highly polydisperse materials where segregation effects become important.
In Section IV we have shown that a simple depth-averaged description can capture a strong change in the dynamical behavior of avalanches if we know the basic (depth-averaged) rheology of the material. Also the striking difference between the behavior of avalanches formed by spherical and nonspherical particles warns us that when modeling granular avalanches or granular dynamics in general, predictions obtained by the simplest models neglecting shape irregularities might not be valid for systems with non-spherical particles. Our measurements, however, provide numerous additional quantitative features of avalanches for grains with different rheologies that cannot be captured by the simple theory presented here, leaving room for further theoretical or numerical studies that can provide a better understanding of avalanching behavior.
The authors benefited from discussions with Brent Daniel, Anja Slim, Michael Rivera and Michael Stepanov. One of us (R.E.E.) acknowledges the support of the Aspen Center for Physics. This research was funded by the U.S. Department of Energy under Contracts No. W-7405-ENG and No. DE-AC52-06NA25396. T.B. acknowledges support by the Bolyai János research program and the Hungarian Scientific Research Fund (Contract No. OTKA-F-060157).
References
- (1) H.M. Jaeger, S.R. Nagel and R.P. Behringer, Rev. Mod. Phys. 68 1259 (1996).
- (2) J. Feder, Fractals 3, 431 (1995).
- (3) J. Rajchenbach, Phys. Rev. Lett. 65, 2221 (1990).
- (4) J. Rajchenbach, Phys. Rev. Lett. 88, 014301 (2001).
- (5) S. Courrech du Pont, R. Fischer, P. Gondret, B. Perrin and M. Rabaud, Phys. Rev. Lett. 94, 048003 (2005).
- (6) D. Bonamy, F. Daviaud and L. Laurent, Phys. of Fluids 14, 1666 (2002).
- (7) D. J. Durian, J. Phys. Cond. Mat. 12, A507 (2000).
- (8) P.-A. Lemieux and D. J. Durian, Phys. Rev. Lett. 85, 4273 (2000).
- (9) N. Nerone, M.A. Aguirre, A. Calvo, D. Bideau and I. Ippolito, Phys. Rev. E. 67, 011302 (2003).
- (10) S.J. Linz, W. Hager and P. Hänggi, Chaos 9, 649 (1999).
- (11) L.E. Silbert, Phys. Rev. Lett. 94, 098002 (2005).
- (12) T.S. Komatsu, S. Inagaki, N. Nakagawa and S. Nasuno, Phys. Rev. Lett. 86, 1757 (2001).
- (13) B. Andreotti and S. Douady, Phys. Rev. E. 63, 031305 (2001).
- (14) A. Aradian, E. Raphaël and P.G. de Gennes, Phys. Rev. E. 60, 2009 (1999).
- (15) T. Emig, P. Claudin and J.P. Bouchaud, Phys. Rev. E 71, 031305 (2005).
- (16) R.M. Iverson, M.E. Reid, N.R. Iverson, R.G. LaHusen, M. Logan, J.E. Mann and D.L. Brien, Science 290, 513 (2000).
- (17) A. Daerr and S. Douady, Nature 399, 241 (1999).
- (18) A. Daerr, Phys. of Fluids 13, No.7, 2115 (2001).
- (19) A. Daerr, Ph.D. thesis, University of Paris VII (France), (2000).
- (20) I.S. Aranson and L.S. Tsimring, Phys. Rev. E 64, 020301(R) (2001).
- (21) J. Rajchenbach, Phys. Rev. Lett. 89, 074301 (2002).
- (22) G. Félix and N. Thomas, Earth and Planetary Science Letters 221, 197 (2004).
- (23) F. Malloggi, J. Lanuza, B. Andreotti and E. Clément, Europhys. Lett. 75, 825 (2006).
- (24) E. Clément, F. Malloggi, B. Andreotti and I.S. Aranson, Granular Matt. 10, 3 (2007).
- (25) I.S. Aranson, F. Malloggi and E. Clément, Phys. Rev. E 73, 050302(R) (2006).
- (26) O. Pouliquen, Phys. of Fluids 11, No.3, 542 (1999).
- (27) O. Pouliquen and N. Reanut, J. Phys. II. France 6, 923 (1996).
- (28) R.A. Bagnold, Proc. R. Soc. London, Ser. A 255, 49 (1954).
- (29) GDR MiDi, Eur. Phys. J. E 14, 341 (2004).
- (30) L.E. Silbert, D. Ertas, G.S. Grest, T.C. Halsey, D. Levine and S.J. Plimpton, Phys. Rev. E 64, 051302-1 (2001).
- (31) L.E. Silbert, J.W. Landry and G.S. Grest, Phys. of Fluids 15, 1 (2003).
- (32) T. Börzsönyi and R.E. Ecke, Phys. Rev. E 76, 031301 (2007).
- (33) Y. Forterre and O. Pouliquen, J. Fluid Mech. 486, 21 (2003).
- (34) J.T. Jenkins, Phys. of Fluids 18, 103307 (2006).
- (35) B. Andreotti, A. Daerr and S. Douady, Phys. of Fluids 14, 415 (2002).
- (36) G.W. Baxter, R.P. Behringer, T. Fagert and G.A. Johnson, Phys. Rev. Lett. 62, 2825 (1989).
- (37) P.W. Cleary, Powder Technology 179, 144 (2008).
- (38) T. Börzsönyi, T.C. Halsey and R.E. Ecke, Phys. Rev. Lett. 94, 208001 (2005).
- (39) T. Börzsönyi and R.E. Ecke, Phys. Rev. E 74, 061301 (2006).
- (40) Movies of avalanches taken with a high speed camera can be downloaded from: http://www.szfki.hu/btamas/gran/avalanche.html or http://www.lanl.gov/orgs/mst/MST10/fluid dynamics/granular.shtml
- (41) D. Ertas, and T.C. Halsey, Europhys. Letts. 60, 931 (2002).
- (42) S. Douady, A. Manning, P. Hersen, H. Elbelrhiti, S. Protiere, A. Daerr, B. Kabbachi, Phys. Rev. Lett. 97, 018002 (2006).
- (43) S.B. Savage and K. Hutter, J. Fluid Mech. 199, 177 (1989).
- (44) S. Douady, B. Andreotti and A Daerr, Eur. Phys. J. B. 11, 131 (1999).
- (45) O. Pouliquen and Y. Forterre, J. Fluid Mech. 453, 133 (2002).
- (46) G.B. Whitham, Linear and Nonlinear Waves (Wiley, New York, 1999).
- (47) R.F. Dressler, Comm. Pure Appl. Math.2, 149 (1949).
- (48) R.M. Nedderman, Statics and Kinematics of Granular Materials (Cambridge Univ. Press, 1992, New York) Chapter 2.
- (49) A. Slim, Private Communication.