New results from the NA48/2 experiment at CERN SPS: radiative nonleptonic kaon decays
Abstract
The NA48/2 experiment at the CERN SPS carried out data taking in 2003 and 2004. Analysis of the selected data samples of 7,146 decay candidates with 0.6% background, 1,164 candidates with 3.3% background, and 120 candidates with 6.1% background allowed precise measurements of branching fractions and other characteristics of these rare kaon decays.
Introduction
Radiative nonleptonic kaon decays represent a source of information on the structure of the weak interactions at low energies, and provide crucial tests of the Chiral Perturbation Theory (ChPT). The current paper presents new results related to study of the , , and decays by the NA48/2 experiment at the CERN SPS.
The flavour-changing neutral current process , induced at one-loop level in the Standard Model and highly suppressed by the GIM mechanism, has been described by the ChPT[1]; several models predicting the form factor characterizing the dilepton invariant mass spectrum and the decay rate have been proposed[2, 3]. The decay is fairly well explored experimentally: it was first studied at CERN[4], followed by BNL E777[5] and E865[6] measurements.
The and decays similarly arise at one-loop level in the ChPT. The decay rates and spectra have been computed at leading and next-to-leading orders[7, 8], and strongly depend on a single theoretically unknown parameter . The experimental knowledge of these processes is rather poor: before the NA48/2 experiment, only a single observation of 31 candidates was made[9], while the decay was not observed at all.
The paper is organized as follows. In Section 1, a description of the NA48/2 experiment is given. Section 2 is devoted to a rather detailed description of the analysis and its preliminary results, which is the main topic of the paper. Section 3 briefly presents the preliminary results of the analysis; a more detailed discussion is reserved for the Moriond QCD 2008 conference. Section 4 briefly presents the final results of the analysis, which have recently been published[10]. Finally the conclusions follow.
1 The NA48/2 experiment
The NA48/2 experiment, designed to excel in charge asymmetry measurements[11], is based on simultaneous and beams produced by 400 GeV/ primary SPS protons impinging at zero incidence angle on a beryllium target of 40 cm length and 2 mm diameter. Charged particles with momentum GeV/ are selected by an achromatic system of four dipole magnets with zero total deflection (‘achromat’), which splits the two beams in the vertical plane and then recombines them on a common axis. Then the beams pass through a defining collimator and a series of four quadrupoles designed to produce focusing of the beams towards the detector. Finally the two beams are again split in the vertical plane and recombined in a second achromat. The layout of the beams and detectors is shown schematically in Fig. 1.
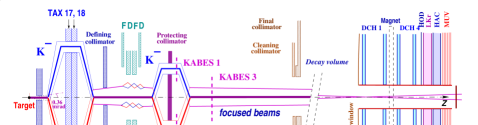
The beams then enter the decay volume housed in a 114 m long cylindrical vacuum tank with a diameter of 1.92 m for the first 65 m, and 2.4 m for the rest. Both beams follow the same path in the decay volume: their axes coincide within 1 mm, while the transverse size of the beams is about 1 cm. With protons incident on the target per SPS spill of s duration, the positive (negative) beam flux at the entrance of the decay volume is () particles per pulse, of which () are (). The flux ratio is about . The fraction of beam kaons decaying in the decay volume at nominal momentum is .
The decay volume is followed by a magnetic spectrometer housed in a tank filled with helium at nearly atmospheric pressure, separated from the vacuum tank by a thin () Kevlar composite window. A thin-walled aluminium beam pipe of 16 cm outer diameter traversing the centre of the spectrometer (and all the following detectors) allows the undecayed beam particles and the muon halo from decays of beam pions to continue their path in vacuum. The spectrometer consists of four drift chambers (DCH): DCH1, DCH2 located upstream, and DCH3, DCH4 downstream of a dipole magnet. The magnet provides a horizontal transverse momentum kick for charged particles. The DCHs have the shape of a regular octagon with a transverse size of about 2.8 m and a fiducial area of about 4.5 m2. Each chamber is composed of eight planes of sense wires arranged in four pairs of staggered planes oriented horizontally, vertically, and along each of the two orthogonal directions. The spatial resolution of each DCH is m. The nominal spectrometer momentum resolution is ( in GeV/).
The magnetic spectrometer is followed by a plastic scintillator hodoscope (HOD) used to produce fast trigger signals and to provide precise time measurements of charged particles. The hodoscope has a regular octagonal shape with a transverse size of about 2.4 m. It consists of a plane of horizontal and a plane of vertical strip-shaped counters. Each plane consists of 64 counters arranged in four quadrants. Counter widths (lengths) vary from 6.5 cm (121 cm) for central counters to 9.9 cm (60 cm) for peripheral ones.
The HOD is followed by a liquid krypton electromagnetic calorimeter (LKr)[12] used for photon detection and particle identification. It is an almost homogeneous ionization chamber with an active volume of 7 m3 of liquid krypton, segmented transversally into 13248 projective cells, 22 cm2 each, by a system of CuBe ribbon electrodes, and with no longitudinal segmentation. The calorimeter is deep and has an energy resolution ( in GeV). Spatial resolution for a single electromagnetic shower is cm for the transverse coordinates and .
The LKr is followed by a hadronic calorimeter (HAC) and a muon detector (MUV), both not used in the present analysis. A detailed description of the components of the NA48 detector can be found elsewhere[13]. The NA48/2 experiment took data during two runs in 2003 and 2004, with about 60 days of effective running each. About events were recorded in total.
In order to simulate the detector response, a detailed GEANT-based[14] Monte Carlo (MC) simulation is employed, which includes full detector geometry and material description, stray magnetic fields, DCH local inefficiencies and misalignment, detailed simulation of the kaon beam line, and time variations of the above throughout the running period. Radiative corrections are applied to kaon decays using the PHOTOS package[15].
2 analysis
The rate is measured relatively to the abundant normalization channel (with ). The final states of the signal and normalization channels contain identical sets of charged particles. Thus electron and pion identification efficiencies, potentially representing a significant source of systematic uncertainties, cancel in the first order.
2.1 Event selection
Three-track vertices (compatible with the topology of and decays) are reconstructed using the Kalman filter algorithm[16] by extrapolation of track segments from the upstream part of the spectrometer back into the decay volume, taking into account the measured Earth’s magnetic field, stray field due to magnetization of the vacuum tank, and multiple scattering in the Kevlar window.
A large part of the selection is common to the signal and normalization modes. It requires a presence of a vertex satisfying the following criteria.
-
•
Total charge of the three tracks: .
-
•
Vertex longitudinal position is inside fiducial decay volume: .
-
•
Particle identification is performed using the ratio of track energy deposition in the LKr to its momentum measured by the spectrometer. The vertex is required to be composed of one pion candidate (), and two opposite charge candidates (). No discrimination of pions against muons is performed.
-
•
The vertex tracks are required to be consistent in time (within a 10 ns time window) and consistent with the trigger time, to be in DCH, LKr and HOD geometric acceptance, and to have momenta in the range . Track separations are required to exceed 2 cm in the DCH1 plane to suppress photon conversions, and to exceed 15 cm in the LKr plane to minimize particle misidentification due to shower overlaps.
If multiple vertices satisfying the above conditions are found, the one with the best fit quality is considered. The following criteria are then applied to the reconstructed kinematic variables to select the candidates.
-
•
momentum within the beam nominal range: .
-
•
transverse momentum with respect to the measured beam trajectory: .
-
•
invariant mass: .
-
•
Suppression of the background defining the visible kinematic region: , which approximately corresponds to MeV/.
Independently, a presence of a LKr energy deposition cluster (photon candidate) satisfying the following principal criteria is required to select the candidates.
-
•
Cluster energy GeV, cluster time consistent with the vertex time, sufficient transverse separations from track impact points at the LKr plane ( cm, cm).
-
•
invariant mass compatible with a decay: MeV/.
-
•
The same conditions on reconstructed total and transverse momenta as used for momentum in the selection.
-
•
invariant mass: .
2.2 Signal and normalization samples
The reconstructed invariant mass spectrum is presented in Fig. 2 (left plot). The mass resolution is MeV/, in agreement with MC simulation. The mass resolution computed by MC simulation is MeV/.
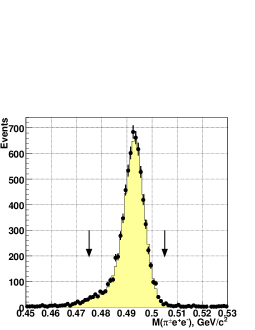
In total 7,146 candidates are found in the signal region. After the kinematical suppression of the decays, residual background contamination mostly results from particle misidentification (i.e. identified as and vice versa). The following relevant background sources were identified with MC simulations: (1) with misidentified and ; (2) with a misidentified from the decay. Background estimation by selecting the strongly suppressed[17] lepton number violating (“same-sign”) candidates was considered the most reliable method. For the above two background sources, the expected mean numbers and kinematic distributions of the selected same-sign candidates are identical to those of background events (up to a negligible acceptance correction). In total 44 events pass the same-sign selection, which leads to background estimation of . This result was independently confirmed with MC simulation of the two background modes.
In total candidates are found in the signal region. The only significant background source is the semileptonic decay. Its contribution is not suppressed by particle identification cuts, since no / separation is performed. The background contamination is estimated to be 0.15% by MC simulation.
2.3 Trigger chain and its efficiency
Both and samples (as well as ) are recorded via the same two-level trigger chain. At the first level (L1), a coincidence of hits in the two planes of the HOD in at least two of the 16 non-overlapping segments is required. The second level (L2) is based on a hardware system computing coordinates of hits from DCH drift times, and a farm of asynchronous processors performing fast track reconstruction and running a selection algorithm, which basically requires at least two tracks to originate in the decay volume with the closest distance of approach of less than 5 cm. L1 triggers not satisfying this condition are examined further and accepted nevertheless if there is a reconstructed track not kinematically compatible with a decay of a having momentum of 60 GeV/ directed along the beam axis.
The NA48/2 analysis strategy for non-rare decay modes involves direct measurement of the trigger efficiencies using control data samples of downscaled low bias triggers collected simultaneously with the main triggers. However direct measurements are not possible for the events due to very limited sizes of the corresponding control samples. Dedicated simulations of L1 and L2 performance (involving, in particular, the measured time dependencies of local DCH and HOD inefficiencies) were used instead. The simulated efficiencies and their kinematic dependencies were compared against measurements for the abundant and decays in order to validate the simulations.
The simulated values of L1 and L2 inefficiencies for the selected sample are , . The values of the integral trigger inefficiencies for the sample depend on the a priori unknown form factor; the corrections are applied differentially in bins of dilepton invariant mass. Indicative values of inefficiencies computed assuming a realistic linear form factor with a slope are , . The sample is affected by larger inefficiencies due to a smaller invariant mass of the system, which means that the leptons are geometrically closer.
2.4 Theoretical input
The decay is supposed to proceed through one photon exchange, resulting in a spectrum of the kinematic variable sensitive to the form factor [2]:
| (1) |
where , , and . On the other hand, the spectrum of the angle between and in the rest frame is proportional to , and is not sensitive to .
The following parameterizations of the form factor are considered in the present analysis.
-
1.
Linear: with free normalization and slope .
-
2.
Next-to-leading order ChPT[2]: with free parameters , and an explicitly calculated pion loop term .
-
3.
The Dubna version of ChPT parameterization involving meson form factors: [3], with resonance masses (, ) treated as free parameters.
The goal of the analysis is extraction of the form factor parameters in the framework of each of the above models, and computation of the corresponding branching fractions .
2.5 Fitting procedure
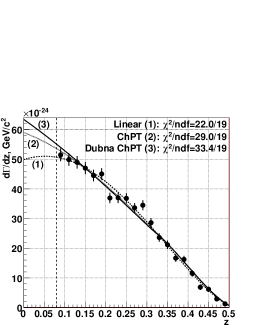
The values of in the centre of each -bin of , which can be directly confronted to the theoretical predictions (1), are then computed as
| (2) |
Here and are the numbers of observed candidates and background events in the -th bin, is the number of events (background subtracted), and are geometrical acceptance and trigger inefficiency in the -th bin for the signal sample (computed by MC simulation), and are those for events, is the nominal kaon width[19], is the chosen width of the bin, (FlaviaNet average[18]), (PDG average[19]).
The computed values of vs are presented in Fig. 2 (right plot) along with the results of the fits to the three considered models. in the full kinematic range corresponding to each model are then computed using the measured parameters, their statistical uncertainties, and correlation matrices.
In addition, a model-independent branching fraction in the visible kinematic region is computed by integration of . is to a good approximation equal to each of the model-dependent BRs computed in the restricted kinematic range .
2.6 Systematic uncertainties
The following sources of systematic uncertainties were studied.
1. Particle identification. Imperfect MC description of electron and pion identification inefficiencies and can bias the result only due to the momentum dependence of the inefficiencies, due to identical charged particle composition, but differing momentum distributions of the signal and normalization final states. Inefficiencies were measured for the data to vary depending on particle momentum in the ranges and in the analysis track momentum range. Systematic uncertainties due to these momentum dependencies not perfectly described by MC were conservatively estimated assuming that MC predicts momentum-independent and .
2. Beam line description. Despite the careful simulation of the beamline including time variations of its parameters, the residual discrepancies of data and MC beam geometries and spectra bias the results. To evaluate the related systematic uncertainties, variations of the results with respect to variations of cuts on track momenta, LKr cluster energies, total and transverse momenta of the final states , and track distances from beam axis in DCH planes were studied.
3. Background subtraction. As discussed above, the same-sign event spectrum is used for background estimation in the sample. The method has a limited statistical precision (with an average of 2 same-sign event in a bin of ). Furthermore, the presence of the component with two pairs (due to both decays and external conversions) with a non-unity expected ratio of same-sign to background events biases the method. The uncertainties of the measured parameters due to background subtraction were conservatively taken to be equal to the corrections themselves.
4. Trigger efficiency. As discussed earlier, the corrections for trigger inefficiencies were evaluated by simulations. In terms of decay rates, L1 and L2 corrections have similar integral magnitudes of a few . No uncertainty was ascribed to the L1 correction, due to relative simplicity of the trigger condition. On the other hand, the uncertainty of the L2 efficiency correction was conservatively taken to be equal to the correction itself.
5. Radiative corrections. Uncertainties due to the radiative corrections were evaluated by variation of the lower invariant mass cut.
6. Fitting method. Uncertainties due to the fitting procedure were evaluated by variation of the bin width.
7. External input. Substantial uncertainties arise from the external input, as is experimentally known only with 2.7% relative precision[19]. The only parameter not affected by an external uncertainty is the linear form factor slope describing only the shape of the spectrum.
| Parameter | Beam | Background | Trigger | Rad. | Fitting | |||
| ID | spectra | subtraction | efficiency | corr. | method | |||
| 0.01 | 0.04 | 0.04 | 0.03 | 0.05 | 0.03 | |||
| 0.001 | 0.006 | 0.002 | 0.001 | 0.006 | 0.003 | |||
| 0.001 | 0.005 | 0.001 | 0.002 | 0.005 | 0.004 | |||
| 0.009 | 0.015 | 0.017 | 0.015 | 0.015 | 0.010 | |||
| /GeV | 0.004 | 0.009 | 0.008 | 0.006 | 0.009 | 0.006 | ||
| /GeV | 0.002 | 0.003 | 0.003 | 0.003 | 0.004 | 0.002 | ||
| 0.02 | 0.02 | 0.01 | 0.01 | 0.01 | 0.02 | |||
| 0.02 | 0.01 | 0.01 | 0.01 | 0.01 | n/a | |||
The applied corrections and the systematic uncertainties (excluding the external ones presented later) are summarized in Table 1.
2.7 Results and discussion
The measured parameters of the considered models and the corresponding BRs in the full range, as well the model-independent , with their statistical, systematic, and external uncertainties are presented in Table 2. The correlation coefficients between the pairs of model parameters, not listed in the table, are , , and .
| 0.18 | ||||||
| 0.016 | ||||||
| 0.10 | ||||||
| 0.016 | ||||||
| 0.067 | ||||||
| 0.10 | ||||||
| 0.033 | ||||||
| 0.013 | ||||||
| 0.10 | ||||||
| 0.08 |
Fits to all the three models are of reasonable quality, however the linear form-factor model leads to the smallest . The data sample is insufficient to distinguish between the models considered.
The obtained form factor slope is in agreement with the previous measurements based on [5, 6] and [20] samples, and further confirms the contradiction of the data to meson dominance models[21]. The obtained , and are in agreement with the only previous measurement[6]. The measured parameters and are a few % away from the nominal masses of the resonances[19].
The branching ratio in the full kinematic range, which is computed as the average between the two extremes corresponding to the models (1) and (3), and includes an uncertainty due to extrapolation into the inaccessible region , is
It should be stressed that a large fraction of the uncertainty of this result is correlated with the earlier measurements. A comparison to the precise BNL E865 measurement[6] dismissing correlated uncertainties due to external BRs and model dependence, and using the same external input, shows a difference. In conclusion, the obtained BR is in agreement with the previous measurements.
Finally, a first measurement of the direct CP violating asymmetry of and decay rates in the full kinematic range was obtained by performing BR measurements separately for and and neglecting the correlated uncertainties: . The result is compatible to no CP violation. However its precision is far from the theoretical expectation[2] of .
3 analysis
The rate is measured relatively to the normalization channel. The signal and normalization channels have identical particle composition of the final states, and the only cut differing for the two channels is the one on the invariant mass. The used trigger chain involves the so called “neutral trigger” based on requirement of minimal number of energy deposition clusters in the LKr calorimeter.
About 40% of the total NA48/2 data sample have been analyzed, and 1,164 decay candidates (with background contamination estimated by MC to be 3.3%) are found, which has to be compared with the only previous measurement[9] involving 31 decay candidates. The reconstructed spectrum of invariant mass in the accessible kinematic region GeV/c2 is presented in Fig. 3, along with a MC expectation assuming ChPT distribution[7] with a realistic parameter . ChPT predicts an enhancement of the decay rate (cusp-like behaviour) at the mass threshold MeV/c2, independently of the value of the parameter. The observed spectrum provides the first clean experimental evidence for this phenomenon.
As the first step of the analysis, the partial width of the decay was measured assuming the ChPT shape with a fixed parameter . The following preliminary result, which is in agreement with the ChPT computation for , was obtained:
A combined fit of the spectrum shape and the decay rate is foreseen to measure the parameter.
4 analysis
The rate is measured relatively to the normalization channel. The signal and normalization channels have identical particle composition of the final states. The same trigger chain as for the collection of is used.
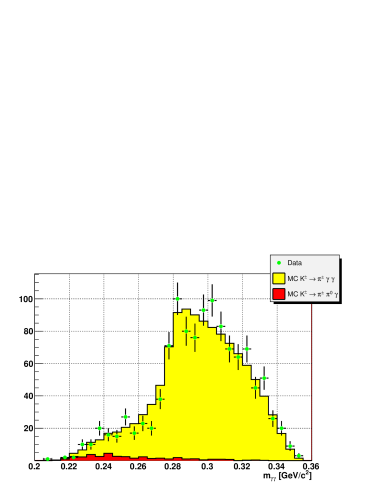
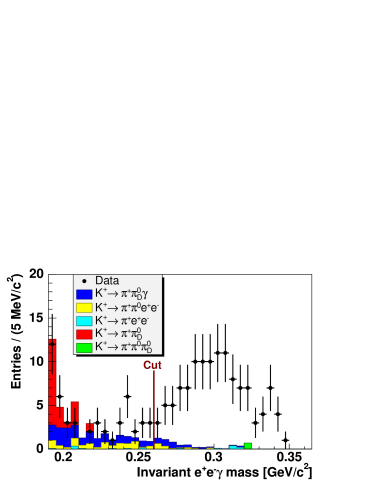
With the full NA48/2 data sample analyzed, 120 decay candidates (with the background estimated by MC to be 6.1%) are found in the accessible kinematic region GeV/c2. This is the first observation of this decay mode. The reconstructed spectrum of invariant mass is presented in Fig. 4, along with MC expectations for background contributions. The spectrum provides another evidence for the rate enhancement at the mass threshold.
Conclusions
A precise study of the decay has been performed. The data sample and precision are comparable to world’s best ones, the preliminary results are in agreement with the previous measurements, and the first limit on CP violating charge asymmetry has been obtained.
A precise study of the has been performed. The first clear evidence for a rate enhancement at mass threshold has been obtained. The preliminary measurement of BR agrees with the ChPT prediction. A detailed spectrum shape study is foreseen.
The first observation of the decay, and measurement of its parameters, including the BR, have been performed. The spectrum provides an independent evidence for the cusp at the mass threshold.
References
- 1 . G. Ecker, A. Pich, E. de Rafael, Nucl. Phys. B291 (1987) 692.
- 2 . G. D’Ambrosio et al., JHEP 8 (1998) 4.
- 3 . A.Z. Dubničková et al., Phys. Part. Nucl. Lett. 5, vol. 2 (2008) 76 [hep-ph/0611175].
- 4 . P. Bloch et al., Phys. Lett. B56 (1975) 201 (1975).
- 5 . C. Alliegro et al., Phys. Rev. Lett. 68 (1992) 278 (1992).
- 6 . R. Appel et al., Phys. Rev. Lett. 83 (1999) 4482.
- 7 . G. D’Ambrosio, J. Portolés, Phys. Lett. B386 (1996) 403.
- 8 . F. Gabbiani, Phys. Rev. D59 (1999) 094022.
- 9 . P. Kitching et al., Phys. Rev. Lett. 79 (1997) 4079.
- 10 . J.R. Batley et al., Phys. Lett. B659 (2008) 493.
- 11 . J.R. Batley et al., Eur. Phys. J. C52 (2007) 875.
- 12 . G.D. Barr et al., Nucl. Inst. Methods A370 (1996) 413.
- 13 . V. Fanti et al., Nucl. Inst. Methods A574 (2007) 433.
- 14 . GEANT detector description and simulatio tool, CERN program library long writeup W5013 (1994).
- 15 . E. Barberio and Z. Was, Comp. Phys. Comm. 79 (1994) 291.
- 16 . R. Frühwirth, Nucl. Inst. Methods A262 (1987) 444.
- 17 . R. Appel et al., Phys. Rev. Lett. 85 (2000) 2877.
- 18 . M. Antonelli et al., arXiv:0801.1817.
- 19 . W.-M. Yao et al. (PDG), J. Phys. G33 (2006) 1.
- 20 . H. Ma et al., Phys. Rev. Lett. 84 (2000) 2580.
- 21 . P. Lichard, Phys. Rev. D60 (1999) 053007.