Witnessing Galaxy-SMBH Co-Evolution at Redshift
Abstract
In a recent multiwavelength study of galaxies at by Daddi et al. (2007a,b) it is shown that galaxies with a Mid-IR excess most likely harbor a Compton-thick AGN, thus bringing to the fraction of galaxies hosting an AGN. This finding opens a number of intriguing issues concerning the concomitant growth of galaxies and supermassive black holes, AGN feedback, and downsizing, at the cosmic epoch of most intense star formation and nuclear activity.
INAF – Osservatorio Astronomico di Padova, Italy
Laboratoire AIM, CEA/DSM, France
1. Introduction
The current supermassive black hole (SMBH) and galaxy co-evolution paradigma rests on three main arguments, namely:
Virtually all (massive) spheroids host a SMBH,
The SMBH to stellar spheroid mass ratio is , within a factor of two, known as the Magorrian ratio (Magorrian et al. 1998; Ferrarese et al. 2006).
We may need AGN Feedback to expell residual gas in spheroids, switch-off star formation, and start making the passively evolving galaxies at (e.g., Granato et al. 2001; Bower et al. 2006).
This paper presents recent evidence on SMBH/galaxy coevolution at , i.e., at the peak of both galaxy growth and AGN activity, as derived from a recent in depth study of a sample of -selected, starforming galaxies in the GOODS Fields in the range (Daddi et al. 2007a,b). At these redshifts these galaxies account for of the total stellar mass, and for a major fraction of the total star formation rate.
2. Starforming and Mid-IR Excess Galaxies at
Star formation rates (SFR) in high redshift galaxies can be estimated in a number of ways, e.g. using the rest-frame UV, or the observed 24 m, 70 m, and sub-mm fluxes, or Radio and soft X-Ray data. Daddi et al. (2007a) have shown that for their sample of galaxies all these SFR indicators agree with each other within the errors, with one notable exception: the SFR estimated from Spitzer/MIPS 24 m data. This exception is illustrated by constructing the ratio:
| (1) |
where is the SFR from the rest frame 1500 Å flux before applying the extinction correction, is the SFR as derived from the rest frame 1500 Å flux after applying the extinction correction (estimated from the UV slope), and is the SFR as derived from the Spitzer/MIPS 24 m data, i.e., from the rest-frame m flux plus a model SED (e.g., Chary & Elbaz, 2001). Thus, this is meant to represent the ratio of the un-extincted SFR plus the extincted SFR, over the SFR corrected for extinction. Fig. 1 shows this ratio as a function of redshift for the sample galaxies.
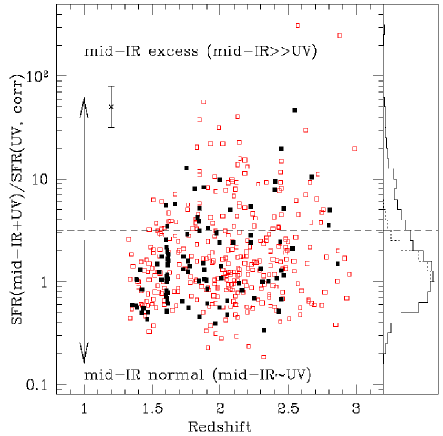
If both SFR estimates were unbiased, one would expect the distribution of this ratio to be like a Gaussian, peaking at , and be symmetric: the result of random errors in either estimates. Fig. 1 shows that the distribution does indeed peak at , but the distribution is skewed towards large values of . A Gaussian fitting the part of the distribution is also shown in Fig. 1, allowing to quantify in of the total the fraction of high galaxies, in excess of the Gaussian distribution. Thus, Daddi et al. isolate a population Mid-IR Excess galaxies, i.e., those for which the rest-frame 8 m flux overestimates the SFR, or, equivalently, the dust 24 m emission is in excess of what is expected from the extinction as estimated from the UV slope.
3. Compton-Thick AGNs are Widespread at
In principle, the excess SFR estimated from the 24 m flux may signal some inadequacy of the semi-empirical relation used to translate the rest frame m flux into a SFR. Alternatively, the Mid-IR excess may signal that dust is being heated also by an energy source other than star formation, i.e., nuclear activity.
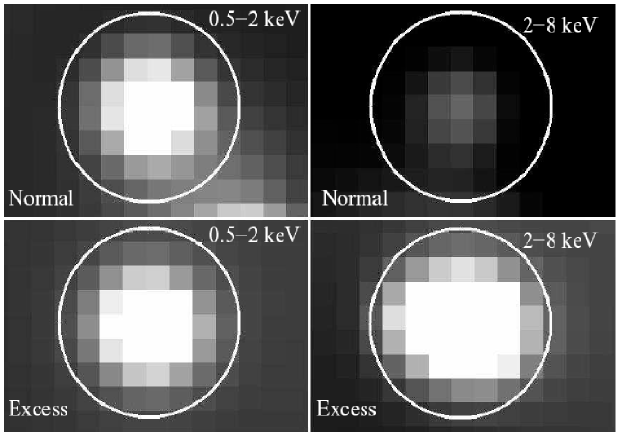
To explore this latter option, Daddi et al. (2007b) have appealed to Chandra X-ray data publicly available over the CDFS/GOODS field, proceeding to stack the X-ray images, separately for the normal () and the Mid-IR excess () galaxies, not including those galaxies which are individually detected in X-Rays. The result is shown in Fig. 2. Clearly, in the stacked images the normal galaxies are well detected in the soft band, but just barely in the hard band. The Mid-IR excess galaxies, instead, show strong emission also in the hard band, which is indeed interpreted as evidence for them hosting an X-ray emitting AGN.
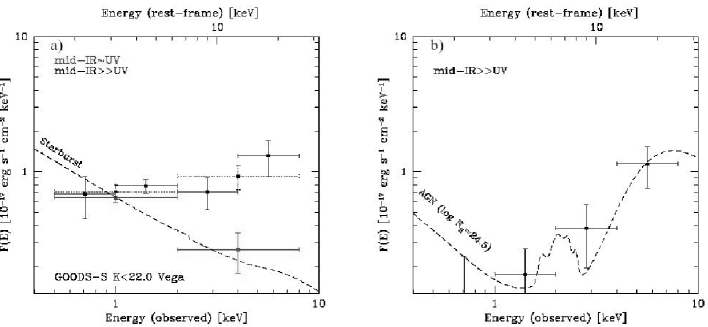
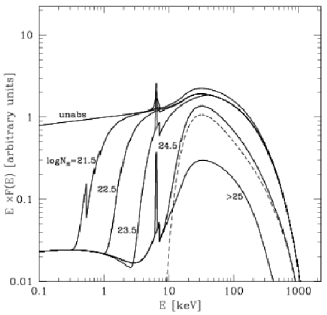
From the fit of their X-ray spactrum to those of model AGN spectra with different column densities of absorming material one infers that the AGN X-ray flux is heavily absorbed in the soft bands, as illustrated in Fig. 3, with log , indicating that the majority of such AGNs are Compton-thick. The model X-ray spectra by Gilli, Comastri & Hasinger (2007) used for the fit are shown in Fig. 4 (left panel).
Thus, Daddi et al. infer that at some 25% of galaxies host a Compton-thick AGN, and over hosts an AGN, when including also those galaxies that are individually detected in X-rays (about one half in number compared to the Mid-IR excess galaxies to the same limit, Daddi et al. 2007b). Clearly, nuclear activity was vastly more widespread at compared to the local universe. For a similar result see also Fiore et al. (2008).
4. The concomitant growth of the stellar mass and the BH mass
The redshift range, or the cosmic time from to Gyr since the Big Bang, marks the epoch of most intense star formation and nuclear activity. Hence, it must be the epoch when co-evolution of galaxies and SMBHs should be most prominent and, as such, most easily recognizable.
This is quantitatively explored in Daddi et al. (2007b). First, by estimating the average SFR over the whole sample of galaxies at , for which one derives . The SMBH mass-growth rate can be estimated from the unabsorbed X-Ray luminosity and a canonical efficiency for the accreted mass-energy conversion. Over the whole sample (i.e., including all galaxies) the average unobscured X-ray luminosity is , hence , and therefore:
| (2) |
so tantalizingly bracketing the Magorrian ratio (). Indeed, are we seeing the Magorrian ratio being established in this sample of galaxies?
5. AGN Feedback
A necessary condition for AGN feedback is having an AGN. With of all galaxies hosting an AGN it looks that this condition is quite well satisfied at . Feedback arises because energy (momentum) is transfered from the AGN to the ISM of the host galaxy, heating it and eventually expelling it from the galaxy. This energy transfer may be mediated by relativistic jets, or by hard AGN radiation. We don’t know whether relativistic jets are buried inside these galaxies, but we have direct evidence from the X-rays that hard radiation is certainly at work. In fact, the second condition –energy transfer from the AGN to the ISM– is also satisfied: being Compton-thick, a major fraction of the X-ray luminosity of the AGNs in the Mid-IR excess galaxies is clearly dumped to the ISM. The unobscured, hard X-Ray luminosity (at keV in the rest-frame) of these Compton-thick AGNs is typically erg/s, a power which is being absorbed/deposited in the ISM. Formally, this power would be sufficient to eject all the gas from a galaxy in just a few million years. However, most of the energy deposited in the ISM must be degraded locally, perhaps even in the immediate vicinity of the AGN. Indeed, the mere Mid-IR excess testifies that the hard X-ray photons Compton-heat electrons in the ISM, which share their energy with gas and dust, and eventually dust radiates most of this energy away in the Mid- and Far-IR. From the point of view of feedback, this is a pure loss. Nonetheless, if even a relatively small fraction of the absorbed hard X-ray luminosity (say, a few percent) goes to increasingly Compton-heat the gas, then SF could be quickly switched off, gas expelled from the galaxy, and the galaxy itself turned into an early-type, passively evolving galaxy.
These, considerations prompt a second, tantalizing question: with these Compton-thick AGNs, are we seeing the AGN Feedback in action?
6. Downsizing
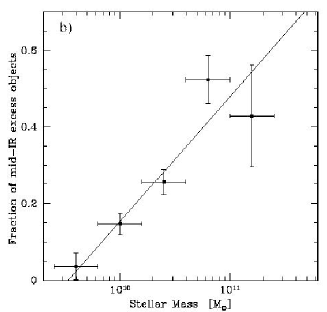
Fig. 4 (right panel) shows the fraction of Mid-IR excess galaxies (those with ) as a function of their stellar mass. This fraction increases with mass, reaching at . Thus, Compton-thick AGN activity, and the likely feedback) are even more widespread among the most massive star-forming galaxies. It is therefore likely that AGN feedback will more promptly succed in quenching star formation in the most massive galaxies, whereas it may take longer to activate a powerful Compton-thick AGN in progressively lower-mass galaxies, with star formation persisting in them for a longer time.
It is now observationally well established that the most massive galaxies are the first to turn passive, starting at , while less massive galaxies turn passive at lower and lower redshifts the lower their mass (e.g., Kodama et al. 2004; Thomas et al. 2005; Cimatti, Daddi & Renzini 2006), a manifestation of Galaxy Downsizing. Thus, we meet here the third tantalizing question promoted by this analysis of galaxies: Are we seeing “Galaxy Downsizing in progress?
7. Conclusions
The systematic study of Daddi et al. (2007a,b) of a complete sample of galaxies has revealed a widespread Compton-thick AGN activity among these galaxies, and has prompted three intriguing questions, namely:
Are we seeing the Magorrian ratio being established in galaxies?
Among these galaxies are we seeing the AGN Feedback in action?
Are we seeing “Galaxy Downsizing in prograss?
We cannot yet give a secure, positive answer to these questions, as much remains to be explored on the structure and internal workings of these galaxies. However, with cosmic SFR and AGN activity both peaking at , if not at this redshift (i.e., in the “boom years”) when/where would we better witness galaxy-SMBH co-evolution?
References
- (1) Bower, R.G., et al. 2006, MNRAS, 370, 645
- (2) Cimatti, A., Daddi, E. & Renzini, A. 2006, A&A, 453, L29
- (3) Daddi, E., et al. 2007a, ApJ, 670, 156
- (4) Daddi, E., et al. 2007b, ApJ, 600, 173
- (5) Chary, R. & Elbaz, D. 2001, ApJ, 556, 562
- (6) Ferrarese, L., et al. 2006, ApJ, 644, L21
- (7) Fiore, F., et al. 2008, ApJ, 672, 94
- (8) Gilli, R., Comastri, A. & Hasinger, G. 2007, A&A, 463, 79
- (9) Granato, G.L., et al. 2001, MNRAS, 324, 757.
- (10) Kodama T, et al. 2004, MNRAS, 350, 1005
- (11) Magorrian, J., et al. 1998, AJ, 115, 2285
- (12) Thomas, D., et al. 2005, ApJ, 621, 673