IR Contamination in Galactic X-Ray Novae
Abstract
The most widely used means of measuring the mass of black holes in Galactic binaries - specifically the X-ray novae - involves both radial velocity measurements of the secondary star, and photometric measurements of its ellipsoidal variability. The latter is important in constraining the inclination and mass ratio, and requires as direct a measure of the flux of the secondary as possible. Up to now, such measurements have been preferentially carried out in the NIR (1 – 2.5), where the flux from the cooler secondary is expected to dominate over that from the accretion disc. However, here we present evidence of a significant non-stellar contribution to the NIR flux in many of those quiescent X-ray novae that are thought to contain a black hole primary. We discuss origins of this excess and the effect of such contamination on Galactic black hole mass measurements.
keywords:
stars: individual (XTE J1118+480, GRO J0422+32, A0620-00, GS 2000+25, GS 1124-683, GS 2023+338, Cen X-4) – X-rays: binaries1 Introduction
X-ray novae (XRNe) are a subset of the low mass X-ray binaries (LMXBs), containing a compact object primary (M1) accreting material via Roche lobe overflow from a low mass (M 1 M☉) secondary star. The secondary is normally a K or M-type main sequence star, whereas the primary is either a neutron star or a black hole with a characteristic mass of 1.4 M☉ or 10 M☉ respectively. These systems undergo quasi-periodic outbursts (recurrence timescales tens of years) during which their broadband luminosities (X-ray - radio) increase by many orders of magnitude. They have proven to be a fertile hunting ground for the discovery of black holes, with 75% of the known stellar mass black holes residing in these XRNe. See the reviews by McClintock & Remillard (2006), Charles & Coe (2006) and Fender (2006) for further information about the X-ray, UV/optical/IR and radio properties of these systems respectively.
| Source | Spectral type | Porb | Distance | Extinction | Mx | R-band veiling |
|---|---|---|---|---|---|---|
| [ hrs] | [ Kpc ] | E(B-V) | [ M☉ ] | |||
| XTE J1118+480 a | K5V - M0V | 4.1 | 1.8 0.6 | 0.02 0.006 | 8.53 0.6 | 0.45 h |
| GRO J0422+32 b | M0V - M2V | 5.1 | 2.7 0.3 | 0.3 0.1 | 10 | 0.39 i |
| A0620-00 c | K3V - K7V | 7.8 | 1.2 0.4 | 0.39 0.02 | 9.7 0.6 | 0.10 j,k |
| GS 2000+25 d | K3V - K6V | 8.3 | 2.7 0.7 | 1.5 0.1 | 5.5 - 8.8 | 0.32 |
| GS 1124-683 e | K3V - K5V | 10.4 | 5.5 1.0 | 0.30 0.05 | 6.95 0.6 | 0.15 l |
| Cen X-4 f | K3V - K7V | 15.1 | 0.9 - 1.7 | 0.1 0.05 | 1.5 1.0 | 0.25 m |
| GS 2023+338 g | K0IV | 156 | 4 | 1.0 0.1 | 12 | 0.16 n |
REFERENCES: a Gelino et al. 2006; b Reynolds et al. 2007; c Froning et al. 2007; d Ioannou et al. 2004; e Gelino et al. 2001a; f D’Avanzo et al. 2005; g Shahbaz et al. 1994; h Torres et al. 2004; i Harlaftis et al. 1999; j Shahbaz et al. 2004; k Marsh et al. 1994; l Casares et al. 1997; m Torres et al. 2002; n Casares et al. 1993.
Conclusive identification of the primary as a black hole (M 3 M☉, Kalogera & Baym 1996) requires further observations once the system has returned to quiescence. The following 3 quantities are required to measure the mass of the primary: (i) radial velocity of the secondary star, K2 (ii) mass ratio, q , and (iii) orbital inclination, i (Casares, 2005). The first two measurements can be made via optical spectroscopy in quiescence. Measurement of the third quantity is more complicated: in most cases one must model the ellipsoidal modulation of the gravitationally distorted secondary star. Crucially, this modelling requires that one must account for any non-stellar flux present in the lightcurve.
Observations of XRNe have predominately been carried out in the optical. In this wavelength range (3000Å 9000Å), the accretion disc is known to contribute significantly to the observed flux. In quiescence, prominent emission lines from the disc are observed (i.e. etc.) superposed on the spectrum of the secondary star. Doppler imaging of XRNe in quiescence shows that the accretion disc is still present in this state (e.g. Marsh et al. 1994), and reveals the presence of the characteristic hotpot where the accretion stream impacts the disc. Optical photometry also reveals the lightcurve of quiescent XRNe to contain significant variability e.g. Hynes et al. (2003); Zurita et al. (2003); Nielsen (2007). Hence, these observations show that mass transfer from the secondary star is continuously taking place. The contribution from the hot accretion disc is typically observed to decrease from the U-band ( 3650 Å) to the R-band ( 6500 Å). As such it has been assumed that the accretion disc should contribute even less at near infrared wavelengths (NIR : 1 – 2.5). Initial NIR spectroscopy of GS 2023+338 and A0620-00 appeared to confirm this (Shahbaz et al. 1996, 1999, although see Froning & Robinson 2001). This appeared to justify the use of NIR observations, rather than optical, in determining the ellipsoidal variability (and constraining q & i).
However, recently it has become apparent that this might not always be the case. Reynolds et al. (2007) analysed quiescent K-band photometry of GRO J0422+32. They found the NIR light curve to be dominated by a flickering component, attributed to emission from the accretion disc, and not an ellipsoidal modulation as one would expect if the secondary star was the dominant source of the observed NIR flux. Using this data, the mass of the black hole in this binary was estimated to be 10.4 M☉.
Previously, Gelino et al. (2003) had measured the mass of the black hole in this system to be 3.97 0.95 M☉; crucially they assumed the contribution of the accretion disc to be negligible. A similar result was found in an investigation of the NIR flux in the proto-typical XRN A0620-00 by Froning et al. (2007). Using moderate S/N spectra, they measure the contribution of the secondary star to the observed flux to be in the H-band ( 1.65). From this they constrain the mass of the black hole to be Mx = 9.7 0.6 M☉. In contrast Gelino et al. (2001b) measured the black hole to have a mass of 11 1.9 M☉, and in this case the secondary was again assumed to contribute essentially 100% of the NIR flux. A number of other black hole mass estimates have been made in the NIR (see Table 1) and it is possible that the mass estimates for these systems may also be subject to additional uncertainty.
The presence of such a contribution from a cool accretion disc component is expected theoretically; however, observational evidence is difficult obtain (Hynes et al., 2005). In addition, at longer wavelengths (i.e. MIR: 3 – 24), Spitzer observations of a number of XRNe indicate the presence of a circumbinary disc which will contribute significantly at these wavelengths (Muno et al., 2006).
These results have lead us to re-examine the issue of the non-stellar contribution to the NIR flux of quiescent XRNe and in particular to re-evaluate the degree to which NIR studies improve our chances of constraining q, i, and hence the black hole mass, in comparison to optical studies. These results are presented herein as follows: we introduce our sample systems and the relevant data in §2, and show the relevant spectral energy distributions (SEDs) in §3. It is immediately apparent that there is a significant non-stellar contribution to the observed flux in the NIR. Modelling the multi-wavelength SEDs shows that this excess is consistent with blackbody emission from a combination of the accretion disc and a circumbinary disc. A discussion of our results follows in §4.
2 Data
Our sample consists of XRNe with quiescent data spanning the optical to at least the NIR wavelength range. In addition, we choose only those systems that contain main sequence companions (class V), with the exception of GS 2023+338. This XRN has a much longer orbital period and a sub-giant companion star (class IV). However, as this is the only other quiescent XRN with coverage at Spitzer wavelengths, it has been included for completeness. The XRNe that make up our sample include 6 suspected to contain a black hole primary and a single neutron star system. In Table 1, we list the primary system parameters for each binary. Our data consists of archival published optical and NIR photometry as well as a number of mid-IR (MIR: 3 – 24) data points from the Spitzer observatory (Muno et al., 2006). In particular Spitzer photometry exists for 4 of the systems, namely: A0620-00, XTE J1118+480, GS 2023+338 & Cen X-4. We have also recently obtained a medium resolution K-band spectrum of the black hole system GS 2000+25, which we discuss below. In Table 2, we list the dereddened flux from each system in the wavelength regions of interest.
2.1 GS 2000+25 Spectroscopy
K-band spectra of GS 2000+25 were obtained with the Near-IR imager (NIRI, Hodapp et al. 2003) using the f/6 camera at the Gemini-North telescope. Medium-resolution spectra of GS 2000+25 were obtained on the nights of 2006 August 23, 25 and September 1 UT as part of the Gemini service program (Prog. id: GN-2006B-Q-85, PI: Robinson). The K grism (1.9 – 2.49) was used in conjunction with a 0.23 slit, giving a resolution R 1100. Individual exposure times were 300s, dithered to 5 positions along the slit. In total 37 spectra of the system were acquired yielding a total exposure time of 3hrs. At the time of our observations photometry revealed the K-band magnitude of GS 2000+25 to be 16.6 0.15, where the error is dominated by the error in the 2MASS111The Two Micron All Sky Survey is a joint project of the University of Massachusetts and the Infrared Processing and Analysis Center, California Institute of Technology, funded by NASA and the National Science Foundation. stars relative to which our image is calibrated. This is consistent with previous measurements of the system, showing it to be in quiescence at the time of our observations.
The spectra were observed in 3 separate groups of 23, 8 and 6 science frames taken on each of the three nights outlined above. The airmass was typically in the range 0.95 – 1.15 during the observations as such slitlosses due to atmospheric differential refraction were negligible. The one-dimensional spectra were extracted within iraf222iraf is distributed by the National Optical Astronomy Observatories, which are operated by the Association of Universities for Research in Astronomy Inc., under cooperative agreement with the National Science Foundation. using both the noao.onedspec and the gemini.niri packages. Both sets of extracted spectra were found to be consistent. Unfortunately, due to the nature of the service observations a significant fraction of the spectra were taken in poor to deteriorating conditions resulting in a large number of unusable exposures. Hence the final signal to noise ratio (S/N) of our science spectrum was lower than anticipated. Spectra of the A0V stars HD182761 and HD197291 were also taken before and after the science frames respectively to aid with the removal of the telluric features and flux calibration of our science spectrum.
Correction of the science frames for telluric absorption was carried out following the prescription of Vacca et al. (2003). The low S/N of the individual spectra complicated the removal of the telluric features, with a number of residuals remaining. The resulting spectra were corrected for the Doppler shift of the spectral lines induced by the orbital motion of the secondary star using the ephemeris of Ioannou et al. (2004) and median combined so as to negate the effect of cosmic-ray hits and other spurious effects, while at the same time maximising the available S/N. This spectrum was then dereddened using the extinction listed in Table 1. As the slit losses are large, only a relative flux calibration was possible. The resulting spectrum ( 2hrs exposure) is displayed in Fig. 1; emission lines of HeI and Br are observed.
| Source | B | V | R | I | J | H | K | 4.5 | 8 | 24 | Radio |
|---|---|---|---|---|---|---|---|---|---|---|---|
| 4400Å | 5500Å | 6400Å | 7900Å | 1.25 | 1.65 | 2.2 | 8.5GHz | ||||
| XTE J1118+480 1,2 | 2.54e-13 | 2.89e-13 | 2.94e-13 | – | 3.50e-13 | 2.78e-13 | 2.1e-13 | 3.07e-14 | 1.69e-14 | 2e-15 | – |
| GRO J0422+32 3 | – | 7.35e-14 | 1.18e-13 | 1.39e-13 | 2.32e-13 | 2.07e-13 | 1.07e-13 | – | – | – | – |
| A0620-00 4,5,6,7,2 | 1.23e-12 | 2.09e-12 | 2.30e-12 | 2.38e-12 | 3.25e-12 | 2.88e-12 | 1.58e-12 | 2.99e-13 | 9.34e-14 | 6.75e-15 | 4.33e-18 |
| GS 2000+25 8,9 | – | – | 8.34e-13 | 6.34e-13 | 7.70e-13 | 7.52e-13 | 3.53e-13 | – | – | – | – |
| GS 1124-683 10 | 8.98e-14 | 2.20e-13 | 2.22e-13 | 2.49e-13 | 2.90e-13 | 2.98e-13 | 1.43e-13 | – | – | – | – |
| Cen X-4 11,2 | 6.15e-13 | 9.09e-13 | 1.39e-12 | 1.59e-12 | 2.08e-12 | 1.84e-12 | 1.11e-12 | 1.33e-13 | 3.56e-14 | 3.8e-15 | – |
| GS 2023+338 12,13,2 | 6.88e-12 | 1.54e-11 | 2.34e-11 | – | 3.11e-11 | 2.57e-11 | 1.29e-11 | 2.01e-12 | 5.44e-13 | 1.91e-14 | 4e-17 |
REFERENCES: 1 Gelino et al. 2006; 2 Muno et al. 2006; 3 Gelino et al. 2003; 4 Gelino et al. 2001b; 5 Froning & Robinson 2001; 6 Haswell et al. 1993; 7 Gallo et al. 2006; 8 Callanan & Charles 1991; 9 Callanan et al. 1996 ; 10 Gelino et al. 2001a; 11 Shahbaz et al. 1993; 12 Casares et al. 1993; 13 Gallo et al. 2005.
3 Analysis

3.1 GS 2000+25 K-band Spectrum
The K-band spectrum in Fig. 1 is displayed at a resolution of 1100 (270 km s-1) and has a S/N ratio of 10 at 2.3. We observe emission features consistent with both HeI and Br with equivalent widths of 6Å & 12Å respectively. Also indicated are the positions of a number of the atomic absorption features expected from the secondary star.
We also attempted to place on upper limit on the presence of any CO bandheads in the GS 2000+25 spectrum. As the S/N degrades further at longer wavelengths, our efforts were confined to the CO (2–0) band head at 2.294. We used a model of this bandhead in the K5V star spectrum to place an upper limit on its presence in the observed GS 2000+25 spectrum. We can rule out the presence of this bandhead with an equivalent width of 20% of that expected from a K5V star (solar abundance) at the 99% confidence level.
The spectral slope is observed to be consistent with that expected from the K5V secondary star in this system for 2.3: for longer wavelengths, the slope appears to flatten. In an effort to constrain the amount of non-stellar flux present a number of spectra were simulated. Noise was added to a K5V spectrum consistent with the secondary in this system until a S/N ratio similar to the science spectrum was achieved. To this a constant contribution representing an accretion disc with a temperature profile of the form T r-1/2 was added (see §3.4). We find for a fractional disc contribution of 25%, the simulated spectral slope is no longer consistent with the observed spectrum, indicating a likely disc contribution of 25% in the 2.0 – 2.3 wavelength region and more at wavelengths greater than this.
3.2 Multiwavelength Spectral Energy Distributions
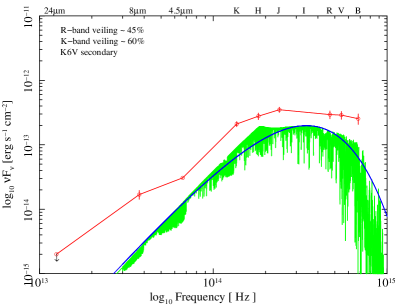
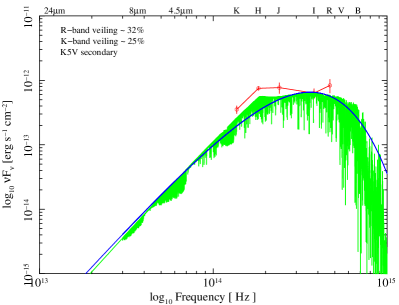
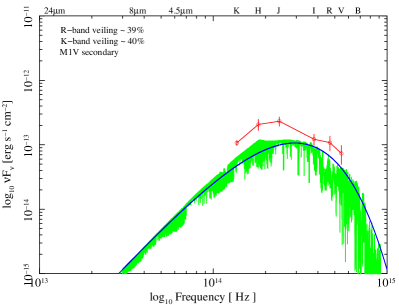
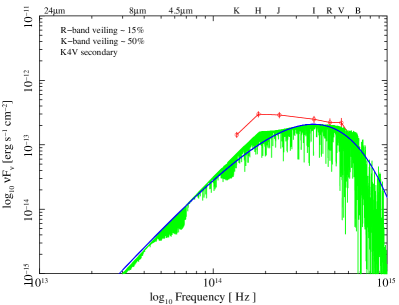
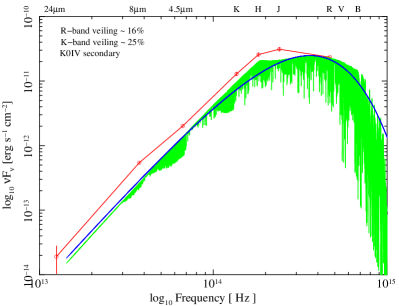
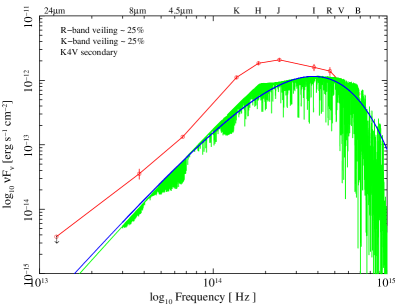
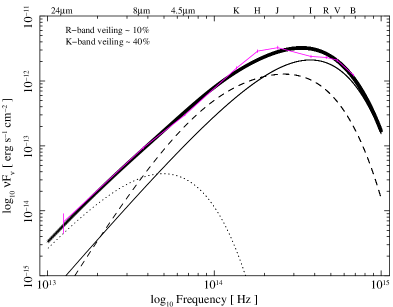
In Figures 2 & 3, we plot the extinction corrected optical/IR SEDs of the XRNe as listed in Table 2, where the error bars account for the uncertainty in the photometry and the reddening. Here, we fit model atmospheres of the appropriate spectral type to the SEDs of the quiescent XRNe: these data include optical, NIR and Spitzer measurements. In contrast to previous authors who normalised to the H-band (Gelino et al., 2006) or K-band flux (Muno et al., 2006; Gelino et al., 2003; Gelino et al., 2001a), where the IR contamination from the accretion disc was assumed to be minimal, we choose instead to normalise these models relative to the measured secondary contribution in the R-band, which has generally been more accurately determined using optical spectroscopy. The models we fit are NextGen model atmospheres (Hauschildt et al., 1999a; Hauschildt et al., 1999b) corresponding to the spectral type of the secondary star in each system. We restrict ourselves to those veiling measurements for which the simultaneously measured R-band flux is consistent with the value used in the SED. The veiling in all cases is defined as a percentage of the total system flux emitted by the accretion disc, typically measured in the region of the H line (6562Å):
and is indicated in the top left hand corner of each SED in Fig. 2 & 3 and in the final column of Table 1. As the various photometric data points used were non-simultaneous, we do not attempt to rigorously quantify the excess in the NIR. The quiescent magnitudes of XRNe are typically observed to vary by 0.1 magnitudes (e.g. Zurita et al. 2003), in addition to the 0.2 magnitude periodic variability due to the intrinsic ellipsoidal modulation of the secondary star. However, when normalised this way, the SEDs of these XRNe are all seen to exhibit an excess of flux at NIR wavelengths comparable to that measured in the optical (also indicated in Figures 2 & 3). In this sense the NIR appears to be just as contaminated as the optical, in the context of measuring the flux from the secondary.
3.3 A Simple Model
The current paradigm for understanding the emission from quiescent XRNe involves a thin disc which transitions to a quasi spherical inner flow at a distance of 103 – 104 Schwarzschild radii from the compact object. The inner flow is thought to consist of an advection dominated accretion flow (see Narayan 2008 and references therein), although it has also been argued that the inner region instead consists of a jet/outflow (Fender et al. 2003; Yuan & Cui 2005). In an effort to place a constraint on the source of the observed excess NIR flux, we have attempted to model the observed SED. The spectral energy distributions are fit with a multi-component model consisting of:
-
1.
A spherical blackbody representing the emission from the secondary star.
-
2.
An accretion disc.
The flux from the accretion disc may be modelled in the form of a multi-colour blackbody where the temperature profile across the surface of the optically thick geometrically thin accretion disc is (Mitsuda et al., 1984):(1) This results in T in the case of a viscously heated steady state disc.
Alternatively, we might expect a flatter temperature profile: for example, T has been observed in the quiescent accretion disc in some cataclysmic variables (CVs, Wood et al. 1989, 1992; Menou 2002). Such a temperature profile is intermediate between the classic steady state viscously heated accretion disc (r-0.75) and the irradiated disc case (r-0.43).
-
3.
A circumbinary disc.
If we assume the circumbinary disc to be opaque, flat and passively illuminated by the central star (Chiang & Goldreich, 1997), we expect the following temperature profile:(2) where R∗ & T∗ are the radius and temperature of the irradiating star respectively.
3.4 Results
Given the non-simultaneous nature of the observations we do not try to rigorously fit the data (e.g. via minimisation). None the less, in each case it is clear that a model consisting of an accretion disc extending from 103 – 105 Schwarzschild radii (RS) to an outer radius of 0.5 the Roche lobe radius of the compact object (RL1), in addition to the secondary star, is required to provide the observed NIR flux. This is consistent with previous observations of the accretion disc in quiescence (McClintock et al., 2003, 1995; Narayan, 2002; Marsh et al., 1994). At Spitzer wavelengths, the flux appears to be a combination of emission from the accretion disc/circumbinary disc. The SEDs of all the XRNe are seen to follow this general pattern. We emphasise that although the following analysis is qualitatively similar to that carried out by Muno et al. (2006), it differs in the important aspect that we normalise to the R-band flux, which results in a significant non-stellar component to the observed NIR flux (see §3.2). We discuss the fits to each system in more detail below.
3.4.1 A0620-00
In Figure 4, we display the resulting fit in the case of A0620-00. A steady state disc fit is displayed on the left; a disc with a flatter temperature profile (T ) is displayed on the right. We see that the disc with the flatter temperature profile provides a better fit to the observed SED. The basic model consists of a blackbody at the temperature of the model atmosphere displayed in Figure 2, a ’flat’ accretion disc extending from 104 RS to 0.5 RL1 and a circumbinary disc consistent with the previous estimates of Muno et al. (2006). Such an accretion disc will contribute 40% of the K-band flux. In comparison, Froning et al. (2007) recently determined the accretion disc to be contributing 23% of the K-band flux through moderate S/N spectroscopy. Given the uncertainties discussed elsewhere (§3.2, §4), we regard these values to be consistent with each other.
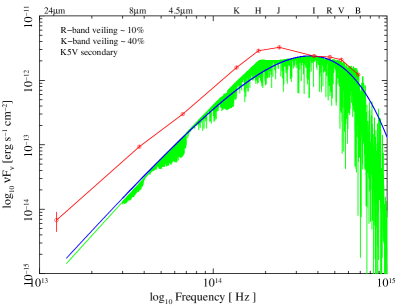
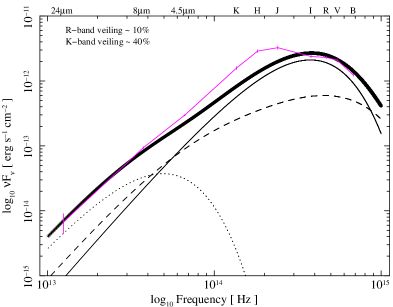
3.4.2 XTE J1118+480
Here we find a similar model to that described above, in particular a flat temperature profile accretion disc is required. The slope of the SED is consistent with emission from the secondary plus the accretion disc out to 4.5, however the 4.5 - 8 slope clearly indicates the presence of an additional source of flux.
In contrast to Muno et al. (2006), we find a standard circumbinary disc is unable to account for the observed excess. This is because we account for the accretion disc veiling, which results in a lower contribution from the secondary star at Spitzer wavelengths in this work, requiring a greater flux contribution from the circumbinary disc. Instead, we find a circumbinary disc with a flatter temperature profile similar to the accretion disc is required. In this case the accretion disc will contribute 60 of the flux at NIR wavelengths.
3.4.3 GS 2023+338
As is immediately obvious from the SED in Fig. 3, the flux from this system is dominated by the emission from the type IV secondary star. We find the accretion disc to contribute in the region of 25% of the flux in the JHK region of the spectrum. The excess at 24 microns is also consistent with an origin in the accretion disc. However, we are unable to rule out a contribution from a circumbinary disc as suggested by Muno et al. (2006).
3.4.4 Cen X-4
Cen X-4 is the only system in our sample where the compact object is a neutron star. However, as in the other systems the secondary star is unable to account for the NIR/optical flux, with there being a large excess over that from the secondary at NIR and Spitzer wavelengths. The magnitude of the contribution from the accretion disc is consistent with that observed in the black hole systems mentioned above. The disc is required to extend from an inner radius of 0.3 R☉ to an outer radius of 0.5 RL1. We also note that the 8 flux in conjunction with the 24 upper limit allows for the possible presence of a circumbinary disc, which contributes up to 20 of the 8 flux, in contrast to the analysis of Muno et al. (2006). Such a circumbinary disc will not contribute to the observed K-band emission.
3.4.5 Systems Without Spitzer Measurements
GRO J0422+32: Previous observations of GRO J0422+32 highlighted
the likely presence of a large non-stellar NIR component in this system
(Reynolds et al., 2007). Modelling of the SED supports this claim, with the
accretion disc component providing 40% of the observed NIR
flux.
GS 2000+25: Again, here we find the accretion disc contribution
to be large, 30% in the K-band.
GS 1124-683: The flux from the accretion disc is seen to be
40-50% of the total flux at NIR wavelengths.
4 Discussion
As has been demonstrated in the previous section, it is clear that the NIR flux observed from quiescent X-ray novae contains a significant component that does not originate in the secondary star. From an analysis of the spectral energy distributions of these XRNe, it now appears that this NIR excess is dominated by thermal emission from the cooler outer regions of the accretion disc. This excess requires the presence of a cool accretion disc with a temperature profile T r-0.5; such a cool disc component (T 3000 - 4000 K) is expected on theoretical grounds (e.g. Hynes et al. 2005). This temperature profile is intermediate between the classic steady state viscously heated accretion disc (r-0.75) and the irradiated disc case (r-0.43). The use of a temperature profile of this form is supported by the observation of similarly shallow temperature profiles from eclipse mapping of the accretion discs in quiescent dwarf novae (see Menou 2002 and references therein).
Given the difficulty in accurately determining the spectral type of the secondary star in XRNe, we also investigated the effect of varying the spectral type (within the range listed in Table 1) on the magnitude of the NIR excess. In particular, a later spectral type could account for a significant portion of the observed NIR excess (Fig. 2 & 3). Using the latest secondary star spectral types allowed, as previously determined (see Table 1), the analysis in §3.4 was repeated. The observed NIR flux is found to remain systematically greater than the relevant model atmosphere for all the systems in our sample, although the magnitude of the excess is found to decrease as expected. In the 7 systems in our sample, the observed K-band excess will remain high ranging from 10% in A0620-00 (K7V secondary) to 40% in XTE J1118+480 (M0V secondary). The veiling in each system is typically known to within 5%, which can lead to an error in the disc flux ranging from 50% (A0620-00: 10 5) to as little as 12% (Cen X-4: 25 3). We adopt this as an appropriate estimate for the accuracy of our K-band veiling measurements. Regardless of the magnitude of the excess, it is the systematic presence of this excess in all of the surveyed systems that is the most convincing evidence for its existence.
In the following sections, we discuss additional spectroscopic evidence for accretion disc contamination of the NIR flux in XRNe, which support the SED analysis given in §3.4 and above. In addition, we consider possible jet emission in the NIR, briefly discuss the MIR flux and compare the systems containing black hole primaries to the neutron star system. We end by considering the implications of neglecting to properly account for this additional flux when determining black hole masses.
4.1 Previous K-band Spectroscopy
NIR spectroscopy of quiescent black hole XRNe has also provided evidence for a non-negligible contribution from the accretion disc. Recent moderate resolution observations of A0620-00 by Froning et al. (2007), support the presence of a near-infrared excess in this system. Here the spectral slope was observed to deviate significantly from that expected of the secondary star alone. Detailed analysis showed the secondary star to contribute 82 2% of the H-band flux and 77% of the K-band flux. Reynolds et al. (2007) analysed low resolution spectra of the XRN GRO J0422+32 that displayed significant Br emission; in combination with photometric observations they showed the accretion disc to be contributing up to 30% or more of the observed K-band flux.
4.2 The GS 2000+25 Spectrum
In this work, we have obtained a medium resolution K-band spectrum of GS 2000+25. Emission lines consistent with the accretion disc are detected (HeI, Br), whereas the intrinsic absorption lines of the secondary star appear to be absent (although the S/N is low, see Fig. 1). Modelling of the CO (2–0) bandhead at 2.294 allows us to place a limit on the equivalent width of this feature in our spectrum. We can exclude the presence of this bandhead with an equivalent width of 20% of that expected from a K5V star, at the 99% confidence level. On the other hand, analysis of the spectral slope of our spectrum allows us to conservatively constrain the accretion disc to be contributing 25% of the flux for 2.3, and more at wavelengths greater than this, although a more accurate determination is limited by our low S/N ratio. We regard this as consistent with the value estimated in §3.2 & Fig. 2.
These results indicate that the CO abundance in the secondary star in GS 2000+25 is anomalous. If the CO abundance were similar to solar, we would expect to detect the CO (2–0) bandhead at approximately 75% of the equivalent width found in the K5V spectrum, with the remainder of the line being filled in by the accretion disc continuum, which we have shown contributes 25% of the observed flux. Instead, we limit the maximum CO (2–0) bandhead strength to be 20% of that expected from a K5V star at solar abundance.
In recent observations of A0620-00 at similar resolution (albeit higher S/N) both Froning et al. (2007) and Harrison et al. (2007) detect the CO bandheads from the secondary star in absorption. The CO lines detected in A0620-00 are observed to be anomalously weak, hinting at possible CNO processing in the secondary star (Froning et al., 2007). Observations of the XRNe XTE J1118+480 in outburst reveal a similar situation, with UV spectra displaying evidence for anomalous abundances of C, N & O. This points to CNO processing having also taken place in this system (Haswell et al., 2002). As explained above, if the C abundance in the secondary star in GS 2000+25 was anomalous as is the case in A0620-00 ([C/H] = -1.5), this would provide an explanation for their non-detection.
We also note the K-band spectroscopy of WZ Sge (Howell et al., 2004) in which H2 and CO-bandhead emission was detected. These lines are thought to be produced in dense cool regions as one might expect in the outer regions of the accretion disc in XRNe (Hynes et al., 2005). Hence, it is possible that our non-detection of the secondary star CO-bandheads in absorption is due to a combination of an anomalous carbon abundance and infilling of the CO-bandheads by similar emission lines emanating from the outer regions of the accretion disc. Unfortunately definitive conclusions require higher S/N observations as demonstrated in case of A0620-00 by Froning et al. (2007).
4.3 Non-Thermal Jet Emission
In an effort to constrain any possible jet contribution to the observed SEDs, a jet component of the form 222where the flux is measured in units of milli-Janskys: 1mJy 10-26 erg s-1 cm-2 Hz-1 was added to the model in 3.4. The jet is assumed to be flat and optically thick (), extending from radio wavelengths and breaking to the optically thin regime () in the optical/IR wavelength range (i.e. Fender 2006).
There does not appear to be evidence for a significant non-thermal contribution at NIR wavelengths in any of the systems in our sample. In A0620-00 and GS2023+338, the jet is seen to contribute at most a few percent of the observed flux. Even given the uncertainty in the Spitzer detections at 24 (Muno et al., 2006; Gallo et al., 2007), a jet will contribute 5% and 10% of the K-band flux in A0620-00 and GS 2023+338 respectively. It appears that jet emission in quiescence only becomes an appreciable percentage of the emitted flux as we proceed to the mid-IR region of the spectrum as noted by Muno et al. (2006).
4.4 MIR emission
As we proceed to longer wavelengths, the observed flux will become dominated by emission from the accretion disc/circumbinary disc with a possible contribution also from a jet, in agreement with the analysis of Muno et al. (2006). In the case of the sources with mid-IR spectral coverage (A0620-00, XTE J1118+480, GS 2023+338, Cen X-4), the Spitzer data favours the presence of a circumbinary disc contribution to the observed flux. Specifically, whereas a circumbinary disc is capable of accounting for all the mid-IR flux, a flat jet alone cannot.
4.5 Black Hole vs Neutron Star XRNe
Observations of quiescent XRNe with the Chandra X-ray observatory have discovered that the X-ray luminosity of systems containing black hole primaries appear to be systematically fainter than those containing neutron stars (see Kong et al. 2002; Lasota 2007 and references therein). This is thought to be due to the fact that the accreting matter strikes the hard surface in the case of the neutron star whereas if the primary is a black hole, the matter is simply advected across the event horizon (although an alternate interpretation envisions the matter being expelled in a jet/outflow, Fender et al. 2003). Hence, it is worth asking if there is any appreciable difference in the SEDs of the sources in our sample.
Even though we only model a single system containing a neutron star primary, there does not appear to be any discernable difference between the spectral energy distribution of Cen X-4 and the 6 systems containing a black hole primary. This is what one would expect if the emission in the optical/NIR region is dominated by the secondary star and the cooler outer regions of the accretion disc instead of radiation from processes taking place closer to the compact object.
4.6 Black Hole Mass Estimates
In light of the fact that the NIR flux from XRNe appears to contain a significant non-stellar contribution, it is worth reconsidering previous black hole mass estimates made via IR observations, which neglected to include this non-stellar flux in the analysis. We can estimate the effect of this additional component using the Eclipsing Light Curve code (ELC, Orosz et al. 2000) in combination with the previously determined system parameters. We then add a contribution from an accretion disc with a temperature profile of the form T(r) r-0.5 and the inner and outer disc radii set so as to agree with the values determined in §3.4. We estimate that for an accretion disc contribution of only 20%, the black hole masses measured via NIR photometry have generally been overestimated by 1 – 2 M☉ in each case; this increases to as much as 4 M☉ in the case of a 50% disc contribution.
5 Conclusions
We have shown that there is a significant amount of contamination present from the accretion disc/circumbinary disc in the IR portion of the SED of quiescent XRNe. Fits to the SEDs reveal NIR excesses in each of the 7 systems studied. We have also presented new K-band spectroscopy of GS 2000+25, which also shows some evidence for contamination: this joins two other black hole XRNe with confirmed IR excesses from spectroscopy (A0620-00 – Froning et al. 2007 and GRO J0422+32 – Reynolds et al. 2007).
Based on these results, we believe that the currently accepted paradigm, in which the ellipsoidal variations at NIR wavelengths are assumed to be undiluted by other sources of flux in the binary, is not valid. We conclude that the NIR offers no significant advantage over optical observations in the measurement of ellipsoidal variability (and the determination of mass ratio and orbital inclination). Indeed, assuming the contrary introduces large, systematic errors in the mass estimates for the compact objects in these binary systems.
Acknowledgements
Some of the data presented in this paper was obtained at the Gemini
Observatory, which is operated by the Association of Universities for
Research in Astronomy, Inc., under a cooperative agreement with the
NSF on behalf of the Gemini partnership: the National Science
Foundation (United States), the Science and Technology Facilities
Council (United Kingdom), the National Research Council (Canada),
CONICYT (Chile), the Australian Research Council (Australia), CNPq
(Brazil) and CONICET (Argentina).
This research made extensive use of the SIMBAD database, operated at CDS, Strasbourg, France and NASA’s Astrophysics Data System. We thank Jerome Orosz for kindly providing us with the ELC code. M.T.R. & P.J.C. acknowledge financial support from Science Foundation Ireland.
References
- Callanan & Charles (1991) Callanan P.J., Charles P., 1991, MNRAS, 249, 573
- Callanan et al. (1996) Callanan P.J., Garcia M.R., Filippenko A.V., McLean I., Teplitz H., 1996, ApJ, 470, 57
- Casares et al. (1993) Casares J., Charles P.A., Naylor T., Ravlenko E.P., 1993, MNRAS, 265, 834
- Casares et al. (1997) Casares J., Martin E.L., Charles P.A., Molaro P., Rebolo R.J., 1997, NewA, 299, 310
- Casares (2005) Casares J., 2005, in Del Toro Iniesta J.C., Alfaro E.J., Gorgas J.G., Salvador-Sole E., Butcher H., eds, The Many Scales in the Universe: JENAM 2004 Astrophysics Reviews, Springer, Dordrecht (astro-ph/0503071)
- Charles & Coe (2006) Charles, P.A., Coe M.J., 2006, in Lewin W.H.G., van der Klis M., eds, Compact Stellar X-Ray Sources, Cambridge University Press, Cambridge (astro-ph/0308020)
- Chiang & Goldreich (1997) Chiang E.I., Goldreich P., 1997, ApJ, 490, 368
- D’Alessio et al. (1998) D’Alessio P., Canto J., Calvet N., Lizano S., 1998, ApJ, 500, 411
- D’Alessio et al. (1999) D’Alessio P., Calvet N., Hartmann L., Lizano S., Canto J., 1999, ApJ, 527, 893
- D’Avanzo et al. (2005) D’Avanzo P., Campana S., Casares J., Israel G.L., Covino S., Charles P.A., Stella L., 2005, A&A, 444, 905
- Fender et al. (2003) Fender R.P., Gallo E. & Jonker J.G., 2003, MNRAS, 343, 99
- Fender (2006) Fender R., 2006, in Lewin W.H.G., van der Klis M., eds, Compact Stellar X-Ray Sources, Cambridge University Press, Cambridge (astro-ph/03033339)
- Froning & Robinson (2001) Froning C.S., Robinson E.L., 2001, ApJ, 121, 2212
- Froning et al. (2007) Froning C.S., Robinson E.L., Bitner M.A., 2007, ApJ, 663, 1215
- Gallo et al. (2005) Gallo E., Fender R.P., Hynes R.I., 2005, MNRAS, 356, 1017
- Gallo et al. (2006) Gallo E., Fender R.P., Miller-Jones J.C.A., Merloni, A., Jonker P.G., Heinz S., Maccarone T.J., van der Klis M., 2006, MNRAS, 370, 1351
- Gallo et al. (2007) Gallo E., Migliari S., Markoff S., Tomsick J.A., Bailyn C.D., Berta S., Fender R.P., Miller-Jones J.C.A., 2007, arXiv:0707.0028 [astro-ph]
- Gelino et al. (2001a) Gelino D.M., Harrison T.E., McNamara B.J., 2001a, AJ, 122, 971
- Gelino et al. (2001b) Gelino D.M., Harrison T.E., Orosz J.A., 2001b, AJ, 122, 2668
- Gelino et al. (2003) Gelino D.M., Harrison T.E., 2003, ApJ, 599, 1254
- Gelino et al. (2006) Gelino D.M., Balman S., et al., 2006, ApJ, 642, 438
- Harlaftis et al. (1999) Harlaftis E.T., Collier S., Horne K., Filippenko A.V., 1999, A&A, 341, 491
- Harrison et al. (2007) Harrison T.E., Howell S.B., Szkody P., Cordova F.A., 2007, AJ, 133, 162
- Haswell et al. (1993) Haswell C.A.,Robinson E.L., Horne K., Stiening R.F., Abbott T.M.C., 1993, ApJ, 411, 802
- Haswell et al. (2002 ) Haswell C.A., Hynes R.I., King A.R., Schenker K., 2002, MNRAS, 332, 928
- Hauschildt et al. (1999a) Hauschildt, P.H., Allard F., Baron E., 1999, ApJ, 512, 377
- Hauschildt et al. (1999b) Hauschildt P.H., Allard F., Ferguson J., Baron E., Alexander D., 1999, ApJ, 525, 871
- Hodapp et al. (2003) Hodapp K.W., Jensen J.B., Irwin E.M., Yamada H., Chung R., Fletcher K., Robertson L., Hora J.L., Simons D.A., Mays W., Nolan R., Bec M., Merrill M., Fowler A.M., 2003, PASP, 115, 1388
- Howell et al. (2004) Howell S.B., Harrison T.E., Szkody P., 2004, ApJ, 602, 49
- Hynes et al. (2003) Hynes R.I., Charles P.A., Casares J., Haswell C.A., Zurita C., Shahbaz T., 2003, MNRAS, 340, 447
- Hynes et al. (2005) Hynes R.I., Robinson E.L., Bitner M., 2005, ApJ, 630, 405
- Ioannou et al. (2004) Ioannou Z., Robinson E.L., Welsh W.F., Haswell C.A., 2004, ApJ, 127, 481
- Kalogera & Baym (1996) Kalogera V., Baym G., 1996, ApJ, 470, 61
- Kong et al. (2002) Kong A.K., McClintock J.E., Garcia M.R., Murray S.S., Barret D., 2002, ApJ, 570, 277
- Lasota (2007) Lasota J.P., 2007, CRPhy, 8, 45
- Marsh et al. (1994) Marsh T.R., Robinson E.L., Wood J.H., 1994, MNRAS, 266, 137
- Menou (2002) Menou K., 2002, in Gaensicke B.T., Beuermann K., Reinsch K., eds, The Physics of Cataclysmic Variables and Related Objects, ASPC, 261, 387, San Francisco
- McClintock et al. (1995) McClintock J.E., Horne K., Remillard R.A., 1995, ApJ, 442, 358
- McClintock et al. (2003) McClintock J.E., Narayan R., Garcia M.R., Orosz J.A., Remillard R.A., Murray S.S., 2003, ApJ, 593, 435
- McClintock & Remillard (2006) McClintock J.E., Remillard R.A., 2006, in Lewin W.H.G., van der Klis M., eds, Compact Stellar X-Ray Sources, Cambridge University Press, Cambridge (astro-ph/0306213)
- Mitsuda et al. (1984) Mitsuda K., Inoue H., Koyama K., Makishma K., Matsuoka M., Ogawara Y., Shibazaki N., Suzuki K., Tanaka Y., 1984, PASJ, 36, 741
- Muno et al. (2006) Muno M.P., Mauerhan J., 2006, ApJ, 648, 135
- Narayan (2002) Narayan R., Garcia M., McClintock J., 2002, in Gurzadyan V., Jantzen R., Ruffini R., eds, Proc. IX Marcel Grossmann Meeting, Singapore: World Scientific
- Narayan (2008) Narayan R., McClintock J.E., 2008, in Abramowicz M.A., Straub O., eds, ”Jean-Pierre Lasota, X-ray binaries, accretion disks and compact stars” New Astronomy Reviews, arXiv:0803.0322 [astro-ph]
- Nielsen (2007) Neilsen J., Steeghs D., Vrtilek S.D., 2007, arXiv:0710.3202 [astro-ph]
- Orosz et al. (2000) Orosz J.A., Hauschildt P.H., 2000, A&A, 364, 265.
- Reynolds et al. (2007) Reynolds M.T., Callanan P.J., Filippenko A.V., 2007, MNRAS, 374, 657
- Shahbaz et al. (1993) Shahbaz T., Naylor T., Charles P.A., 1993, MNRAS, 265, 655
- Shahbaz et al. (1994) Shahbaz T., Ringwald F.A., Bunn J.C., Naylor T., Charles P.A., Casares J., 1994, MNRAS, 271, 10
- Shahbaz et al. (1996) Shahbaz T., Bandyopadhyay R., Charles P.A., Naylor T., 1996, MNRAS, 282, 977
- Shahbaz et al. (1999) Shahbaz T., Bandyopadhyay R., Charles P.A., 1999, A&A, 346, 82
- Shahbaz et al. (2004) Shahbaz T., Hynes R.I., Charles P.A., Zurita C., Casares J., Haswell C.A., Araujo-Betancor S., Powell C., 2004, MNRAS, 354, 31
- Torres et al. (2002) Torres M.A.P., Casares J., Martinez-Pais I.G., Charles P.A., 2002, MNRAS, 334, 233
- Torres et al. (2004) Torres M.A.P., Callanan P.J., Garcia M.R., Zhao P., Laycock S., Kong A.K.H., 2004, ApJ, 612, 1026
- Vacca et al. (2003) Vacca W.D., Cushing M.C., Rayner J.T., 2003, PASP, 115, 389
- Wood et al. (1989) Wood J.H., Horne K., Berriman G., Wade R.A., 1989, ApJ, 341, 974
- Wood et al. (1992) Wood J.H., Horne K., Vennes S., 1992, ApJ, 385, 294
- Yuan & Cui (2005) Yuan F., Cui W., 2005, ApJ, 629, 408
- Zurita et al. (2003) Zurita C., Casares J., Shahbaz T., 2003, ApJ, 582, 369
This paper was typeset using a LaTeX file prepared by the author