Charge dynamics of doped holes in high Tc cuprates - A clue from optical conductivity
Abstract
The charge dynamics in weakly hole doped high temperature superconductors is studied in terms of the accurate numerical solution to a model of a single hole interacting with a quantum lattice in an antiferromagnetic background, and accurate far-infrared ellipsometry measurements. The experimentally observed two electronic bands in the infrared spectrum can be identified in terms of the interplay between the electron correlation and electron-phonon interaction resolving the long standing mystery of the mid-infrared band.
pacs:
71.10.Fd, 02.70.Ss, 71.38.-k, 75.50.EeIt is now widely recognized that the physics of doping holes into a Mott insulator is the key concept to understand the high temperature superconductivity in cuprates LeeNagWen . An appealing scenario is that the spin singlet pairs already existing in the insulating antiferromagnet turn into the superconducting Cooper pairs when the doped holes introduce the charge degrees of freedom. On the other hand, it is also noted that the parent compound is an ionic insulator, where the polar electron-phonon interaction (EPI) plays an essential role, and it is expected that this strong EPI continues to be of quite vital importance even at finite doping. Therefore, the quantum dynamics of the doped holes is essentially influenced by both the magnetic fluctuations and quantum phonons.
It has been recognized that the charge dynamics is determined not by the large Fermi surface but by the doped holes in the underdoped region LeeNagWen . Therefore, it is a reasonable approach to consider the charge-current dynamics of the holes (not electrons) interacting with the quantum phonons and magnons simultaneously to analyze the infrared optical conductivity (OC). The basic features of the observed d.c. conductivity and OC follow Ref. BasTim ; Kastner ; ManoRev94 . The OC in undoped material reveals the charge transfer band at eV between the p-orbitals of oxygen and d-orbitals of copper. With doping, a low energy part of develops revealing the dynamics of the doped holes as a function of the frequency . In particular, the Drude weight is shown to be proportional to even in the absence of antiferromagnetic long range order, while the relaxation rate is proportional to the temperature . Therefore, this dependence of the Drude weight finds a natural explanation as directly reflecting the hole concentration, as mentioned above, while the -dependence is due to the lifetime of the holes. The higher frequency , on the other hand, has not been well-understood. Especially the mid-infrared (MIR) peak with dependent on doping energy at around eV is still controversial LeeBas2005 , with interpretations involving an -dependence of , transitions between the Zhang-Rice singlet state to the upper Hubbard band, and magnon sidebands.
For this problem, angle-resolved-photoemission spectroscopy (ARPES) offers an important clue. ARPES in undoped parent compounds measures the spectral function of a single hole left behind when an electron is kicked out from the sample by the incident light Shen_03 ; Kyle_Dop . The corresponding theoretical analysis has pointed out the role of the composite polaronic effect due to electron-magnon and electron-phonon (el-ph) couplings tJpho ; Rosch . Therefore, it is expected that these two interactions are indispensable to understand the infrared optical spectra as well.

We study in this paper theoretically the OC of the single-hole doped into a Mott insulator described by the t-J-Holstein model, and its numerical solution in terms of the Diagrammatic Monte Carlo (DMC) simulation. Previously, the OC of the t-J-Holstein model has been calculated by exact diagonalization of small clusters Fehske98 , in the non-crossing approximation NCA for both magnetic and lattice variables KyungMukhin96 , and for the case of infinite dimension Cappelluti . Compared with these approximate methods, our DMC simulation provides more accurate solution for the infinite system without approximation associated with the phonon sector MPSS and for proper lattice geometry and dimension. The only approximation is the NCA for magnons which is shown to be sufficiently good for the parameters considered below Liu_92 ; RoGu_SCBA . These results are compared with accurate far-infrared ellipsometry measurement as well as with previously published data. The infrared ellipsometry measurements have been performed with a home-built ellipsometer attached to a Bruker Fast-Fourier spectrometer at the IR beamline of the ANKA synchrotron at FZ Karlsruhe, D at 70-700 cm-1 and with conventional light sources at 500-7000 cm-1 Bern1 .
Figure 1 summarizes our main results, where four panels for the infrared parts of are compared. Figures 1(a), (b) and (c) show the calculated for the Holstein model (el-ph coupling only), t-J model (el-magnon only), and the t-J-Holstein model (el-ph and el-magnon couplings), respectively, while Fig. 1(d) presents the experimental observation. Neither the t-J model 1(b), nor the Holstein model 1(a) bear resemblance to the experiment 1(d), while their combination 1(c) at least qualitatively reproduces the salient experimental features. The clear signature of the experiment is that there are two prominent electronic components, i.e., the so-called MIR band at around cm-1 and the lower energy one at around cm-1 that is located just above the infrared active phonon modes which show up as sharp peaks below cm-1. The lower energy peak roughly corresponds to that seen in Fig. 1(c) due to the phonon side-band. However, the MIR peak does not correspond to that of t-J model which occurs at around cm-1. Instead of that, according with experiment, it is shifted to higher energies.
As it can be seen from the results below, the coupling to two kinds of bosonic excitations results in two separate peaks because of the essentially different nature of the electron-magnon and el-ph couplings T-depend and significantly different energy scales of the magnetic and lattice excitations which are involved in the optical transitions. The magnons with large characteristic energy are weakly bound to the hole. To the contrary, the phonons are adiabatic and the EPI is considerable. As shown below, the lower energy peak is the phonon sideband with the threshold at the phonon energy Optics and the higher energy peak is the magnon sideband of the lower peak. The reason for the apparent shift of the peak to higher energies is most evident in the strong-coupling limit where the Franck-Condon picture for optical processes is valid Optics and the fluctuations of energies of different lattice sites, with the characteristic scale of Franck-Condon energy, can be considered as being frozen. Then, the energy cost of the transition of the hole from the ground state to excited states of the t-J model with frozen lattice is the sum of the energy of the emitted magnon and the Franck-Condon energy. Hence, the two peaks in the OC are the consequence of the importance of both el-ph and magnetic interactions. The same information is encoded in a different way in the single-particle spectral function observed in ARPES, where the low energy quasiparticle peak of t-J model is affected by el-ph interaction. This low energy peak is separated into the broad Franck-Condon peak mimicking the dispersion of the t-J model while the zero-phonon line with very small weight has almost no dispersion tJpho ; Kyle_Dop .
In the standard spin-wave approximation for the t-J model kane ; Liu_92 , the dispersionless hole (annihilation operator is ) propagates in the magnon (annihilation operator is ) bath
| (1) |
with magnon dispersion , where . The hole is scattered by magnons
| (2) |
with the standard scattering vertex ManoRev94 .
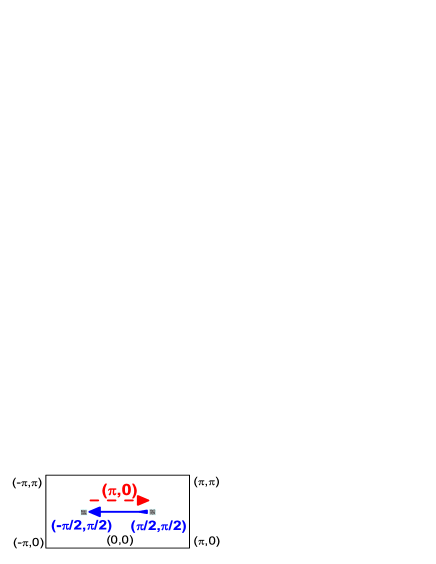
The OC of the t-J model has been calculated by various methods in numerous papers giving mutually consistent results, e.g. RiceZhang89 ; Eder96 . To confirm the validity of our method, we first reproduce the results for different J/t ratios Optics_why . We find the well known peak at around , the origin of which has not been settled yet. It is also difficult to identify this peak with the observed MIR peak since the energy of the latter is about 2 times higher than . Another source for skepticism is the opposite doping dependence of the and energies Eder96 . Therefore, we conclude that the t-J model can not explain the observed OC even at very small dopings. Before introducing the EPI, let us first provide an interpretation of the peak. This peak comes from the hole excitations within the coherent band of the t-J model from the ground state at to the neighborhood of point, assisted by emission of single magnon with energy and a momentum (Fig. 2). To prove this point we computed the OC by disentangling magnon and hole terms (exact at the lowest order in ) and then calculating the correlation function involving the hole operators in the subspace with one magnon (See upper panel in fig. 3)
| (3) |
Here is the lowest eigenstate in the subspace with one magnon with energy , and about_c . By direct inspection of the sum over in Eq. 3 we found that the main contribution to the OC comes from the transfer of magnon momentums around . It can be traced out from the -dependence of the vertex .
We now turn to the EPI added to the t-J model, the importance of which has been already established as mentioned above. When the model is updated to the t-J-Holstein model, the hole interacts with dispersionless (frequency ) optical phonons by short range coupling
| (4) |
In units of we parametrize the dimensionless EPI constant as , choosing the value , and setting the phonon frequency omega .
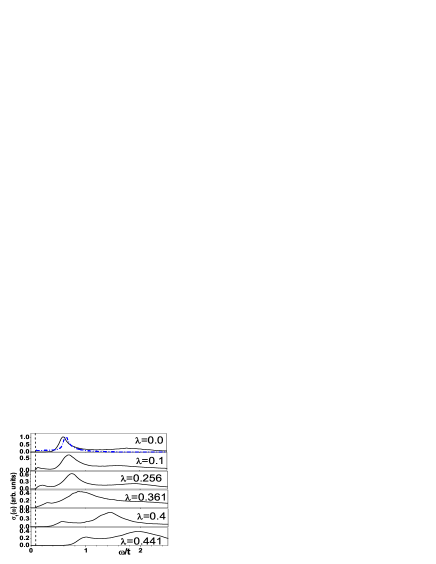
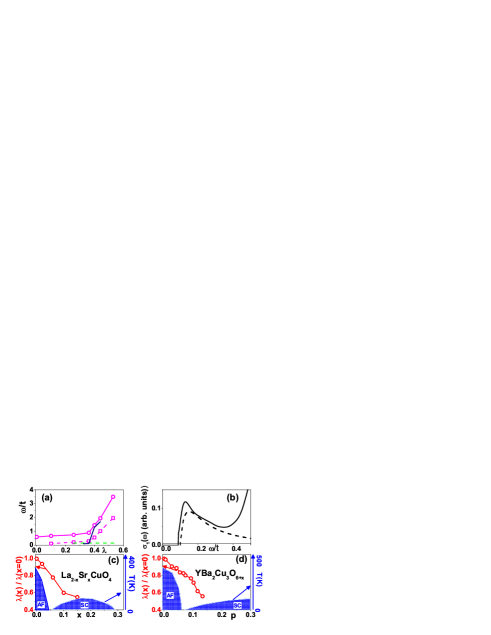
Figure 3 shows the effect of EPI on the OC of a single hole in t-J-Holstein model. At weak EPI, an absorption starts and shows a peak right above the phonon frequency. This apparent two-peak structure of the MIR response of underdoped cuprates can be tacitly discerned from many previous measurement (Fig. 3 in Thomas1992 and Fig. 9 in BasTim ) and is clearly seen from the low-temperature in-plane OC of 1.5% hole doped Eu1-xCaxBa2Cu3O6 measured by ellipsometry (Fig. 1(d)). This low energy EPI-mediated peak stays close to phonon energy up to the self-trapping transition point which is, for given parameters of the model, is located at tJpho . Indeed, according to the dependence of the dominant contribution and the low energy peak on (Fig. 4a), the transition from the weak- to the strong-coupling regime occurs at this coupling strength. We note that both the t-J model and polaron physics is crucial to explain the very existence of the two-peak structure of the OC.
To understand the nature of the low energy peak induced by EPI, we did a calculation of OC for the Holstein model without hole-magnon interaction with reduced transfer mimicking the mass enhancement, which reproduces the self-trapping point of t-J-Holstein model with As seen in Fig. 4b, this effective Holstein model reproduces remarkably well the shape of the low energy feature of OC for the t-J-Holstein model.
Since the effective EPI decreases with doping Lanzara01 ; MiCond the reason of the experimentally observed Uchida1991 ; LeeBas2005 ; Cooper1993 MIR mode softening is the change of the EPI. Comparing the position of the MIR mode with results of the t-J-Holstein model we can give a rough estimate of the renormalization of the effective EPI with doping. First, since the self-trapping point of the realistic extended tt′t′′-J model is MNIsotope , we scale the EPI strength in the Fig. 4a as . Second, since the quadratic dependence of the energy scales of the OC response on is a known property of the strong coupling regime Optics , we extrapolate the OC data to larger EPI couplings. Using a quadratic extrapolation of the experimental data of the MIR peak in YBCO LeeBas2005 ; Cooper1993 and LSCO Uchida1991 to zero dopings, we arrive at the result in Fig. 4c–d which is in agreement with Lanzara01 . Moreover, since the analysis of the ARPES in undoped LSCO gives Rosch , the data in Fig. 4c–d give absolute values of . Finally, our result for is in quantitative agreement with the values obtained from the “kink” angle in ARPES on LSCO MiCond . Figures 4c–d strongly suggest that superconductivity appears after the effective EPI decreases from strong to weak coupling, which liberates the coherent motion of the doped holes. The -axis for YBCO should be translated to the hole doping concentration in the CuO2-planes , which makes the two phase diagrams Fig. 4(c) and (d) look almost similar. Therefore, the behavior of the effective EPI and phase diagram seem almost universal in high-Tc cuprates. However, the discussion above is restricted to the polaronic effect for the holes and not for the quasiparticles forming the large Fermi surface. The contribution of the EPI to the pairing hence is not excluded by the present analysis.
Fruitful discussions with N. V. Prokof’ev, B. V. Svistunov and G. A. Sawatzky are acknowledged. A.S.M. is supported by RFBR 07-02-00067a. N.N. was partly supported by the Grant-in-Aids from under the Grant No. 15104006, 16076205, and 17105002, and NAREGI Nanoscience Project from the Ministry of Education, Culture, Sports, Science, and Technology, Japan. C.B. and K.W.K. acknowledge technical support of Y. L. Mathias at the ANKA IR-beamline and funding by the Schweizer Nationalfonds (SNF) through grant 200021-111690 and the Deutsche Forschungsgemeinschaft (DFG) through grant BE 2684/1 in FOR538.
References
- (1) P. A. Lee, N. Nagaosa, and X.-G. Wen, Rev. Mod. Phys. 78, 17 (2006)
- (2) D. N. Basov and T. Timusk, Rev. Mod. Phys. 77, 721 (2005).
- (3) M. A. Kastner et al, Rev. Mod. Phys. 70, 897 (1998).
- (4) E. Manousakis, Rev. Mod. Phys. 63, 1 (1991); E. Dagotto, ibid. 66, 763 (1994).
- (5) Y. S. Lee et al, Phys. Rev. B 72, 054529 (2005).
- (6) A. Damascelli, Z.-X. Shen, and Z. Hussain, Rev. Mod. Phys. 75, 473 (2003).
- (7) K. M. Shen, et.al., Phys. Rev. Lett. 93, 267002 (2004).
- (8) A. S. Mishchenko, N. Nagaosa, Phys. Rev. Lett. 93, 036402 (2004)
- (9) O. Rösch et al, Phys. Rev. Lett.95, 227002 (2005).
- (10) B. Baüml, G. Wellein and H. Fehske, Phys. Rev. B 58, 3663 (1998).
- (11) B. Kyung et al, Phys. Rev. B 54, 13167 (1996).
- (12) E. Cappelluti, S. Ciuchi and S. Fratini, Phys. Rev. B 76, 125111 (2007).
- (13) A. S. Mishchenko et al, Phys. Rev. B 62, 6317 (2000); A. S. Mishchenko and N. Nagaosa, J. Phys. Soc. J. 75, 011003 (2006).
- (14) Z. Liu and E. Manousakis, Phys. Rev. B 45, 2425 (1992).
- (15) O. Gunnarsson and O. Rösch: Phys. Rev. B 73, 174521 (2006)
- (16) C. Bernhard, J. Humlicek, and B. Keimer, Thin Solid Films 455-456, 143 (2004).
- (17) V. Cataudella et al, Phys. Rev. Lett. 99, 226402 (2007)
- (18) A. S. Mishchenko et al, Phys. Rev. Lett. 91, 236401 (2003); G. De Filippis et al, ibid. 96, 136405 (2006).
- (19) C. L. Kane, P. A. Lee, and N. Read, Phys. Rev. B 39, 6880 (1989).
- (20) T. M. Rice and F. C. Zhang, Phys. Rev. B 39, 815 (1989); W. Stephan and P. Horsch, ibid. 42, 8736 (1990); D. Poilblanc and E. Dagotto, ibid. 44, 466 (1991); D. Poilblanc, ibid. 44, 9562 (1991); E. Dagotto et al, ibid 45, 10741 (1992); J. I. Igarashi and P. Fulde, ibid. 48, 12713 (1993); J. Jaklič and P. Prelovšek, ibid. 50, 7129 (1994); G. Jackeli and N. M. Plakida, ibid 60, 5266 (1999); M. Moraghebi, S. Yunoki and A. Moreo, ibid. 66, 214522 (2002); B. Kyung and S. I. Mukhin, ibid 55, 3886 (1997); N. M. Plakida, Z. Phys. B 103, 383 (1997).
- (21) R. Eder, P. Wróbel and Y. Ohta, Phys. Rev. B 54, R11034 (1996).
- (22) Since the current operator is not diagonal in the momentum space, we need some further technical development for the calculation of the OC Optics : A.S. Mishchenko et al, in preparation.
- (23) The vortex is defined in KyungMukhin96 .
- (24) In high materials ManoRev94 , Shen_03 .
- (25) G. A. Thomas et al, Phys. Rev. B 45, 2474 (1992).
- (26) A. Lanzara et al, Nature 412, 510 (2001).
- (27) A. S. Mishchenko et al, unpublished.
- (28) S. L. Cooper et al, Phys. Rev. B 47, 8233 (1993).
- (29) S. Uchida et al, Phys. Rev. B 43, 7942 (1991)
- (30) A. S. Mishchenko and N. Nagaosa, Phys. Rev. B 73, 092502 (2006).
- (31) R. Liang, D. A. Bonn and W. N. Hardy, Phys. Rev B 73 180505(R) (2006).