Clustering environment of BL Lac object RGB 1745+398
Abstract
Aims. The BL Lac object RGB 1745+398 lies in an environment that makes it possible to study the cluster around it more deeply than the environments of other BL Lac objects. The cluster centered on the BL Lac works as a strong gravitational lens, forming a large arc around itself. The aim of this paper is to study the environment and characteristics of this object more accurately than the environments of other BL Lac objects have been before.
Methods. We measured the redshifts of galaxies in the cluster from the absorption lines in their spectra. The velocity dispersion was then obtained from the redshifts. The gravitational lensing was used for measuring the mass at the center of the cluster. The mass of the whole cluster could then be estimated using the softened isothermal sphere mass distribution. Finally, the richness of the cluster was determined by counting the number of galaxies near the BL Lac object and obtaining the galaxy-BL Lac spatial covariance function, .
Results. The redshifts of nine galaxies in the field were measured to be near the redshift of the BL Lac object, confirming the presence of a cluster. The average redshift of the cluster is 0.268, and the velocity dispersion km s-1. The mass of the cluster is which implies a rather massive cluster. The richness measurement also suggests that this is a rich cluster: the result for covariance function is Mpc1.77, which corresponds to Abell richness class 1 and which is consistent with the mass and velocity dispersion of the cluster.
Key Words.:
BL Lacertae objects: individual: RGB 1745+398 – Galaxies: clusters: general – gravitational lensing – dark matter1 Introduction
The BL Lacertae objects are widely believed to be FR 1 radio galaxies viewed in the direction of the jet axis. There are several pieces of evidence for this association (Urry & Padovani Urry (1995)): the extended radio luminosity of BL Lac objects is similar to the flux of FR 1 galaxies, the host galaxies of BL Lacertae objects are large elliptical galaxies similar to FR 1 galaxies, and the luminosity function of the BL Lacs is what would be expected as Doppler-boosted luminosity function of FR 1s.
To find more evidence for this unification scheme, the environments of BL Lacs and FR 1s have to be studied. Since the properties of the cluster environment do not depend on the viewing angle, the environments of both classes should be similar. Zirbel (Zirbel (1997)) studied 123 groups and clusters of galaxies around radio galaxies by determining a richness quantity , which is obtained by counting galaxies that are brighter than mag and that surround the radio galaxy within a radius of 0.5 Mpc. The results show that FR 1 galaxies are found in clusters with average richness corresponding to Abell richness class 0 while FR 2 galaxies are even poorer. According to Wold et al. (Wold (2000)) the clusters with quasars also have an average richness class 0.
The cluster environments of BL Lac objects have not been studied as much as the environments of quasars. Wurtz et al. (Wurtz93 (1993), Wurtz (1997)) have done a statistical study of 50 objects, but only a few individual BL Lac environments have been studied more deeply. The results by Wurtz et al. (Wurtz93 (1993), Wurtz (1997)) show that most BL Lac host galaxies are in poor clusters; most of them have Abell richness class below 0. This implies that BL Lac objects belong to poorer clusters than FR 1’s, and therefore they should not be similar objects. Falomo et al. have studied a few individual objects: H 0414+009 and PKS 2155-304 lie in moderately poor clusters with Abell richness class 0 (Falomo et al. 1993a , 1993b ), while PKS 0548-322 belongs to a rich cluster with Abell richness class 2 (Falomo et al. Falomo95 (1995)).
RGB 1745+398 has a significant advantage over most of the other known BL Lac objects: the cluster works as a strong gravitational lens, forming a large blue arc around itself (Fig. 1; Nilsson et al. Nilsson (1999)). Gravitational lensing gives us a possibility to observe also the dark matter, and thus to estimate the total mass of the cluster.
In gravitational lensing the light from a background object is bent by a large mass on its way. The result is a distorted image of the light source. Lensing makes it possible to observe light sources that would otherwise be too faint, but it also gives us information about the lens. Giant arcs are formed when the lens and the background source are nearly on the same line of sight. The arcs lie at the Einstein radius of the lensing clusters, and their radii depend on the mass inside the arc radius (Fort & Mellier Fort (1994)).
Besides RGB 1745+398, only one other BL Lac object with a possible gravitational arc has been found. Scarpa et al. (Scarpa (1999)) report the discovery of almost perfect ring of radius around BL Lac object 1517+656. It was studied more closely by Beckmann et al. (Beckmann (1999)) who measured the redshift and magnitude of the BL Lac, and estimated the mass and velocity dispersion of the cluster surrounding it. The measured redshift of the object was , but this result was uncertain because the absorption they observed could have been caused also by a foreground object. Unfortunately they did not manage to measure the redshift of the arcs, which makes their mass and velocity dispersion estimates very uncertain.
RGB 1745+398 was part of the ROSAT-Green Bank sample of BL Lacertae objects (Laurent-Muehleisen et al. Laurent (1998)). The radio source was identified with an elliptical galaxy at . The X-ray luminosity has been measured by Gliozzi et al. (Gliozzi (1999)), separately for the BL Lac object and the cluster. Their result for the BL Lac is erg s-1, and for the cluster erg s-1, and their estimation for the mass enclosed by the arc is . The blue arc lies 8′′ SE of the BL Lac object and has a length of 14′′. Redshift of the arc is (Nilsson et al. Nilsson (1999)).
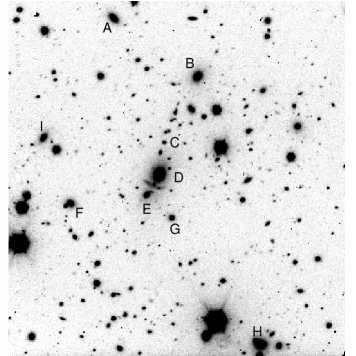
The target was also studied by Swinbank et al. (Swinbank (2006)) who concentrated on the background galaxy which is seen as the arc. They modeled the lens cluster in order to form an undistorted image of the background galaxy. Their model used two galaxies near the arc: galaxies D and E in Fig.1. In their best-fit model the velocity dispersion of the cluster is 560 km s-1.
The purpose of this paper is to study the environment of RGB 1745+398. We measured the velocity dispersion from the redshifts of the cluster galaxies, and estimated the mass using the softened isothermal sphere model. The galaxy-BL Lac spatial covariance function, , was also obtained for determining the richness of the cluster.
The cosmological model used in this paper is the CDM model with km s-1Mpc-1, and .
2 Observations
The observations were made at the 2.56 m Nordic Optical Telescope (NOT), La Palma, Canary Islands, in July 1997 and July 1998, using the ALFOSC instrument, and in August 1999 at the Calar Alto 3.5 m telescope using the MOSCA instrument. During the observations at the NOT there was some dust in the air and the seeing was mediocre, 1.0–1.5′′ FWHM. At Calar Alto, seeing was between 1.2 and 1.5 arcsec. At NOT, and band images were obtained with exposure times of 900 s and field sizes of 6.55.6 arcmin. The Calar Alto observations included band images with exposure time 900 s and field size 1117 arcmin. The quality of the images at Calar Alto was worse than at the NOT, the largest problem being the lack of photometric standard stars, and we used them only to confirm the galaxy count results. Images were bias-substracted and flat-fielded with twilight flats. Photometric calibration was done using standard stars in the field of PG1633+099.
Longslit spectroscopy was obtained at the NOT using a 1′′ slit and spectral range 5000–10250 Å, with a resolution of 13.4 Å. The orientations of the slit were chosen in a way that covered as many possible galaxies near the BL Lac object as possible. There were nine spectra with 3600 s exposure in three different positions and two 1800 s exposures in two more positions. The spectra were bias-subtracted using the overscan region and flat-fielded with a continuum lamp. They were wavelength-calibrated using calibration lamp exposures obtained before and after the science exposures and the calibration was tested by measuring the background sky emission lines before the background was subtracted. The average errors in wavelength are approximately 0.5 Å. This corresponds to 30 km/s at the object redshift. The flux calibration was done using the standard star BD253941.
3 Results
3.1 Mass estimation
We observed spectra for nine galaxies, and their redshifts were obtained by measuring absorption lines 4300 CH G, 4861 Hβ, 5176 Mg b, 5269 Fe i and 5892 NaD. Line-of-sight velocities were calculated from the redshifts using the formula
| (1) |
where is the redshift of the galaxy and the average redshift of all the galaxies (Danese et al. Danese (1980)).
The locations of the measured galaxies can be seen in Fig. 1 and the spectra are shown in Fig 2. The results for their redshifts and velocities and their measurement errors are presented in Table 1. Galaxy D is the brightest galaxy containing the BL Lac nucleus. The average redshift of the galaxies is which is well consistent with the BL Lac redshift 0.267 measured by Laurent-Muehleisen et al. (Laurent (1998)).

| Object | ||||||
|---|---|---|---|---|---|---|
| A | 18.29 | 20.98 | 0.2659 | 0.0002 | -400 | 60 |
| B | 18.21 | 20.81 | 0.2705 | 0.0002 | +690 | 60 |
| C | 20.12 | 23.51 | 0.2680 | 0.0005 | +100 | 200 |
| D | 17.23 | 18.85 | 0.270 | 0.002 | +500 | 600 |
| E | 18.86 | 21.44 | 0.2701 | 0.0004 | +600 | 200 |
| F | 18.28 | 20.42 | 0.2666 | 0.0003 | -240 | 90 |
| G | 19.12 | 21.70 | 0.2671 | 0.0007 | -100 | 300 |
| H | 17.90 | 20.58 | 0.2650 | 0.0004 | -600 | 200 |
| I | 18.75 | 21.29 | 0.2656 | 0.0002 | -470 | 60 |
The radial velocity dispersion of the cluster is calculated using the methods of Danese et al. (Danese (1980)), and the result is km s-1, measurement errors being 68 % confidence uncertainties. This result is consistent with the velocity dispersion of Swinbank et al. (Swinbank (2006)).
If we assume that the arc lies on the Einstein radius of the cluster the mass inside this radius is . This confirms the result of Nilsson et al. (Nilsson (1999)). The error in the Einstein radius was assumed to be 20 %. The band flux of the BL Lac host galaxy has been measured to be 0.65 mJy, and so mass-to-luminosity ratio inside the radius is .
For estimating the total mass of the cluster, we assume the softened isothermal mass distribution with a density distribution
| (2) |
where is the radial velocity distribution and is the core radius. Surface density at projected distance is
| (3) |
where is the surface density in the center of the cluster (Kormann et al. Kormann (1994)). This must be larger than the critical surface density of gravitational lensing where , and are distances to the source seen as the arc, to the lensing cluster and between the source and the cluster respectively. With these the maximum core radius can then be calculated, and the result is kpc. Surface density of the cluster center can be obtained by integrating equation 3 so that it gives an equation for the mass which is then set equal to the mass aquired using the lensing. Mass on any radius can then be calculated with equation
| (4) |
where is the distance of the arc from the cluster center in distance units.
The cluster mass is calculated as the mass inside , which is the distance inside which the density is more than 500 times the critical density of the Universe, in this case about 1 Mpc. The mass is . When comparing to other clusters, for example in RASS-SDSS survey (Popesso et al. Popesso (2005)), we can see that this mass is similar to masses of other clusters with the same X-ray luminosity. Bahcall et al. (Bahcall (2003)) give relations between mass, velocity dispersion, luminosity and richness for clusters of galaxies. They use the mass inside an 0.6 Mpc radius from the cluster center. We calculated this mass using equation 4 with kpc, and the result is . The richness indicator related to this mass is between 60 and 90, and there should be at least 30 galaxies in the cluster. According to McNamara et al. (McNamara (2001)), this refers approximately to Abell richness class 1 or 2. On average this relation between the mass and the richness is consistent with the theoretical models of the halo occupation distribution by Kravtsov et al. (Kravtsov (2004)) and Zheng et al. (Zheng (2005)). According to Ledlow et al. (Ledlow (2003)) also the X-ray luminosity indicates about the same richness although the relation between the richness and the luminosity is quite weak. On the whole, our results for the mass of the cluster points towards a relatively rich cluster, having Abell richness class .
3.2 Richness calculation
For a direct measure of richness we obtained the galaxy-BL Lac spatial covariance function amplitude, . The method used for this was initiated by Longair & Seldner (Longair (1979)), and it has been widely used for studying the environments around different types of AGN (e.g. Wurtz et al. Wurtz (1997), Yee & López-Cruz Yee (1999), Wold et al. Wold (2000)). We did this measurement using the NOT band image, but also counted the number of the galaxies in the band images of both NOT and Calar Alto to make sure the background count is not infected by the cluster because of the smaller field of view of ALFOSC.
The determination of was done in the following manner:
1. The sources which were closer than 500 kpc from the central galaxy of the cluster were analyzed using Source Extractor (Bertin & Arnouts Bertin (1996)) in order to separate the galaxies from the foreground stars. The radius 500 kpc at the distance of the cluster correspondes to in angular units.
2. The galaxies in the area inside the 500 kpc radius, which were brighter than the limiting magnitude, were counted.
3. The number of background galaxies was determined by performing steps 1 and 2 for a same-size area near the cluster.
4. Angular cross-correlation function was calculated using the equation
| (5) |
where is the number of galaxies within the circle of radius corresponding 500 kpc at the BL Lac redshift and is the number of background galaxies. The slope of the correlation function was assumed to be 1.77.
5. The spatial covariance function amplitude was then obtained by scaling with universal luminosity function . This is done by using equation
| (6) |
where is an integration constant, the angular diameter distance to the cluster, the average surface density of galaxies, and it is obtained by integrating the universal luminosity function over the distance. We use the luminosity function of Schechter (Schechter (1976)) with the parameters and . The and evolutionary corrections were taken from Poggianti (Poggianti (1997)).
We used limiting magnitude for determining . This corresponds to the absolute magnitude -19.7 at the redshift of the cluster. This is approximately the same as the limit used by Wurtz et al. (Wurtz (1997)). As they explain, the background counts start rising faster above this magnitude, resulting with less accurate results. Another reason for not using a fainter limit is that the classification between stars and galaxies gets more uncertain with growing magnitude. This can be seen in Fig. 3, which shows that the number of unidentified objects increases at high magnitudes.

The background counts were determined using a ring-shaped area around the cluster with inner radius and outer radius . This is very near the cluster, and it might be possible that outer parts of the cluster would affect the background. Because of this we complemented the galaxy counts also by the band images. In the NOT band image the background galaxies were counted at the same area as in the band image, while for the Calar Alto image we used a rectangular area starting at to the East of the cluster center. The differences between the band images of these telescopes are small, there are from 1 to 6 galaxies more in the NOT image background than in the Calar Alto image background at the same limiting magnitude. In the worst case this could cause the result for to be 400 Mpc1.77 too small, which corresponds to an error of one in Abell richness class.
There is a good consistency between our background counts in the NOT images and the average background counts presented by Wold et al. (Wold (2000)). For the band image with limiting magnitude the number of background galaxies on our square arcsecond counting area is 23 galaxies, which gives an average number of 6300 galaxies per square degree, while Figure 2 in Wold et al. (Wold (2000)) shows this number is approximately 6000. This comparison implies that our background counts should not be strongly biased.
The number of galaxies inside the 500 kpc radius of 1745+398 at the limiting magnitude is galaxies, the background number being . These values give rad0.77, and Mpc1.77, with error of .
Comparing our result to the results of Wurtz et al. (Wurtz (1997)) is slightly problematic because they used a cosmology model with km s-1Mpc-1 and . With this cosmology our result would be Mpc1.77. According to Yee & Lopez-Cruz (Yee (1999)) this corresponds to Abell richness class 1, and it is clearly richer than most clusters with a BL Lac object in Wurtz et al. (Wurtz (1997)).
A simpler way to determine the richness of the cluster is to use , which is the excess of galaxies inside the 500 kpc radius of the cluster center. Bahcall (Bahcall81 (1981)) defines as the number of galaxies brighter than , subtracted by the number of background galaxies with the same limiting magnitude. The magnitude is the magnitude of the third brightest galaxy in the cluster, and in our case it is (target B in Fig. 1). The result is , and it corresponds to Abell richness class 1.
In order to confirm the presence of a cluster at the correct redshift, we also compared the NOT and band images, and calculated the colors of targets that were classified as galaxies in both fields. According to Fukugita et al. (Fukugita (1995)) the color of a typical elliptical galaxy at redshift 0.2 is 2.39, and therefore we expect most of the galaxies at redshift 0.267 to have between 2 and 3. In order to get as large a number of galaxies as possible, we set the limiting magnitude as high as possible even if the target classification gets uncertain. On band, targets could be found until magnitude , and on band until . With these limits we found 88 galaxies inside the 500 kpc radius and 75 at the background area in the band image, and 89 galaxies inside the 500 kpc radius and 58 galaxies at the background area in the band image. Of these galaxies 46 at the cluster area, and 35 at the background area were found and recognized as galaxies on both wavelength bands. Most of these galaxies were bright ones, with . The color distribution of these galaxies is shown in table 2.
| color | ||
|---|---|---|
| 4 | 4 | |
| 18 | 17 | |
| 22 | 13 | |
| 2 | 1 |
Eight of the nine galaxies that we have a spectrum for have the color between 2 and 3; and as we can see in table 2, this color bin is also where most of the excess galaxies at the cluster area are. Wake et al. (Wake (2005)) have measured color-magnitude relations for 12 clusters at redshift , and also the galaxies in those clusters have colors in this range more frequently than do the background galaxies.
4 Conclusions
We studied the cluster environment of RGB 1745+398 using images and spectra of the galaxies near the BL Lac. Our measurements confirm that there is a cluster of galaxies surrounding RGB 1745+398. We measured the velocity dispersion and calculated the total mass of the cluster by assuming a softened isothermal sphere for its mass distribution, and measured the richness of the cluster by determining the galaxy-BL Lac spatial covariance function amplitude . This is the first time the cluster mass and dark matter content of a cluster with a BL Lacertae object has been studied in such detail.
The velocity dispersion of the cluster is 470 km s-1, which is consistent with the result of Swinbank et al. (Swinbank (2006)). The mass, and the x-ray luminosity, erg s-1 indicate that the cluster is a massive one. The richness of the cluster, Mpc1.77 is consistent with these results. We estimate the Abell richness class of the cluster is approximately 1.
The other BL Lac cluster with a possible gravitational arc, 1517+656, could offer a valuable reference point for comparing our results. Beckmann et al. (Beckmann (1999)) estimate the lower limit for its mass inside the gravitational arc to be . According to our estimation, this would mean the total mass of the whole cluster, inside a 1 Mpc radius, was . This is close to our result for the cluster around 1745+398, but it is based on the assumption that the redshift of the arcs would be , which is not based on measurements. More measurements of this object could prove it really is a lensing system, and give another accurate mass estimate.
The numerical simulations have predicted a model for AGN where matter merges into the supermassive black hole, and this causes the high luminosity (e. g. Hopkins et al. Hopkins (2005)). Recent observations by Serber et al. (Serber (2006)) propose that the local density excess of galaxies within 0.1–0.5 Mpc is likely to contribute to the triggering of quasar activity through mergers and other interactions. On the other hand, Zauderer et al. (Zauderer (2007)) summarize many studies of the environments of different types of AGN, showing that there are not more than the average number of field galaxies surrounding most of the AGN. From this point of view, RGB 1745+398 is an object in an unusually rich environment. More research is still needed for finding out how the AGN activity is related to the environment on a larger scale.
This has been a detailed study of one cluster with a BL Lac object, but to get some answers for the unification schemes of BL Lac objects and other AGN we should study more AGN in a similar fashion. Since gravitational arcs are so rare, most AGNs cannot be studied quite this accurately. One possibility is to find out whether the amount of dark matter near AGN is different in different types of objects. Estimates of mass from the velocity dispersion and the X-ray luminosities of the clusters could be compared to the richness values. Also the large-scale surveys provide new possibilities for studying the environments of different kinds of AGN at different redshifts.
Acknowledgements.
The authors would like to thank the anonymous referee for the useful comments and suggestions for improving this article. Based on observations made with the Nordic Optical Telescope, operated on the island of La Palma jointly by Denmark, Finland, Iceland, Norway and Sweden, in the Spanish Observatorio del Roque de los Muchachos of the Instituto de Astrofisica de Canarias. The data presented here have been taken using ALFOSC, which is owned by the Instituto de Astrofisica de Andalucia (IAA) and operated at the Nordic Optical Telescope under agreement between IAA and the NBIfAFG of the Astronomical Observatory of Copenhagen. Based on observations collected at the Centro Astronómico Hispano Alemán (CAHA) at Calar Alto, operated jointly by the Max-Planck Institut für Astronomie and the Instituto de Astrofísica de Andalucía (CSIC).References
- (1) Bahcall, N. A. 1981, ApJ, 247, 787
- (2) Bahcall, N. A., McKay, T. A., Annis, J., et al. 2003, ApJ, 148, 243
- (3) Beckmann, V., Bade, N. & Wucknitz, O. 1999, A&A, 352, 395
- (4) Bertin, E. & Arnouts, S. 1996, A&AS, 117, 393
- (5) Danese, L., De Zotti, G., di Tullio, G. 1980, A&A, 82, 322
- (6) Falomo, R., Pesce, J. E. & Treves, A. 1993a, AJ, 105, 2031
- (7) Falomo, R., Pesce, J. E. & Treves, A. 1993b, ApJ, 411L, 63
- (8) Falomo, R., Pesce, J. E. & Treves, A. 1995, ApJ, 438, 9
- (9) Fort, B. & Mellier, Y. 1994, A&ARv, 5, 239
- (10) Fukugita, M., Shimasaku, K. & Ichikawa, T. 1995, PASP, 107, 945
- (11) Gliozzi, M., Brinkmann, W., Laurent-Muehleisen, S. A., Takalo, L. O. & Sillanpää, A., 1999, A&A, 352, 437
- (12) Hopkins, P. F., Hernquist, L., Cox, T. J., et al. 2005, ApJ, 630, 705
- (13) Kravtsov, A., V., Berlind, A. A., Wechsler, R. H., et al. 2004, ApJ, 609, 35
- (14) Kormann, R., Schneider, P., Bartelmann, M. 1994, A&A, 284, 285
- (15) Laurent-Muehleisen, S. A., Kollgaard, R. I., Ciardullo, R., et al. 1998, ApJS, 118, 127
- (16) Ledlow, M. J., Voges, W., Owen, F. N., Burns, J. O. 2003, AJ, 126, 2740
- (17) Longair, M. S., Seldner, M. 1979, MNRAS, 189, 433
- (18) McNamara, B. R., Vikhlinin, A., Hornstrup, A., et al. 2001, ApJ, 558, 590
- (19) Nilsson, K., Takalo, L., Pursimo, T., et al. 1999, A&A, 343, 81
- (20) Poggianti, B. M. 1997, A&AS 122, 399
- (21) Popesso, P., Biviano, A., Böhringer, H., Romaniello, M. & Voges, W. 2005, A&A 433, 431
- (22) Scarpa, R., Urry, C. M., Falomo, R., et al. 1999, ApJ, 521, 134
- (23) Schechter, P. 1976, ApJ, 203, 297
- (24) Serber, W., Bahcall, N., Ménard, & Richards, G. 2006, ApJ, 643, 68
- (25) Swinbank, A. M., Bower, R. G., Smith, G. P., et al. 2006, MNRAS, 368, 1631
- (26) Urry, C. M. & Padovani, P. 1995, PASP, 107, 803
- (27) Wake, D. A., Collins, C. A., Nichoil, R. C., Jones, L. R. & Burke, D. J. 2005, ApJ, 627, 186
- (28) Wold, M., Lacy, M., Lilje, P. B., Serjeant, S. 2000, MNRAS, 316, 267
- (29) Wurtz, R., Ellingson, E., Stocke, J. T. & Yee, H. K. C. 1993, AJ, 106, 869
- (30) Wurtz, R., Stocke, J. T., Ellingson, E. & Yee, H. K. C. 1997, ApJ, 480, 547
- (31) Yee, H. K. C. & López-Cruz, O. 1999, AJ, 117, 1985
- (32) Zauderer, B. A., Veilleux, S. & Yee, H. K. C. 2007, ApJ, 659, 1096
- (33) Zheng, Z., Berlind, A. A., Weinberg, D. H., et al. 2005, ApJ, 633, 791
- (34) Zirbel, E. L. 1997, ApJ, 476, 489