XMM-Newton observations of the supernova remnant IC 443:
Abstract
Aims. We investigate the spatial distribution of the physical and chemical properties of the hot X-ray emitting plasma of the supernova remnant IC 443, in order to get important constraints on its ionization stage, on the progenitor supernova explosion, on the age of the remnant, and its physical association with a close pulsar wind nebula.
Methods. We present XMM-Newton images of IC 443, median photon energy map, silicon and sulfur equivalent width maps, and a spatially resolved spectral analysis of a set of homogeneous regions.
Results. The hard X-ray thermal emission (1.4–5.0 keV) of IC 443 displays a centrally-peaked morphology, its brightness peaks being associated with hot (kT1 keV) X-ray emitting plasma. A ring-shaped structure, characterized by high values of equivalent widths and median photon energy, encloses the PWN. Its hard X-ray emission is spectrally characterized by a collisional ionization equilibrium model, and strong emission lines of Mg, Si, and S, requiring oversolar metal abundances. Dynamically, the location of the ejecta ring suggests an SNR age of 4,000 yr. The presence of overionized plasma in the inner regions of IC 443, addressed in previous works, is much less evident in our observations.
Key Words.:
X-rays: ISM—ISM: supernova remnants—ISM: individual: IC 443—pulsars: individual: CXOU J061705.3+2221271 Introduction
The Galactic SNR IC 443 (G189.1+3.0) has an optical and radio double shell morphology (Leahy, 2004; Reich et al., 2003; Braun & Strom, 1986; Duin & van der Laan, 1975). Signatures of interaction with a dense and complex environment are visible at radio (e.g. Snell et al., 2005; Denoyer, 1977) and IR wavelengths (Neufeld & Yuan, 2008; Rho et al., 2001, and references therein). In the northeast the shock front has been decelerated by the encounter with a H i cloud (Rho et al., 2001; Dickel et al., 1989; Denoyer, 1978). A giant molecular cloud, mapped by Cornett et al. (1977), is located in the foreground, and is interacting with the remnant at several positions along the southern rim (as schematically represented in Fig. 9 of Troja et al., 2006). IC 443 is also a source of -rays (Esposito et al., 1996; Sturner & Dermer, 1995). Interestingly, in the same region of sky where OH (1720 MHz) maser emission is detected (Hewitt et al., 2006; Hoffman et al., 2003; Claussen et al., 1997), Albert et al. (2007) discovered a source of very high energy –ray emission, possibly originated by the interactions between cosmic rays accelerated in IC 443 and the dense molecular cloud.
Very interesting features and a peculiar morphology are displayed in the X-ray band (Bykov et al., 2008, 2005; Bocchino & Bykov, 2003; Asaoka & Aschenbach, 1994; Wang et al., 1992; Petre et al., 1988). The bulk of its X-ray emission is thermal, fairly described with a two components ionization equilibrium model of temperatures 0.2–0.3 keV (hereafter “cold component”) and 1.0 keV (hereafter “hot component”; Troja et al. 2006; Asaoka & Aschenbach 1994; Petre et al. 1988). A source of very hard X-ray emission, identified as a pulsar wind nebula (PWN), lies close to the SNR’s southern rim and is possibly associated with the remnant (Gaensler et al., 2006; Bocchino & Bykov, 2001; Olbert et al., 2001).
On the basis of its X-ray properties, as observed by ROSAT, IC 443 has been classified as a mixed morphology (MM) SNR. MM SNR main features were codified by Rho & Petre (1998) as follows: 1) the X-ray emission is thermal and centrally peaked, with little or no evidence of a limb-brightened X-ray shell; 2) it arises primarily from swept-up interstellar material, not from ejecta; 3) a flat temperature radial profile, and a constant or increasing density toward the remnant center; 4) a physical association with dense molecular clouds.
XMM-Newton high resolution observations of IC 443, presented by Troja et al. (2006), resolved a limb-brightened shell structure in the very soft X-ray band (0.3–0.5 keV), and reported a first evidence of Mg, Si and S enhanced abundances. In addition, XMM-Newton and Chandra observations of several other MM SNRs unveiled very steep X-ray brightness profiles and multi-component X-ray-emitting plasma with enhanced abundances (Lazendic & Slane, 2006; Shelton et al., 2004). More recent results suggest indeed a non negligible presence of metal enrichment gradients and stellar ejecta inside at least 50% of all known MM SNRs.
Strong Si and S lines in the IC 443 X-ray spectrum were first reported by Petre et al. (1988), and then studied in detail by Kawasaki et al. (2002). In the latter work the X-ray emission from IC 443 was described by a two temperatures model, with a 0.2 keV component in ionization non-equilibrium (NEI) and a 1.0 keV component in collisional ionization equilibrium (CIE). Narrow Gaussians were used to reproduce the most prominent lines. The elements abundances were all below the solar value, as expected for X-ray emission from the shocked ISM. From the relative strengths of Si and S lines, Kawasaki et al. (2002) derived an ionization temperature of 1.5 keV, significantly above the 1.0 keV continuum temperature. Those results led to the hypothesis of an overionized thermal plasma.
Using XMM-Newton observations of the SNR IC 443, we have already presented a detailed analysis of the soft X-ray thermal emission, mainly originated from the shocked ISM (see Troja et al. 2006). Unlike Kawasaki et al. (2002) our spectral results gave a soft X-ray component (kT0.2–0.3 keV) near the equilibrium condition (1012 cm-3 s) in most of the analyzed regions. The hot component (kT1.0 keV) was in full equilibrium and showed a high metallicity.
The present work focuses on the properties of the hot X-ray thermal component, and is aimed at 1) addressing the high metal abundance plasma inside the remnant and its ionization stage; 2) checking whether the abundance pattern of the hot X-ray emitting plasma is consistent with a core-collapse SN as progenitor, as already hinted by the presence of the PWN.
The paper is organized as follows: observations are described in §2; results from imaging and spectral analysis are presented in §3. In §4 we discuss their implications for the remnant ionization stage (§4.1), the SN progenitor (§4.2), and the age of IC 443 (§4.3). A summary of our conclusions is presented in §5. Throughout the paper, the quoted uncertainties are at the 90% confidence level (Lampton et al., 1976), unless otherwise stated.
2 Observations and Data Reduction
We analyzed four pointings XMM-Newton observations of IC 443,
performed during the Cal/PV phase on 2000 September 25-28
and previously described in Troja et al. (2006) and Bocchino & Bykov (2003).
We added a more recent and very deep XMM-Newton observation, taken on 2006 March 30
(ObsID 0301960101, P.I. F. Bocchino), and centered on the
southeastern side of the remnant at R.A.(J2000)=06h18m04s,
Dec(J2000)=+22°27′33″ (see also Bykov et al., 2008).
Our work is focused on the analysis of EPIC MOS data.
We used the Science Analysis System software (SAS,version 7.0)
for data processing and xspec v.11.3 (Arnaud, 1996)
for spectral analysis.
Data were screened to remove spurious events and time intervals with heavy proton flaring. After the particle background removal, the total exposures for the MOS cameras (MOS1+MOS2) were 170 ks and 140 ks for the 2000 and 2006 data sets, respectively.
In order to estimate the Galactic background we used a set of blank sky observations performed as part of the Galactic Plane Survey (GPS, P.I. Parmar). We verified that, in the energy band (0.3–5.0 keV) selected for the analysis, our results are not sensitive to the background subtraction (either GPS or high Galactic latitude blank fields). We refer to our previous paper (Troja et al., 2006) for more details about the observations and the data reduction techniques we used.
3 Results
3.1 X-ray Images
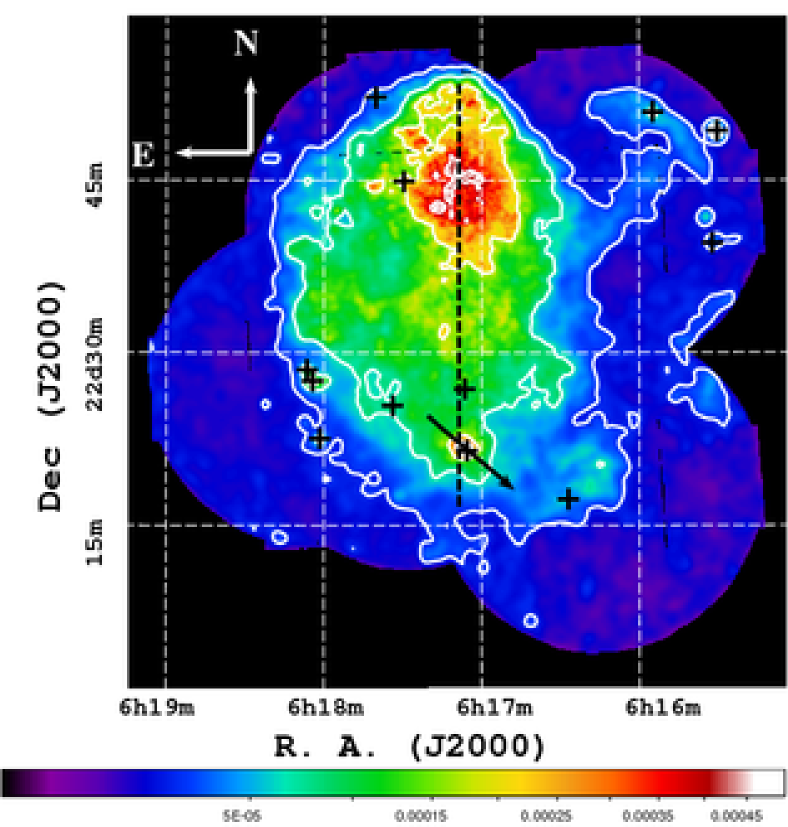
Fig. 1 shows the composite image of IC 443 in the hard 1.4-5.0 keV energy band, where the contribution of the cold X-ray emitting plasma is negligible (see Troja et al. 2006). The image is background subtracted, exposure and vignetting corrected. We reported the position of the 12 hard X-ray point sources detected by Bocchino & Bykov (2003).
The hard band morphology does not resemble IC 443 emission in other bands (optical, radio, IR and soft X-ray) and, on the plane of the image, it appears inner concetrated with respect to the cold X-ray emitting plasma.
The hard X-ray thermal emission is dominated by an elongated axis-symmetric structure, having its surface brightness peak in the northeastern (NE) quadrant. The symmetry axis, traced by the dashed line in Fig. 1, does not match with the plerion wind nebula (PWN) direction of motion (-130o N through E, Gaensler et al. 2006), as indicated by the arrow in Fig. 1.
It is worth noting that the X-ray surface brightness is higher ( 0.012 cts s-1 arcmin-2) in the subshell A (following the naming convention of Braun & Strom 1986; see also Fig. 5 of Troja et al. 2006), which is associated with the presence of the neutral cloud in the NE, while it appears strongly reduced ( 0.012 cts s-1 arcmin-2) in the western part (subshell B), where the blast wave is expanding in a more rarefied (n00.25 cm-3) and homogeneous medium.
3.2 Median Energy Map
XMM-Newton great sensitivity and collecting area enabled us to create a high resolution image of the median photon energy in the 1.4–5.0 keV band. In the selected energy range the median energy is mostly influenced by the parameters of the hot X-ray component, being unaffected by spectral variations of the colder one. For a plasma in ionization equilibrium and with solar abundances (model MEKAL in xspec) we verified that the distribution represents a powerful tracer of temperature variations, especially for kT1 keV.
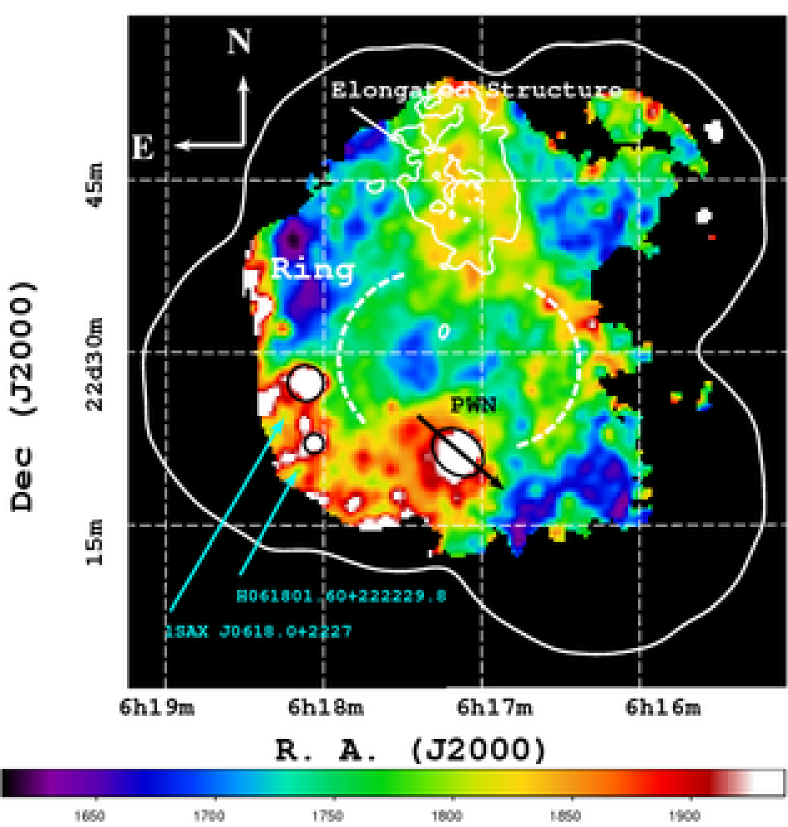
Fig. 2 shows the median energy map of the X-ray emitting plasma in the 1.4-5.0 keV band. For a comparison, we overlaid the brightest hard X-ray emission contours of Fig. 1. The white dashed line guides the eye to identify a ring-shaped structure, which will be discussed in §3.3.
The median photon energy image clearly shows a north-to-south elongated structure, spatially corresponding to the brightest emission features in the hard energy band (contours in Fig. 2). The region of high median energy (1.9 keV) along the southeast edge can be partially attributed to the emission of the PWN and of the other point sources (Bocchino & Bykov, 2003), but it appears to have a much larger extent, suggestive of an extended hard emission. The nature of the hard X-ray source 1SAX J0618.0+2227 (also marked in Fig. 2) has been extensively investigated (Bykov et al., 2008, 2005; Bocchino & Bykov, 2000) and interpreted in the framework of interaction of a molecular cloud with a fast moving SN ejecta fragment. The study of the diffuse hard emission revealed in Fig. 2 is beyond the scope of this work, however we note that it may have a similar physical origin, probably arising from the interaction of the SNR with the structured cloud (van Dishoeck et al., 1993; Burton et al., 1990).
3.3 Equivalent Width Images
IC 443 X-ray emission is primarily thermal and its spectrum is dominated by prominent atomic emission lines. Its global spectrum can be described with a phenomenological model, consisting of two bremsstrahlung components for the continuum (kT0.2 keV and kT1.1 keV) plus Gaussian features reproducing the line emission.
We explored the spatial distribution of the hard X-ray lines emission by constructing equivalent width (EW) images, often used as powerful tracers of stellar ejecta fragments in SNRs (Hwang et al., 2000; Gotthelf et al., 2001; Park et al., 2003a; Cassam-Chenaï et al., 2004; Miceli et al., 2006).
We selected an energy band for each emission line, combining the He and Ly emission of each element (e.g. Si XIII and Si XIV) in a single image to improve the statistic. We chose the energy band that optimizes the signal to noise (S/N) ratio according to our best-fit phenomenological model (Cassam-Chenaï et al., 2004).
X-ray emission in the line energy band needs to be corrected for the underlying continuum emission. The correction is made pixel by pixel because the continuum may be spatially distributed in a different way from the line emission. In order to account for the continuum contamination, we selected two continuum bands located on either side of the line energy band. Their width was chosen to optimize the S/N ratio, according to the recipe of Cassam-Chenaï et al. (2004).
This method was successfully applied to silicon and sulfur lines. We excluded the H-like Mg line at 1.47 keV since the underlying continuum emission cannot be correctly estimated. In this particular case, the low energy continuum band (1.1 keV) is dominated by the soft spectral component and still affected by the strong absorbing column gradients, due to the foreground molecular cloud.
Line and continuum band passes, selected for each spectral line of interest, are listed in Tab. 1.
| Elements | Lines | Low continuum | High continuum |
|---|---|---|---|
| (eV) | (eV) | (eV) | |
| Si | 1790-2060 | 1630-1690 | 2180-2320 |
| S | 2360-2680 | 2180-2320 | 3350-3520 |
Once an image in each energy band was generated, we estimated the continuum emission in the line band (see e.g. Cassam-Chenaï et al. 2004). In each pixel we computed the underlying continuum as a linear combination of the source emission in adjacent continuum bands:
| (1) |
where is the resultant continuum image, and are the background subtracted images in the high and low continuum bands, respectively. The normalization coefficients, , were determined by the ratio of the model predicted counts and the source measured counts in the continuum bands, as in Cassam-Chenaï et al. (2004). The weighting factor was tuned so to minimize statistical fluctuations.
Narrow band images were created with a bin size of 30″ to provide at least 10 counts even in the fainter SNR regions.
In order to generate EW images, the image in the line band was background and continuum subtracted and then divided by the estimated continuum image . Since this operation amplified statistical fluctuations, we previously applied an adaptive smoothing with 30″120″and a signal to noise ratio equal to 5. We finally set the EW to zero in those pixels with a very low estimated continuum (5% than the maximum value, see e.g. Park et al. 2003b).
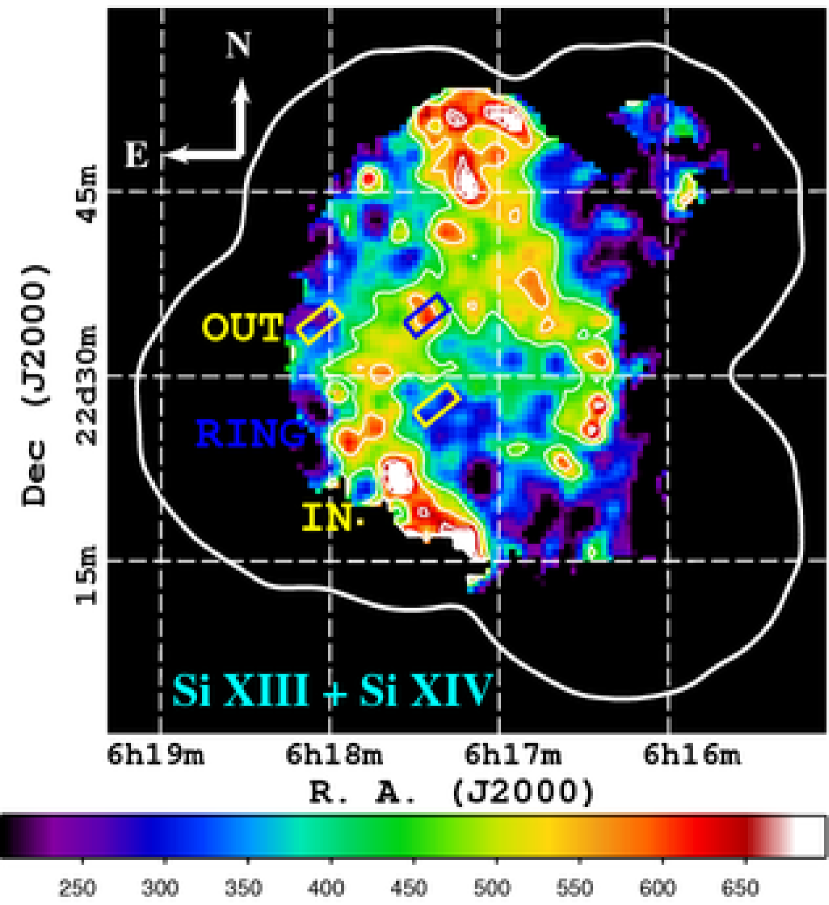
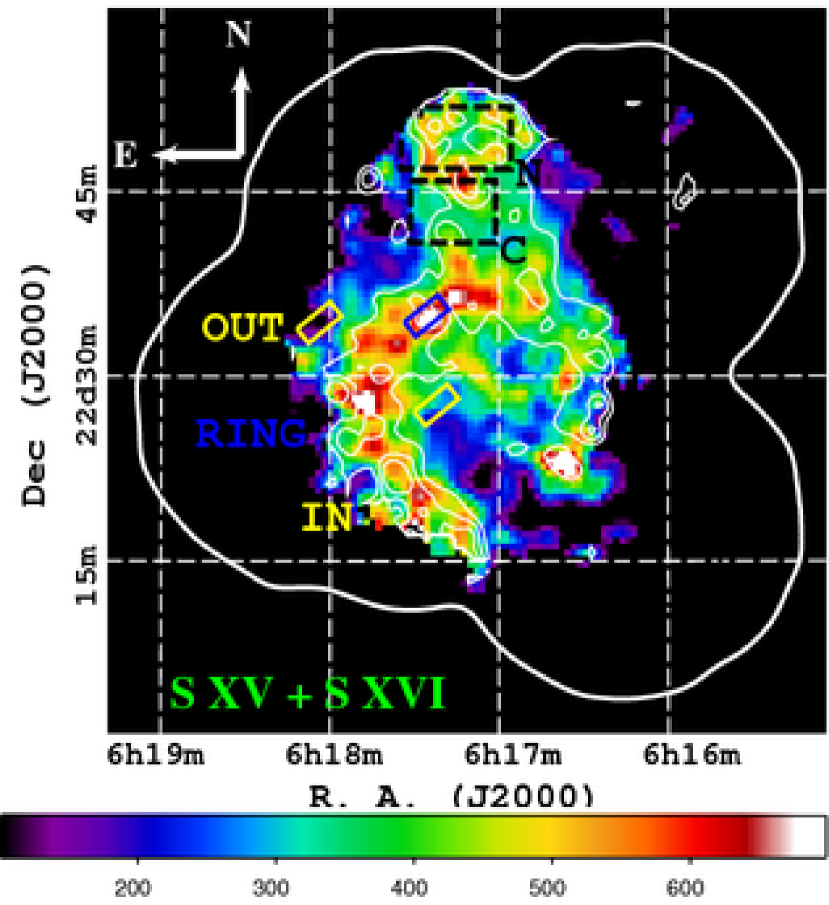
Si and S EW images are presented in Fig. 3, revealing an intriguing circular feature, 10′in radius, in the southern part of the SNR. For a morphological comparison we superimposed Si EW contours on the images, corresponding to 450, 550 and 650 eV. The two images look very similar. The contours of high Si EW match well with the bright S EW features. In particular, we did not find any strong evidence of elemental stratification. Both the EW maps show similar features to the median energy map: an elongated bright structure in the NE quadrant and a circular ring around the PWN region. A rather similar arc-like feature has been observed in the Si EW map of the SNR N49 (Park et al., 2003a) and interpreted as the boundary of hot plasma, re-heated by the reverse shock. The Si arc in N49 is not around the central compact object but, as in the case of IC 443, it is located near the site of interaction with a molecular cloud complex, strengthening the hypothesis of an intense reverse shock, propagating back into the remnant.
The great advantage of EW images is that they are not significantly affected by emission measure variations. However they do also depend on the plasma temperature and ionization age. In order to disentangle multiple effects, we proceeded with direct spatially resolved spectral analysis, using the median photon energy and the EW images as guiding criteria of region selection.
3.4 Spectral Analysis
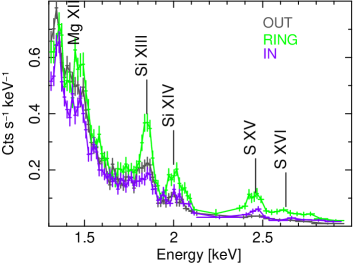
Our aim was to confirm the bright X-ray features visible in Fig. 2 and Fig. 3, and give a quantitative characterization of their spectra. We extracted three EPIC MOS spectra, selected as representative on the basis of the median energy map and the EW images. We selected homogeneous regions, marked in Fig. 3, characterized by small fluctuations (5%) in the median photon energy and in the line EWs. Two of them, named “in” and “out”, have low median energies, low EWs values, and lie inside and outside the ring structure, respectively. The third region, named “ring” and belonging to the ring structure, is particularly bright both in the median energy and in the EW images.
Source and background events list were corrected for vignetting effects with the task evigweight of the SAS package, and then spectra were extracted. We used the relevant on-axis ancillary response file and response matrices generated with the SAS task rmfgen. Spectra were grouped to a minimum of 25 counts per bin and the statistics was used. Fig. 4 show the three spectra at high energies, where striking differences in the properties of the hot X-ray emitting plasma are clearly visible. Prominent Mg, Si, and S lines characterize the “ring” spectrum, whilst line emission is much fainter in the other two regions. Fig. 4 nicely confirms that the identified features correspond to different physical conditions of the emitting plasma.
| Parameters | IN | RING | OUT |
|---|---|---|---|
| E50 (keV) | 1.70 | 1.78 | 1.65 |
| Si EW (eV) | 310 | 550 | 290 |
| S EW (eV) | 280 | 690 | 130 |
| Cold component | |||
| NH (1022 cm-2) | [0.61] | [0.58] | [0.50] |
| kTs (keV) | 0.44 | 0.430.02 | 0.32 |
| (1012 cm-3 s) | 1.7 | 1.80.05 | 2.5 |
| O/O⊙ | 0.78 | 0.68 | 0.300.10 |
| Ne/Ne⊙ | 0.91 | 0.81 | 0.35 |
| Mg/Mg⊙ | 0.45 | 0.350.05 | 0.350.05 |
| Si/Si⊙ | 0.26 | 0.50 | 0.15 |
| Fe/Fe⊙ | 0.10 | 0.200.03 | 0.220.05 |
| EMs (1056 cm-3) | 4.1 | 5.7 | 8.7 |
| Hot component | |||
| kTh (keV) | 1.35 | 1.45 | 0.860.05 |
| Mg/Mg⊙ | 2.6 | 5.0 | [1] |
| Si/Si⊙ | 1.10.3 | 2.40.7 | 0.67 |
| S/S⊙ | 0.70.5 | 2.3 | 0.22 |
| Fe/Fe⊙ | 0.13 | 0.03 | 0.23 |
| EMh (1056 cm-3) | 1.1 | 0.4 | 0.4 |
| /dof | 420/324 | 497/343 | 412/302 |
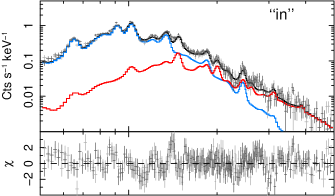
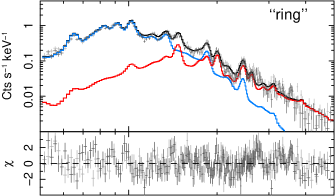
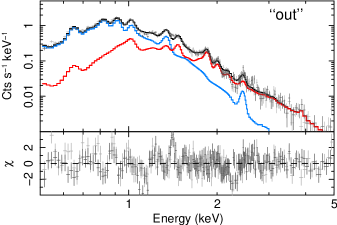
We modeled the spectra over the 0.5–5.0 keV energy band with a NEI plus a CIE thermal component (VPSHOCK+VMEKAL in xspec), as in Troja et al. (2006). MOS1 and MOS2 spectra were simultaneously fitted, leaving the normalization between the two instruments as a free parameter. We included a 5% systematic error term accounting for the uncertainties in the calibration111 The current EPIC MOS status of calibration is reported at http://xmm.vilspa.esa.es/docs/documents/CAL-TN-0018.pdf. The absorbing column NH was estimated by using the median photon energy in the soft band (cf. Troja et al. 2006, Fig. 6), and held fixed at the derived value.
Spectra and best-fit models are shown in Fig. 5. Table 2 reports the spectral properties (median photon energy E50, Si and S EWs), and the best-fit spectral parameters for each region.
3.4.1 Overionization
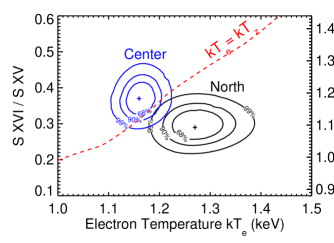
Taking advantage of the large XMM-Newton effective area at high energies, we checked the overionization claim made by Kawasaki et al. (2002, 2005). For this purpose, we extracted two spectra from the “North” and “Center” regions (see Fig. 2 of Kawasaki et al. 2002), and performed the same comparison between the ionization and the electron continuum temperatures.
We selected the 2.2–5.0 keV energy range and we modeled the spectrum with a thermal component (model VMEKAL in xspec), fixing the S abundance to zero. Three narrow gaussians (centered at 2.46, 2.62 and 2.88 keV) were used to model the sulfur line emission. The intensity line ratio of the H-like and He-like ions (S xvi/S xv) is a function of the S ionization temperature, derived using the APED line emissivity database (Smith et al., 2001).
The absorption column densities were held fixed to the values of 0.601022 cm-2 for the “North” spectrum and 0.681022 cm-2 for the “Center” spectrum, as derived from the NH/E50 calibration plot (Fig. 10 in Troja et al. 2006). We also tested the absorption column value of 0.741022 cm-2, used by Kawasaki et al. (2002), but it does not affect the final result as expected at these high energies.
Fig. 6 shows the 68%, 90%, and 99% contours in the parameters space S xvi/S xv– kTe. The CIE is represented by the dashed line, tracing the condition kTe=kTz. In the “North” region we found evidence of an underionized plasma, in stark contrast with the findings of Kawasaki et al. (2002); in the “Center” region the derived ionization temperature is slightly higher than the the electron temperature,though consistent with it at the 90% confidence level. Therefore, a detailed analysis of the ionization state does not directly support the presence of an overionized plasma in the “North” region, and shows only a marginal (1 ) evidence of overionization in the innermost “Center” region.
4 Discussion
4.1 Presence of hot metal-rich plasma in IC 443
Spatially-resolved spectral analysis confirms that the structures, revealed by the median photon energy and the EW maps (see §3.2 and §3.3, respectively), are associated with a high temperature, high metallicity X-ray emitting plasma.
Our results, listed in Tab. 2, show that the cold plasma is characterized by a temperature of 0.3-0.4 keV, a high ionization timescale (1012 cm-3 s), and solar or undersolar abundances, as expected if the emission arises from the shocked ISM. The hot plasma is fully equilibrated. It has lower metal abundances in the “in” and “out” regions, in good agreement with previous findings for the hot component (Kawasaki et al., 2002; Petre et al., 1988). The temperature Th and the abundances of Mg, Si, and S in the “ring” region are much higher, more similar to regions 2, 6, and 9 analyzed in Troja et al. (2006). As shown in Fig. 2 and Fig. 3, in the NE the hottest plasma appears concentrated in the innermost regions, whilst in the south it display a ring-shaped spatial distribution. Our spectral results fairly agrees with this picture, detecting a high temperature and a substantial metal-enrichment in correspondence to the “ring” region. The measured overabundant Mg, Si and S are suggestive of SN ejecta emission.
IC 443 is a middle-aged remnant, thus the presence of ejecta at its evolutive stage is not expected. Models predict that a great part of the ejecta thermalized with the surrounding medium, being no longer visible. However, XMM-Newton and Chandra high-resolution observations show a growing number of middle-aged remnants (104 yr) where metal rich ejecta are still detectable and significantly contribute to the X-ray emission, as in DEML71 (Hughes et al., 2003), N49B (Park et al., 2003a), and 0103-72.6 (Park et al., 2003b). Moreover, there are several cases among MM SNRs in which a soft component, associated with shocked ISM emission, and a hot metal enriched component have been resolved. For instance, Mavromatakis et al. (2004) described W63 thermal emission with a two temperatures plasma (kT10.2 keV and kT20.6 keV), showing overabundant Mg, Si and Fe in a bright bar-like region near the geometric center of the SNR. Lazendic & Slane (2006) resolved a two temperatures thermal plasma in the inner regions of CTB 1, a prototypical MM SNR, and they showed that the hard component (kT0.8 keV) requires an oversolar Mg abundance.
Kawasaki et al. (2002, 2005) addressed the issue of overionization in the hot plasma of MM SNRs, finding that in 2 objects (namely IC 443 and W49B), out of a sample of 6, some ions are indeed overionized. Such ionization state of the plasma has many important implications, since it would indicate rapidly cooling plasma due, for instance, to thermal conduction. A thermally conductive model has been invoked to explain the centrally peaked morphology of MM SNRs (Cox et al., 1999; Shelton et al., 1999), and overionization would provide a nice consistency check.
We investigated whether overionization conditions are consistent with our XMM-Newton data, performing our check in the same regions of IC443 analyzed by Kawasaki et al. (2002). In the “North” region, we obtained that overionization is not consistent with the results for the S ions. In the “Center” region, overionization is still possible, though not required at the 90% confidence level, for the same ions. We point out that this region is characterized by a wide spread of EWs in both the Si and the S maps (EW/EW40%), therefore the analyzed spectrum originates from chemically inhomogeneous regions. A check of the ionization state would require more uniform conditions. For instance, Miceli et al. (2006) found that in the central core of the SNR W49B there is no compelling evidence of overionization. Unfortunately, our attempt to analyze smaller but more homogeneous regions was affected by the low statistics, and did not significatively constrain the spectral parameters.
4.2 Constraints on the SN progenitor
We presented in § 3.2-3.3 high resolution maps of some properties of the hot plasma (median photon energy, and EWs of Si and S lines). We further investigated and quantified the properties of the X-ray emitting plasma through a spatially-resolved spectral analysis (§ 3.4). Those results allowed us to infer the spatial distribution of the stellar ejecta, and to estimate their abundances pattern and masses in the ring structure, which are strong clues to the nature of the SN progenitor (e.g. Rakowski et al., 2006; Miceli et al., 2006; Park et al., 2004), and the age of the remnant (see § 4.3).
Tab. 3 reports the best fit metal abundances of the “ring” region relative to Si (col. 1), the abundances ratios expected for core-collapse SNe with different progenitor masses (col. 2-4; Woosley & Weaver 1995), and for Type Ia SNe according to different deflagration models (col. 5-6; Rakowski et al. 2006; Badenes et al. 2003). Bearing in mind the uncertainty in the predictions of nucleosynthesis yields, our comparison is aimed at discriminating between Type Ia and Type II SN explosions. Any further inference, for example on the mass of the progenitor, would be highly dependent on the adopted model.
The very low Fe abundance can not meaningfully constrain the progenitor explosion, and it can be explained if the innermost ejecta layers have not been shocked yet. The high Mg abundance allowed us to disfavor a Type Ia SN, which primarily produces Fe-group elements and a negligible fraction of lighter metals. A Type II SN has been previously suggested as the remnant progenitor, only on the basis of its location in a star-forming region and the putative association with a PWN (Gaensler et al., 2006; Bocchino & Bykov, 2001; Olbert et al., 2001). Our results further support and strengthen a core-collapse origin for IC 443.
In order to estimate the total mass of the ejecta, we assumed that the ejecta are confined within a shell of radius 4.5 pc, and width 1 pc, for a total emission volume Vshell7.7 1057 cm3. Hence the hot plasma fills the entire volume Vshell (filling factor =1). The above assumption might not be valid for the Mg ejecta, since it is based on the EW maps of Si and S line complexes. Such high-Z elements are thought to be synthesized by explosive O- or Si-burning in the core of a massive star, while lighter metals mostly reside in the outer layers. If the stellar stratification persists after the explosion, core-collapse nucleosynthesis models predict the Mg ejecta to be preferentially located outside the Si shell (cf. Fig. 1 of Thielemann et al., 1996), thus occupying a larger volume. The possibility of mixing or overturning of the ejecta layers (Willingale et al., 2002; Hwang et al., 2000) add further uncertainty. Therefore the estimated mass of Mg should be taken with care.
For the case where the electrons are primarily from H/He (=1.2 ), we derived a hot component gas density of =(0.620.10) cm-3 in our “ring” region, which intercepts a line of sight of 2 pc. By assuming the same line of sight for the inner and outer regions, we estimated a density of =(0.600.10) cm-3, and =(0.960.16) cm-3, respectively.
We extrapolated the density derived in the “ring” region to the whole shell of ejecta, thus estimating the total mass of hot metal-rich plasma, Mtot4 M⊙. We calculated a lower limit on the mass of ejecta MZ as (e.g. Lazendic et al., 2005), where Mtot is the total mass of the hot X-ray-emitting plasma, AZ is the measured abundance for the element , and is the standard solar mass fraction (6.4 10-4 for Mg, 7.0 10-4 for Si, and 3.6 10-4 for S; Anders & Grevesse 1989). We obtained: MMg0.013 M⊙, MSi0.007 M⊙, MS0.003 M⊙.
An upper limit on MZ was derived by the assumption of “pure” -ejecta, i.e. stellar fragments in which all the electrons are provided by the ionized specie , KZ. This is a crude approximation of the ejecta mass, but not unrealistic as this kind of objects have already been observed in other SNRs, as the Si-rich knots in Cas A (Laming & Hwang, 2003). We considered the contribution from both the ionization states of Si and S (KSi=12.5, KS=14.5), but only the highest ionization state of Mg (KMg=11), as results from the best fit model (see Fig. 5, middle panel). We obtained: MMg0.55 M⊙, MSi0.30 M⊙, MS0.15 M⊙.
It is worth noting that according to Woosley & Weaver (1995) the predicted masses of Mg, Si and S ejecta lie in the ranges between 0.01–0.4 M⊙, 0.02–0.4 M⊙, and 0.01–0.2 M⊙, respectively. These values well agree with the ranges derived from our analysis, which can be considered meaningful constraints on the ejecta masses in the hot shell.
4.3 Age of IC 443
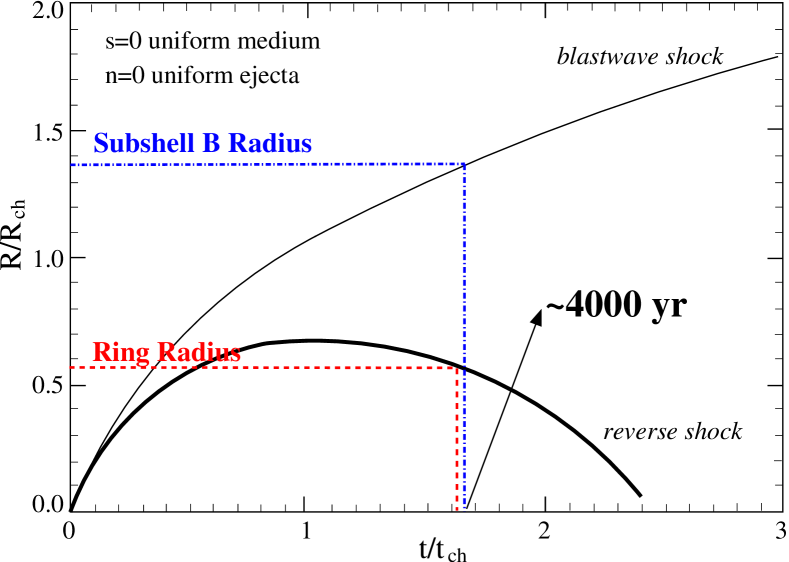
We examined the case of a SNR expanding in an uniform ambient medium (=0) and with an uniform ejecta distribution (=0). Similar results are found when considering a power law ejecta distribution (=2). We took our estimate of the pre-shock density in the eastern regions (subshell B), n00.25 cm-3, and the mass of the hot plasma calculated in §4.2. For typical SN energies (1051 erg), the length scale and the time scale of the Truelove & McKee (1999) solution are 8 pc and 2.3 103 yrs, respectively.
Fig. 7 show the predictions of Truelove & McKee (1999) compared with the observed parameters of IC 443: a forward shock radius of 11 pc (shell B radius) and a reverse shock radius of 4.5 pc (ring radius), correspond to an evolutive age of 4000 yr, much younger than some previous estimates. In particular, Chevalier (1999) derived an age of 3 104 yr by assuming that the remnant has been evolving in a very dense environment (15 cm-3) since its early stages. Our result is instead more similar to the age estimated by Petre et al. (1988), who considered an exponential density distribution for the circumstellar environment. The analysis of the soft X-ray emission from IC 443, and the derived density profile (cf. Troja et al., 2006, Fig. 7) suggest that the blast wave propagated in a much lower density medium, and only recently has encountered a sharp density gradient in the NE (subshell A), impacting onto a neutral hydrogen cloud (Rho et al., 2001; Denoyer, 1978).
As derived in §4.2, the remnant likely originated from the collapse of a massive star. Hence, during the progenitor lifetime strong stellar winds could have blown away the surrounding molecular clouds, forming a low density cavity, where the remnant is now evolving. Braun & Strom (1986) first argued that the multiple shell morphology of IC 443 might be the result of such pre-SN interaction, and that the blast wave is impacting on the pre-existing wind-bubble walls. A detailed kinematical study of the optical filaments in IC 443, carried out by Meaburn et al. (1990), gave further support to the scenario proposed by Braun & Strom (1986). The authors detected high velocity features along their slit Pos. 9, at the edge between subshell A and B, which can be easily explained if the emitting material, accelerated by the passage of the shock, is seen edge-on. The resultant geometry of the optical filaments is fully consistent with an SNR evolving within pre-existing interconnected cavities (cf. Meaburn et al. 1990, Fig. 5).
Since the medium surrounding massive stars is considerably modified by pre-SN winds (e.g. Chu et al., 2003; Dwarkadas, 2005), we verified whether our estimate of the age of IC443 significantly depends on the assumption of a uniform ambient medium. For this purpose, we modeled the evolution of a SNR in an isothermal medium with a power-law density profile , by performing a numerical hydrodynamic simulation. We used the FLASH code (Fryxell 2000) and we set up a spherically symmetric explosion of 3 M⊙ of ejecta with a total energy of erg. The initial velocity profile of the ejecta increases linearly with their distance from the center, and their density profile decreases exponentially (in agreement with Wang & Chevalier 2002). In this case g cm-1, where is the mass-loss rate of the wind and is its speed, and both are assumed to be constant. The location of the forward and reverse shock fronts obtained in the simulation suggests a slightly younger age (3000 yr). Our basic assumption, i. e. that the radial separation between the forward and the reverse shock is the result of the SNR evolutive stage, does not hold if the forward shock in the NW has been strongly decelerated in the cavity walls. Modifications of the shock velocity, due to the interaction of the blast wave with the confining walls, led to systematically underestimate the SNR age. In that case, the inferred value of 4000 yr only provides a lower limit. However, in such a scenario, a close correlation between the two radii, as shown in Fig. 7, is not expected, as the forward shock radius would mainly depend on the properties of the cavity wall. We therefore conclude that the morphology of the X-ray emitting plasma in IC 443 robustly suggests an age 104 yr.
4.3.1 Implications for the PWN
A detailed study of the morphological and spectral properties of the PWN, and its central neutron star (NS; J0617+2221) has been presented by Gaensler et al. (2006). They inferred a blackbody temperature kT∞100 eV for the NS, and argued that the properties of the thermal radiation from the NS are consistent with the Chevalier (1999) age of 30,000 yrs. By using the theoretical cooling curve of Kaminker et al. (2002), we checked that our new estimate of the SNR age and the temperatures range measured by Gaensler et al. (2006) are still consistent with the cooling of a 1.35–1.45 M⊙ NS with a 1p proton superfluid core. Thus, the present knowledge of NS cooling curves does not allow us to put tighter constraints on the NS age, that would strengthen the association between the remnant and the PWN. The NS temperature of Gaensler et al. (2006) and a putative age 104 yr are in agreement with observational results from other young NSs: PSR J1119-6127 (1.6 kyr) RX J0822-43 (3.7 kyr) 1E 1207-52, and PSR J1357-6429 (7 kyr; Zavlin 2007b, a; Kaminker et al. 2002).
The location of the ring of hot metal-rich plasma in our Fig. 2 and Fig. 4, just around the PWN, is an additional argument in support of the physical connection between the PWN and IC 443. On the plane of the image (see e.g. Fig. 2) only the south side of the PWN seems to be in contact with the reverse shock, suggesting that the PWN may be in the reverse shock or subsonic expansion stage, but not in the high supersonic stage (van der Swaluw et al., 2004). This is consistent with an age of few thousand years, and in rough agreement with the mildly supersonic Mach value found by Gaensler et al. (2006).
The orientation of the cometary tail and the position of the PWN cannot be straightforwardly explained. This mismatch is still an open issue, but it does not precludes the association between the PWN, the ring and the SNR (see also Gaensler et al., 2006). For instance, a similar apparent offset between the stellar remnant, the forward, and the reverse shock geometric centers has been already observed in Cas A (Gotthelf et al., 2001). A possibility is that strong reverse shocks, originated by the interaction with the surrounding clouds, skewed the orientation of the nebula. An asymmetric SN explosion or the presence of strong density gradients across the remnant offer a valid explanation to the observed offsets (Gotthelf et al., 2001; Reed et al., 1995). Another possible explanation is that the SN ejecta have been decelerated by the southern ridge of molecular material, and, as a consequence, the geometric center of the ring appears shifted toward the north direction.
5 Conclusions
We analyzed the hard (1.4-5.0 keV) X-ray emission of the supernova remnant IC 443, as observed by a set of public archive XMM-Newton observations. Unlike the soft X-ray emission, which traces directly the interaction with the surrounding clouds (Troja et al., 2006), the hard X-ray emission has a centrally-peaked morphology, reminiscent of the subclass of mixed morphology SNRs. The presence of a ring-shaped feature, which encircles the PWN, has been revealed in the equivalent width maps of Si and S lines (Fig. 3).
A spatially-resolved spectral analysis confirms that this structure is associated to hot metal rich plasma, whose abundances are consistent with a core-collapse SN origin, but not with an exploding white dwarf. We argue that the ring indicates the location of an ejecta layer heated by the reverse shock, and that the reverse shock has partially hit the PWN. Dynamically, the location of the ejecta ring suggests an age of 4,000 yr for IC 443, an order of magnitude lower than some previous estimates, based on expansion in a very dense environment. A younger age is indeed more consistent with an SNR expansion within wind-blown bubble shells, surrounded by dense clouds, as first suggested by Braun & Strom (1986), and recently considered by Troja et al. (2006).
We detect only marginal evidence of plasma overionization in the NE part of the remnant. The bright hard 1.4–5.0 keV X-ray emission in the NE region of IC 443 also show high temperatures and high metal abundances, as shown in Troja et al. (2006). More detailed results from this region will be reported in a future work.
Acknowledgments
We thank the anonymous referee for his/her insightful comments on this paper. We also thank J. Raymond and R. Chevalier for useful discussions about the optical and the X-ray emission of IC 443, and Richard Owen for his kind help.
FB and MM acknowledge financial contribution from the contract ASI-INAF I/203/05. The software used in this work was in part developed by the DOE-supported ASC / Alliance Center for Astrophysical Thermonuclear Flashes at the University of Chicago. This work makes use of results produced by the PI2S2 Project managed by the Consorzio COMETA, a project co-funded by the Italian Ministry of University and Research (MIUR) within the Piano Operativo Nazionale ”Ricerca Scientifica, Sviluppo Tecnologico, Alta Formazione” (PON 2000-2006). More information is available at http://www.pi2s2.it and http://www.consorzio-cometa.it.
References
- Albert et al. (2007) Albert, J., et al. 2007, ApJ, 664, L87
- Anders & Grevesse (1989) Anders, E. & Grevesse, N. 1989, Geochim. Cosmochim. Acta., 53, 197
- Arnaud (1996) Arnaud, K. A. 1996, in ASP Conf. Ser. 101: Astronomical Data Analysis Software and Systems V, 17–+
- Asaoka & Aschenbach (1994) Asaoka, I. & Aschenbach, B. 1994, A&A, 284, 573
- Badenes et al. (2003) Badenes, C., et al. 2003, ApJ, 593, 358
- Bocchino & Bykov (2000) Bocchino, F. & Bykov, A. M. 2000, A&A, 362, L29
- Bocchino & Bykov (2001) Bocchino, F. & Bykov, A. M. 2001, A&A, 376, 248
- Bocchino & Bykov (2003) Bocchino, F. & Bykov, A. M. 2003, A&A, 400, 203
- Braun & Strom (1986) Braun, R. & Strom, R. G. 1986, A&A, 164, 193
- Burton et al. (1990) Burton, M. G., et al. 1990, ApJ, 355, 197
- Bykov et al. (2005) Bykov, A. M., et al. 2005, ApJ, 624, L41
- Bykov et al. (2008) Bykov, A. M., et al. 2008, ApJ, in press, arXiv: astro-ph/0801.1255, 801
- Cassam-Chenaï et al. (2004) Cassam-Chenaï, G., et al. 2004, A&A, 414, 545
- Chevalier (1999) Chevalier, R. A. 1999, ApJ, 511, 798
- Chu et al. (2003) Chu, Y.-H., et al. 2003, in Revista Mexicana de Astronomia y Astrofisica, vol. 27, Vol. 15, Revista Mexicana de Astronomia y Astrofisica Conference Series, ed. J. Arthur & W. J. Henney, 62–67
- Claussen et al. (1997) Claussen, M. J., et al. 1997, ApJ, 489, 143
- Cornett et al. (1977) Cornett, R. H., et al. 1977, A&A, 54, 889
- Cox et al. (1999) Cox, D. P., et al. 1999, ApJ, 524, 179
- Denoyer (1977) Denoyer, L. K. 1977, ApJ, 212, 416
- Denoyer (1978) Denoyer, L. K. 1978, MNRAS, 183, 187
- Dickel et al. (1989) Dickel, J. R., et al. 1989, AJ, 98, 1363
- Duin & van der Laan (1975) Duin, R. M. & van der Laan, H. 1975, A&A, 40, 111
- Dwarkadas (2005) Dwarkadas, V. V. 2005, ApJ, 630, 892
- Esposito et al. (1996) Esposito, J. A., et al. 1996, Bulletin of the American Astronomical Society, 28, 1346
- Gaensler et al. (2006) Gaensler, B. M., et al. 2006, ApJ, 648, 1037
- Gotthelf et al. (2001) Gotthelf, E. V., et al. 2001, ApJ, 552, L39
- Hewitt et al. (2006) Hewitt, J. W., et al. 2006, ApJ, 652, 1288
- Hoffman et al. (2003) Hoffman, I. M., et al. 2003, ApJ, 583, 272
- Hughes et al. (2003) Hughes, J. P., et al. 2003, ApJ, 582, L95
- Hwang et al. (2000) Hwang, U., et al. 2000, ApJ, 537, L119
- Kaminker et al. (2002) Kaminker, A. D., et al. 2002, A&A, 383, 1076
- Kawasaki et al. (2005) Kawasaki, M., et al. 2005, ApJ, 631, 935
- Kawasaki et al. (2002) Kawasaki, M. T., et al. 2002, ApJ, 572, 897
- Laming & Hwang (2003) Laming, J. M. & Hwang, U. 2003, ApJ, 597, 347
- Lampton et al. (1976) Lampton, M., et al. 1976, ApJ, 208, 177
- Lazendic & Slane (2006) Lazendic, J. S. & Slane, P. O. 2006, ApJ, 647, 350
- Lazendic et al. (2005) Lazendic, J. S., et al. 2005, ApJ, 618, 733
- Leahy (2004) Leahy, D. A. 2004, AJ, 127, 2277
- Mavromatakis et al. (2004) Mavromatakis, F., et al. 2004, A&A, 415, 1051
- Meaburn et al. (1990) Meaburn, J., et al. 1990, A&A, 227, 191
- Miceli et al. (2006) Miceli, M., et al. 2006, A&A, 453, 567
- Neufeld & Yuan (2008) Neufeld, D. & Yuan, Y. 2008, ApJ, in press,arXiv: astro-ph/0801.2141
- Olbert et al. (2001) Olbert, C. M., et al. 2001, ApJ, 554, L205
- Park et al. (2003a) Park, S., et al. 2003a, ApJ, 586, 210
- Park et al. (2004) Park, S., et al. 2004, ApJ, 602, L33
- Park et al. (2003b) Park, S., et al. 2003b, ApJ, 592, L41
- Petre et al. (1988) Petre, R., et al. 1988, ApJ, 335, 215
- Rakowski et al. (2006) Rakowski, C. E., et al. 2006, ApJ, 646, 982
- Reed et al. (1995) Reed, J. E., et al. 1995, ApJ, 440, 706
- Reich et al. (2003) Reich, W., et al. 2003, A&A, 408, 961
- Rho et al. (2001) Rho, J., et al. 2001, ApJ, 547, 885
- Rho & Petre (1998) Rho, J. & Petre, R. 1998, ApJ, 503, L167
- Shelton et al. (1999) Shelton, R. L., et al. 1999, ApJ, 524, 192
- Shelton et al. (2004) Shelton, R. L., et al. 2004, ApJ, 611, 906
- Smith et al. (2001) Smith, R. K., et al. 2001, ApJ, 556, L91
- Snell et al. (2005) Snell, R. L., et al. 2005, ApJ, 620, 758
- Sturner & Dermer (1995) Sturner, S. J. & Dermer, C. D. 1995, A&A, 293, L17
- Thielemann et al. (1996) Thielemann, F.-K., et al. 1996, ApJ, 460, 408
- Troja et al. (2006) Troja, E., et al. 2006, ApJ, 649, 258
- Truelove & McKee (1999) Truelove, J. K. & McKee, C. F. 1999, ApJS, 120, 299
- van der Swaluw et al. (2004) van der Swaluw, E., et al. 2004, A&A, 420, 937
- van Dishoeck et al. (1993) van Dishoeck, E. F., et al. 1993, A&A, 279, 541
- Wang & Chevalier (2002) Wang, C.-Y. & Chevalier, R. A. 2002, ApJ, 574, 155
- Wang et al. (1992) Wang, Z. R., et al. 1992, PASJ, 44, 303
- Willingale et al. (2002) Willingale, R., et al. 2002, A&A, 381, 1039
- Woosley & Weaver (1995) Woosley, S. E. & Weaver, T. A. 1995, ApJS, 101, 181
- Zavlin (2007a) Zavlin, V. E. 2007a, ApJ, 665, L143
- Zavlin (2007b) Zavlin, V. E. 2007b, Ap&SS, 308, 297