The Black Hole Accretion Disk in NGC 4258: One of Nature’s Most Beautiful Dynamical Systems
Abstract
In this talk I will summarize some of the work that the CfA group has done to study the structure of the water masers in the accretion disk of NGC 4258. A series of 18 epochs of VLBA data taken from 1997.3 to 2000.8 were used for this study. The vertical distribution of maser features in the systemic group was found to have a Gaussian distribution, as expected for hydrostatic equilibrium, with a -width of 5.1 as. If the disk is in hydrostatic equilibrium, its temperature is about 600K. The systemic features exhibit a small, but persistent, gradient in acceleration versus impact parameter. This characteristic may indicate the presence of a spiral density wave rotating at sub-Keplerian speed. A more precise understanding of the dynamical properties of the disk is expected to lead to a more refined estimate of the distance to the galaxy.
Harvard-Smithsonian Center for Astrophysics, USA
Please forgive my slightly flamboyant title, it’s really not me, but it reveals a little bit about how enamored I have been with the galaxy NGC 4258 for almost 15 years now since the Nobeyama group (Nakai, Inouye & Miyoshi 1993) first discovered the high velocity maser features in its water vapor spectrum, which are symmetrically placed with respect to the systemic masers and which provide evidence of a rotating disk structure. VLBA measurements were able to confirm that proposal some years later.
There are several reasons why we want to keep hammering away at NGC 4258. Firstly, it is a very beautiful, simple system and there is a lot of physics that we can study in the inner 1 parsec of its accretion disk around its central black hole. Secondly, as Jim Braatz showed in his talk earlier today (Braatz et al. 2008), this is the prototype source, still the flagship example, of a simple, clean megamaser system in a galaxy, so it is a laboratory in which we can study all
the small effects that can affect the usefulness of megamasers as distance indicators. As Braatz mentioned, it’s rather difficult to find masers like NGC 4258: several thousands of galaxies have been surveyed and the total count of megamaser galaxies is now about a hundred. This is about a 5% yield of galaxies searched, possibly because only masers in edge-on accretion disks can be detected. And then, of those hundred, only about 5 percent, four or five, are probably going to be good distance indicators because their geometry can be readily understood. So the yield of galaxies suitable for precise distance measurement is actually quite small so far.
What I want to describe today is the large set of observations that has been analyzed by our group at CfA – Alice Argon, Lincoln Greenhill, Elizabeth Humphreys, myself and Mark Reid. I will also talk about some of the Ph.D. projects of Harvard students over the past decade – Jim Herrnstein originally measured the distance precisely to NGC 4258 and fully characterized the warp of the accretion disk, Adam Trotter refined the warp model, Ann Bragg did an analysis of the maser accelerations with the VLA, and Maryam Modjaz put an upper limit on the Zeeman effect from circular polarization measurements with the GBT, which yielded a limit on the magnetic field strength.
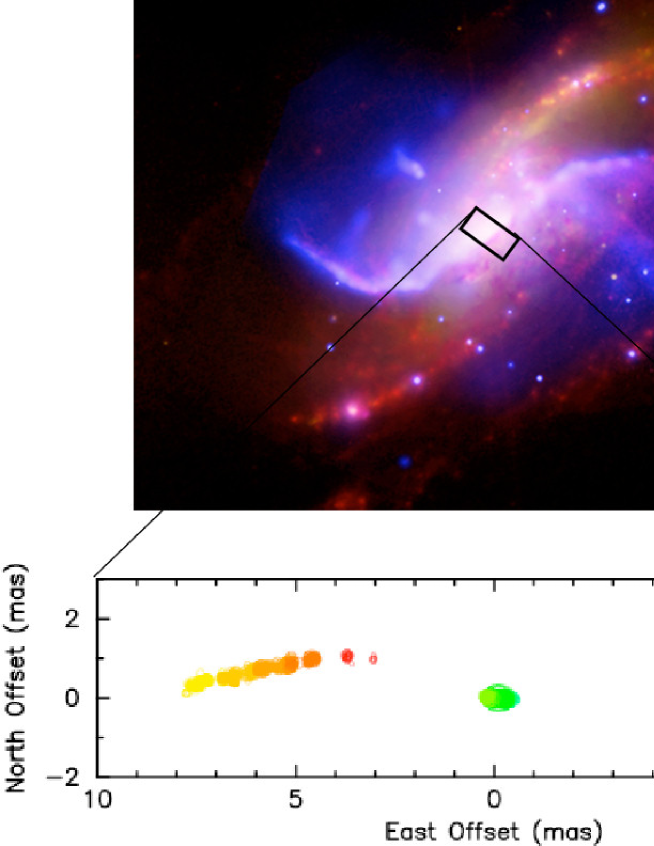
Figure 1 shows a multiwavelength composite image of NGC 4258. In the optical part of the spectrum the galaxy looks like a normal massive spiral galaxy with an indication of a central bar. However, its strong nuclear emission lines led Seyfert (1943) to include it in his original catalog of disturbed galaxies, which became known as Seyfert galaxies. The radio continuum emission, first imaged in high resolution at Westerbork at 1.4 GHz by van der Kruit, Oort & Mathewson (1972), shows a pair of anomalous arms of synchrotron emission, which so intrigued Jan Oort many years ago. In one of the last papers of his career (Oort 1982) he reminisced very insightfully: “One reason why the peculiar phenomena [anomalous arms] that are so striking in NGC 4258 do not occur more often in spirals may be that they can occur only when the axis of ejection (presumably the rotation axis of the central black hole’s accretion disk) is almost perpendicular to the rotation axis of the galaxy.” As we determined in 1995, the angle between the axis of the accretion disk, as defined by the masers, and the rotation axis of the galaxy is about 120∘ (Miyoshi et al. 1995).
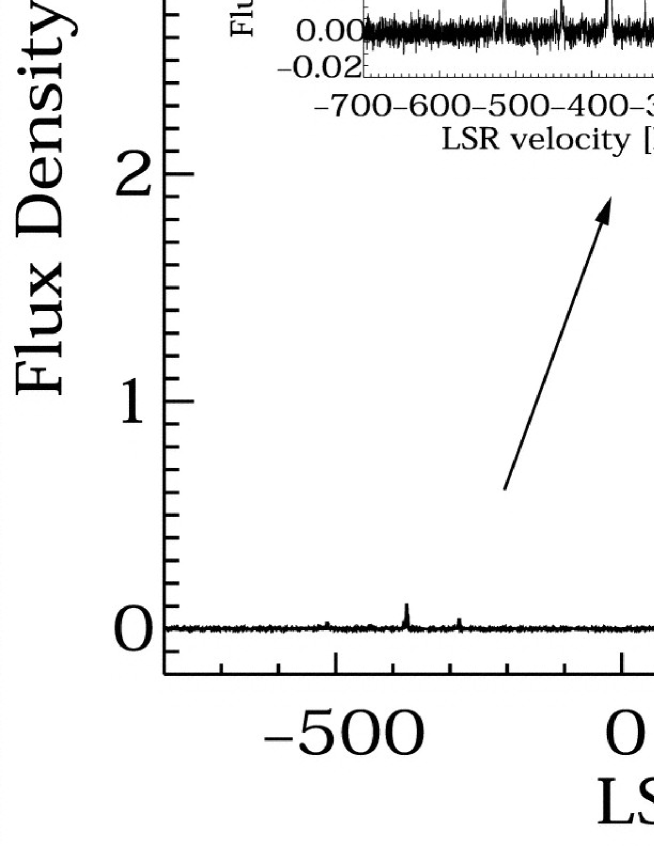
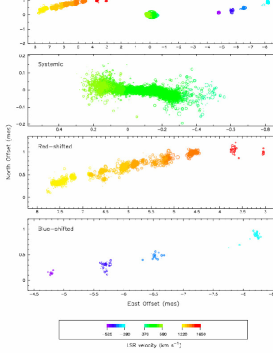
Figure 2 shows a spectrum of our archetypical maser. You see the nicely symmetric bands of features around the galaxy’s systemic velocity of about 500 km s-1: the high redshifted velocity features near 1500 km s-1 and the high blueshifted velocity features near km s-1. Nakai, Inouye & Miyoshi (1993) originally suggested three possible explanations for the origin of this spectral structure: (1) a rotating disk, (2) a bipolar outflow, and (3) a non-kinematic process–stimulated Raman emission. The first direct evidence that rotation was the correct interpretation came from the VLBI observation of the systemic features by Greenhill et al. (1995) from data taken in 1984. One of the first projects executed by the VLBA showed the full distribution of the masers, which clearly defined a disk in Keplerian motion and really captured the imagination of the astronomical community (Miyoshi et al. 1995). As shown in Figure 1, the maser distribution follows a perfect monotonic progression in velocity for each of the three velocity segments indicative of a rotating, slightly warped, Keplerian disk whose diameter is about 0.5 pc. Figure 3, shows an expanded version of the image and the position-velocity (p-v) plot of the masers, which reveals the Keplerian signature.
The VLBA, a wonderfully precise astrometric machine, which works so reliably and has a resolution of 200 as at the water maser frequency of 22 GHz, made these measurements possible. Another important feature of the VLBA is that because it has a very large correlator its spectral resolution is very fine, better than 1 km s-1, which allows resolution of all of the maser spectral features and complete coverage of the spectrum. From 1997 to 2000 we embarked on a very ambitious set of 18 VLBI experiments and have just now gotten all the data published (Argon et al. 2007). Some 14,000 maser features have been detected: 10,039 systemics, 3,979 reds and about 289 blues. There are very few blue features (see Fig. 1) but now we have enough to solve accurately for a kinematic model. These 14,000 features (or velocity channels) are not all distinct maser spots because there are several velocity channels across each line profile and the features show up in multiple epochs. There are probably about a thousand independent maser spots that we have mapped among these epochs. All this data is now online in the paper by Argon et al. (2007) and I invite anyone who would like to look for interesting effects in NGC 4258 to use the archive. Please, feel free to dig in!
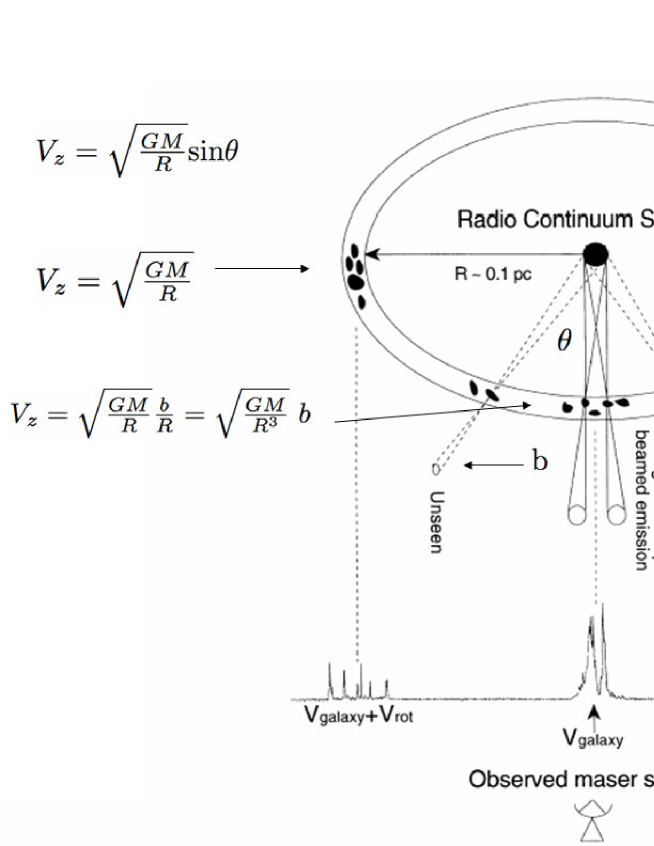
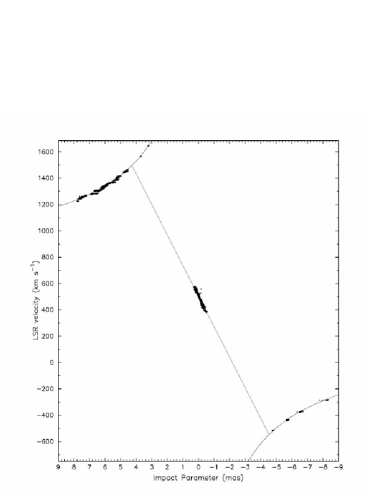
Figure 3 is an ensemble of all the data showing the disk over half of a parsec in diameter in the top panel on the left. The lower panels are blow-ups around the three velocity ranges. Note the narrow waist in the systemic velocity range. The important thing is that the position-velocity diagram in Figure 3 (right) shows a nearly perfect Keplerian disk in the high velocities. The linear part in the center shows that the radial distance of those masers from the nucleus is nearly constant. Figure 4 is a cartoon that we have used for many years to explain the position-velocity characteristics of the masers. The line-of-sight velocity, , in a Keplerian disk viewed edge-on is given by where is the azimuth angle in the disk measured from the line-of-sight to the black hole, is the radial distance from the black hole of mass , and is the gravitational constant. The high-velocity features show a nearly perfect Keplerian curve and therefore they must be at a fixed azimuth angle in the disk. Since the accelerations of these features are small, the azimuth angle is probably close to 90∘, i.e., these features are on the so-called ‘mid-line’ where . Close to the line of sight in front of the black hole where is the impact parameter so . Hence there is a linear relationship between the line-of-sight velocity and the impact parameter for the case where the radius is fixed. This describes the p-v diagram systemic masers very well (see Fig. 3).
It is interesting to note that we observe masers in front of the black hole and at the azimuth angles. The velocity gradient is zero in these directions and that is undoubtedly an important factor in why we see masers in just those directions. We have always been vigilant about looking for masers on the back side of the disk. They would be slightly above the ones in front because of the disk inclination, and would be accelerating in the opposite direction. We have never identified any back-side features.
Inspection of spectra from 1982 onward show that the systemic masers are always confined to a velocity range of about 430 to 530 km s-1. They are like toy soldiers, they first appear near 430 km s-1, march uniformly in velocity at about 8 km s-1 yr-1 until they reach the upper velocity limit of about 530 km s-1 in about 12 years, after which they disappear. We infer from this behavior that the maser emission is beamed towards us with a beam angle of about 8∘, which causes them to be visible to us only in a relatively narrow velocity range corresponding to . If it weren’t for turbulence, we might see the currently visible masers again in about a thousand years when they rotate back into view. All of the masers that we mapped originally in 1995 are gone from our view, and presumably pointing their radiation elsewhere in the universe.
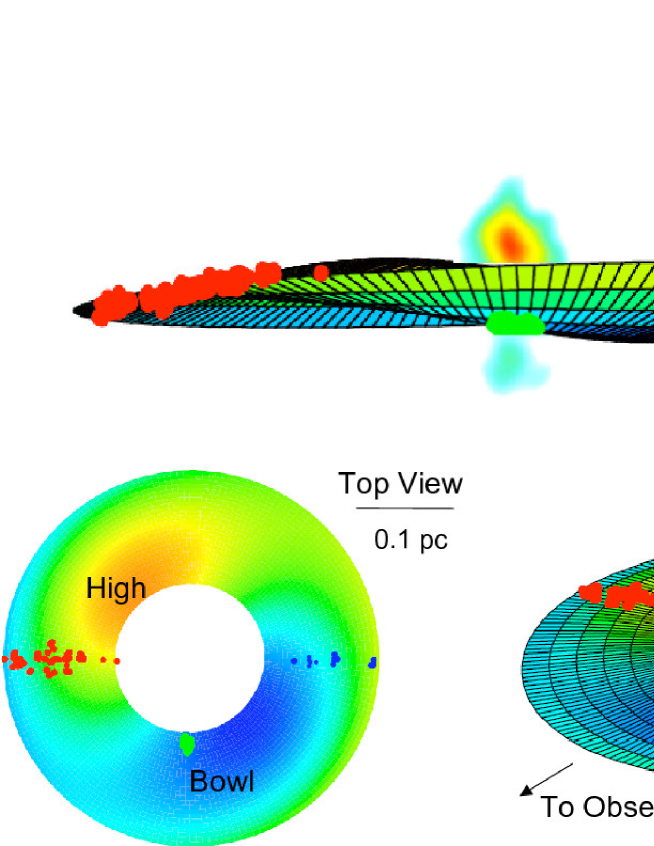
We have been able to characterize the warping of the disk fairly precisely (Herrnstein et al. 2005). Figure 5 shows the disk from several vantage points. The spread in azimuth angles of the red features is inferred because the line-of-sight components of the accelerations are not zero [i.e., ]. The warp is completely characterized by data in one plane – the plane perpendicular to the line-of-sight encompassing the midline. The position-angle warp is obvious in Figure 1. There also seems to be a warp in inclination angle as evidenced by the very slight systematic deviations from Keplerian motion among the high velocity masers. The motion is Keplerian to about a part in a hundred, but there is a systematic deviation in velocity totaling about 9 km s-1, which appears as a flattening of the Keplerian curve and which we interpret as an linear change in inclination angle with radius. The parameters of this warp are given in Herrnstein et al. (2005). They describe a disk that has the characteristic of having a “bowl” in the direction of the observer (see Fig. 5), which probably explains why the systemic features are confined to a narrow annular radius. The warp of the disk could have various causes. Perhaps, most intriguingly, it could be due to interaction of the accretion disk and the spinning black hole if their spin axes are misaligned, i.e., the Bardeen-Peterson effect (Bardeen & Peterson 1975) as suggested by Moran et al. (1999). Recent quantitative calculations by Caproni et al. (2007) and Martin, Pringle, & Tout (2007) show that this effect is quite viable and the critical transition radius is about 0.1 pc, the inner radius of the maser disk.
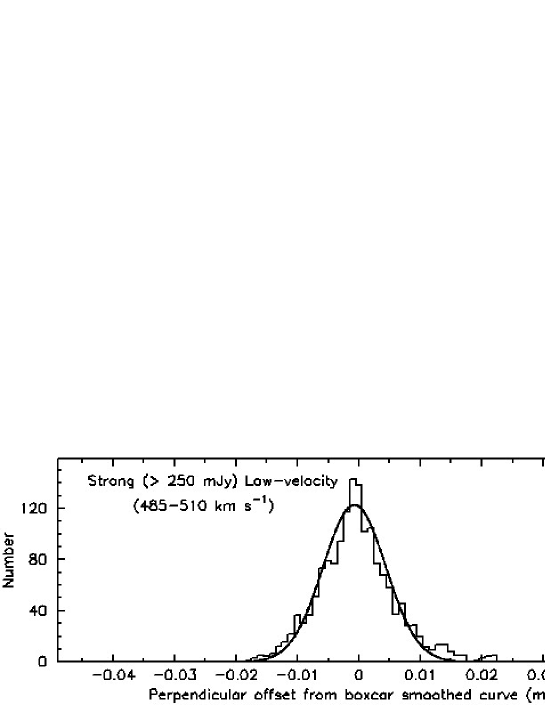
We have always wondered exactly how thick the disk is (e.g. Moran et al. 1995). So, to make this measurement, we have looked right at the sweet spot in the disk at the bottom of the bowl. There, the disk is viewed edge-on and the differences in radial positions in the masers don’t cause a spread in projected vertical distance. We have sorted the vertical positions of the strong masers with respect to the disk and made a histogram of their vertical distribution. The measurement errors in these relative positions are about one as, which is really quite phenomenal. The histogram in Figure 6 shows that the height distribution is nearly a Gaussian function with a -width of about 5 as. If this disk is in hydrostatic equilibrium, we would expect a Gaussian distribution with the width equal to R, the radius of the systemic masers at the bottom of the bowl, times the sound speed divided by the Keplerian velocity , i.e., . In this case, the required sound speed is about 1.5 km s-1 corresponding to a temperature of about 600K. The disk is about 5 as thick at a radius of about 4 mas from the center, so it is really a remarkably thin disk, with a fractional radius of about one part in a thousand, just as simple theory suggests (Frank, King & Raine 2002).
We have also tried to measure the magnetic field in the masers with both the VLA and the GBT via the Zeeman effect (Modjaz et al. 2005). H2O is a non-paramagnetic molecule so the Zeeman effect is not very sensitive to the magnetic field. We determined a limit on the toroidal component of the magnetic field of about 30 milligauss. The total magnetic field is probably less than about 100 milligauss. This means that the total magnetic support of the disk is probably less than the thermal support but it would be interesting to pursue this a bit further and actually detect the Zeeman effect. For a magnetic field of about 100 milligauss and with the assumption of equipartition of energy, a very stringent limit can be set on the mass accretion rate of about solar masses per year, which is interestingly low.
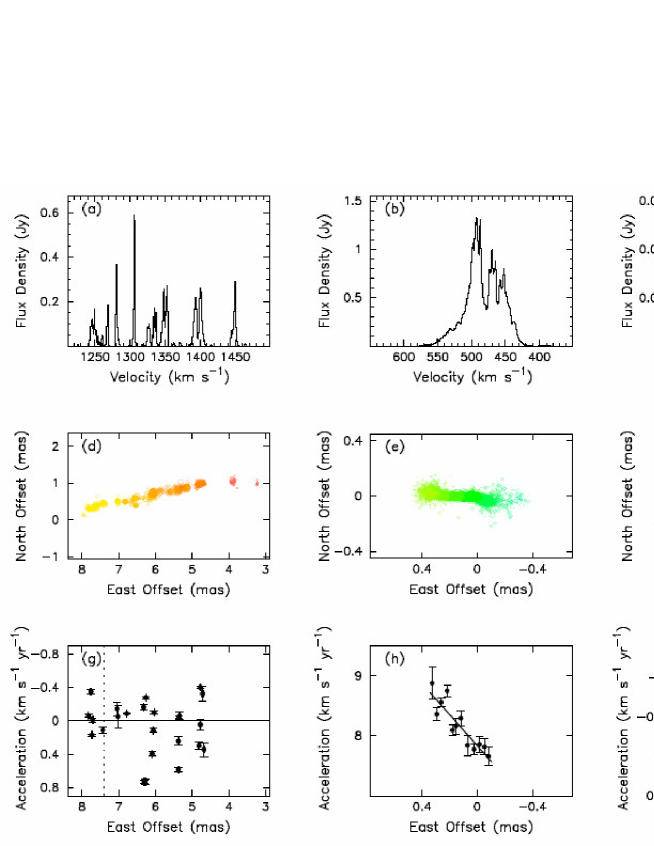
Getting back to looking at the structure of the disk, Figure 7 shows the velocities, positions and accelerations of all of the features we have measured over the 18 epochs. The “Watson notch” (Watson & Wallin 1994) has also persisted over all these years: there is always a dip near 472 km s-1 (see Fig. 7, panel b) which some of us think may be an enduring characteristic of the systemic group. They hypothesized that there is an absorbing layer of water farther out in the disk that absorbs at the rest frequency of the galaxy. Maoz originally proposed in 1995 (Maoz 1995) that there seemed to be a spatial periodicity among the high velocity features. We were originally skeptical of this interpretation, but the periodicity has persisted and is more evident than ever (see Fig. 7, panels a, d, c and f). There seems to be a missing feature in the gap at 330 km s-1 (see Fig. 7, panel f), but we took a very sensitive spectrum with the GBT recently and found some masers right in this spot! So the spatial periodicity seems to be real and there probably is some spiral structure in this disk.
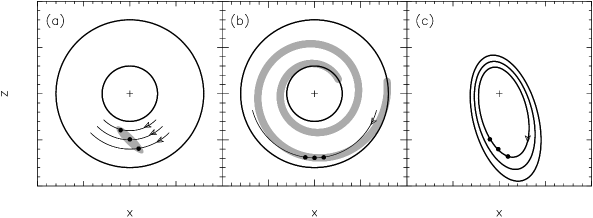
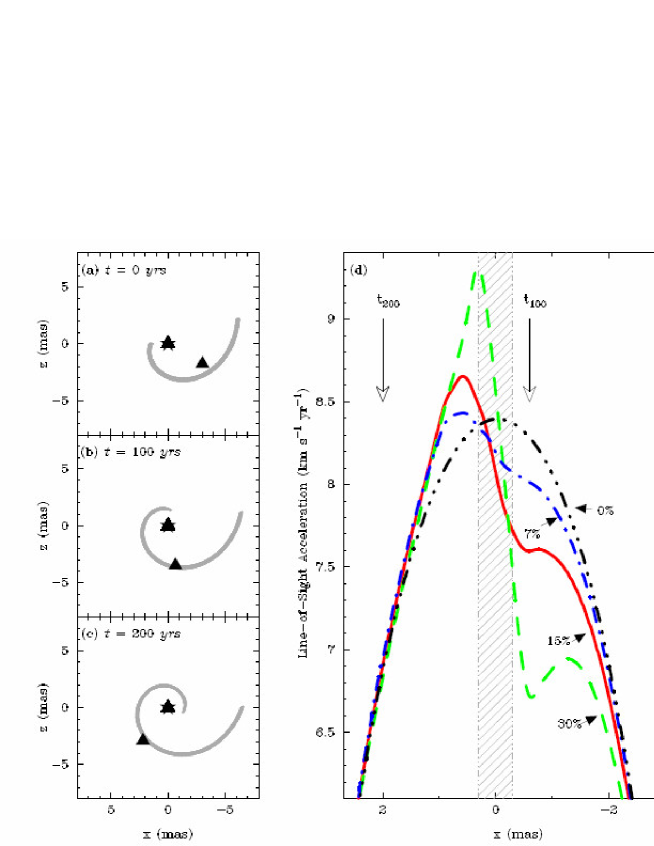
It is interesting that the systemic masers drift at 8 km s-1 yr-1 in the mean but there is actually a slight variation across the face of the disk (see Fig. 7, panel h). This is perhaps a little bit unsettling. The simplest explanation for this change in acceleration is that the features actually lie at slightly different radii, so you can map acceleration into radius by the relation so a 10% variation in the acceleration gives about a 5 percent variation in the annular radial distance of the masers. We looked at some of the old published data (see Humphreys et al. 2008) and this characteristic has been noticeable since the 1980s. It seems to be a stationary pattern that persists in the disk and does not move with the rotation of the galaxy. Figure 8 shows three possible explanations for this persistent acceleration slope. The simplest explanation, depicted in panel (a), is that the disk has a structure, e.g., a bump or tangent locus, that is stationary or rotates much slower than the Keplerian rotation. We see masers only from gas that flows through this special region. Alternatively, (panel b) there may be massive spiral arm which causes a real acceleration effect as the maser blobs move through it. So for example in Figure 9, if the “star” symbol is the black hole and the curved arc is the spiral arm moving at half the rotation speed, a maser (triangle) coming onto the spiral arm will be accelerated towards that spiral arm with an extra acceleration in addition to the Keplerian acceleration. The right panel shows accelerations for various values of disk mass. For seven percent of the maximum disk mass that’s allowed by the Keplerian curve (about 1% of the black hole mass), the acceleration trend across the observable range of mas matches the observations. Over a long time this acceleration profile would shift and allow the pattern speed of the spiral arm to be determined. A third explanation (Fig. 8, panel c) for the acceleration anomaly is that the orbits are slightly elliptical.
The high velocity features have accelerations that have been very accurately measured. The features are all separated in velocity and we can measure the drift in velocity with time very accurately. Each of the accelerations are precisely known but are scattered rather randomly (see Fig. 7, panels g and j). We interpret this as the features being ahead or behind of the mid-plane exactly at 90∘ to us, where they would have zero accelerations. They have accelerations of about 0.5 km s-1 yr-1 with respect to the systemic value of 8 km s-1 yr-1 so they are a few degrees off the mid-line. There is a theory by Maoz & McKee (1998) suggesting that these accelerations are really due to a phase effect in the masers. If there is a spiral arm passing through the disk, the accompanying shock wave may change the point of maser excitation along the mid-line where the velocity gradient is zero. This will move the site of an emission spot outward and to lower absolute velocity on the Keplerian curve. We see no evidence of this. It should have been a small effect of about 0.05 km s-1 yr-1. If it’s there, it is completely buried in the real geometric dispersion of features.
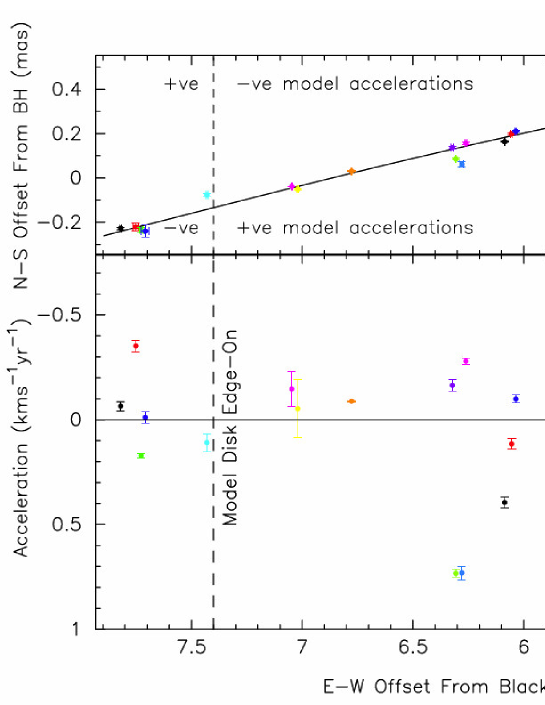
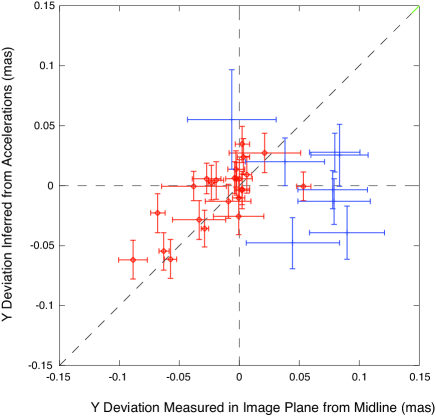
Figure 10 is a blow-up of the redshifted side of the disk. It shows the disk model fit through the maser points 4 to 8 mas from the black hole with the vertical position deviations from the disk in the upper panel and the accelerations in the lower. There is a high correlation between the accelerations of the features and their offsets from the disk. Figure 11 plots the deviations in the image versus the deviations that we would expect if we assume that the accelerations are caused by the azimuths not being exactly 90∘. If our warp model is correct, then there should be a good correlation. I draw your attention to the red features, which show a very highly correlated between these two estimates of the offset from the disk plane. The blue features are not so well correlated because the red features were used to determine the warp characteristics. The importance of Figure 11 is that it shows that the geometric model of a warped disk with masers being density enhanced blobs that physically move and can be used as dynamical tracers is largely correct. This result is reassuring for the dynamical interpretation of the maser data.
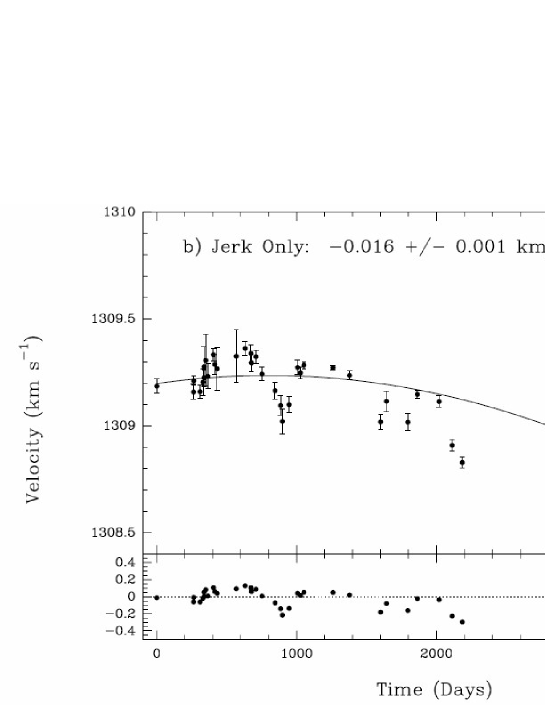
And for my younger colleagues in the audience, I show in Figure 12 how we have tracked one particular high-velocity feature for twelve years. We have mostly been fitting straight lines to the velocity data to estimate the acceleration, but the velocity should actually follow a thousand-year sinusoid. The line in the figure leads the eye a little deceptively, but we may actually just be seeing a bit of that sine wave. Its maximum corresponds to the time that the maser is going through the line perpendicular to the line of sight, i.e., crossing the mid-line. So this plot will get better quadratically with time, and can be expected to show whether the geometric model of the maser is correct.
Finally, let me bring you up to date on the distance measurements of NGC 4258. We announced a distance in 1999 of Mpc with statistical error of Mpc and a systematic error of Mpc (Herrnstein et al. 1999). The systematic error was largely due to uncertainty in the departure of the orbits from circularity. If the orbits are slightly elliptical, that could bias the distance. Several groups have been looking at the Cepheid variables in NGC 4258 with the Hubble telescope and the distance from those has been estimated as Mpc (Maoz et al. 1999), Mpc (Newman et al. 2001) and last year with a more extensive experiment the Cepheid distance is now Mpc (Macri et al. 2006). There is now really quite good agreement between the Cepheid distance and the maser geometric distance. The Cepheid distances given above are based on the distance to the Large Magellanic Cloud of 50 kpc, so one way of eliminating this small discrepancy between the maser and Cepheid distances would be to bring the Large Magellanic Cloud closer to us from 50 kpc by the ratio of 7.2/7.5.
Discussion
Unknown: How can you rule out that the actual disk is thicker than where the masers are occurring?
Moran: It is quite possible that the actual disk is thicker than the maser layer indicates. My colleague Ramesh Narayan used to ask me this question frequently. His idea was that the masers are just a thin skin on a thicker accretion disk. This would make the accretion rate much higher than indicated by the thickness of the maser layer. I would like to appeal to Occam’s razor that the simple explanation is that the maser trace the true disk. We could possibly test the skin hypothesis when we get better data because you might think that the maser skin would be on the top on the redshifted side and on the bottom on the blueshifted side so when you try to fit a model you would see a discontinuity. But this step would be very small.
Kulkarni: How long do individual maser features last?
Moran: We don’t know how long they last. Some have a lifetime of only a few years, but some high velocity features have been there since we first saw them in 1992. The systemic masers don’t last much more than ten years. It may be a rather turbulent medium and these blobs that produce the masers may come and go.
Cordes: What’s the gain of the masers that amplify the AGN?
Moran: It is rather controversial as to whether the systemic masers actually amplify the AGN emission or not. The brightness temperatures of the masers aren’t known because we don’t resolve them but they must be at least K and the AGN can’t be brighter than K so the gain is probably at least 100, and probably much higher. The high velocity masers have no apparent background sources to amplify so their gain must be considerably higher.
Acknowledgement. I thank Alan Bridle for doing his editorial job very well, and Liz Humphreys for discussions and help with the figures.
References
- Argon et al. (2007) Argon, A.L., Greenhill, L.J., Reid, M.J., Moran, J.M., & Humphreys, E.M.L. 2007, ApJ, 659, 1040
- Bardeen & Peterson (1975) Bardeen, J.M. & Petterson, J.A. 1975, ApJ, 195, L65
- Braatz et al. (2008) Braatz, J.A. et al. 2008, in ASP Conf. Ser., this volume.
- Caproni et al. (2007) Caproni, A., Abraham, Z., Livio, M, & Mosquera Cuesta, H.J. 2007, MNRAS, 379, 135
- Frank, King & Raine (2002) Frank, J., King, A., & Raine, D. 2002, Accretion Power in Astrophysics, 3rd edn. (UK: Cambridge U. Press).
- Greenhill et al. (1995) Greenhill, L.J., Jiang, D.R., Moran, J.M., Reid, M.J., Lo, K.Y., & Claussen, M.J. 1995, ApJ, 440, 619
- Herrnstein et al. (1999) Herrnstein, J.R., Moran, J.M., Greenhill, L.J., Diamond, P.J., Inoue, M., Nakai, N., Miyoshi, M., Henkel, C., & Riess, A. 1999, Nat, 400, 539
- Herrnstein et al. (2005) Herrnstein, J.R., Moran, J.M., Greenhill, L.J., & Trotter, A.S. 2005, ApJ, 629, 719
- Humphreys et al. (2008) Humphreys, E.M.L., Reid, M.J., Greenhill, L.J., Moran, J.M., & Argon, A.L. 2008, ApJ, 672, 800
- Macri et al. (2006) Macri, L.M., Stanek, K.Z., Bersier, D., Greenhill, L.J., & Reid, M.J. 2006, ApJ, 652, 1133
- Maoz (1995) Maoz, E. 1995, ApJ, 455, L131
- Maoz & McKee (1998) Maoz, E., & McKee, C.F. 1998, ApJ, 494, 21
- Maoz et al. (1999) Maoz, E., Newman, J.A., Ferrarese, L., Stetson, P.B., Zepf, S.E., Davis, M., Freedman, W.L., & Madore, B.F. 1999, Nat, 401, 351
- Martin, Pringle, & Tout (2007) Martin, R.G., Pringle, J.E., & Tout, C.A. 2007, MNRAS, 381, 1617
- Miyoshi et al. (1995) Miyoshi, M., Moran, J.M., Herrnstein, J.R., Greenhill, L.J., Nakai, N., Diamond, P.J., & Inoue, M. 1995, Nat, 373, 127
- Modjaz et al. (2005) Modjaz, M., Moran, J.M., Kondratko, P.T., & Greenhill, L.J. 2005, ApJ, 626, 104
- Moran et al. (1995) Moran, J., Greenhill, L., Herrnstein, J., Diamond, P., Miyoshi, M., Nakai, N., & Inoue, M. 1995, Proceedings of the National Academy of Science, 92, 11427
- Moran et al. (1999) Moran, J.M., Greenhill, L.J., & Herrnstein, J.R. 1999, J. Astron. Astrophys., 20, 165
- Nakai, Inouye & Miyoshi (1993) Nakai, N., Inoue, M., & Miyoshi, M. 1993, Nat, 361, 45
- Newman et al. (2001) Newman, J. A., Ferrarese, L., Stetson, P. B., Maoz, E., Zepf, S. E., Davis, M., Freedman, W. L., & Madore, B. F. 2001, ApJ, 553, 562
- Oort (1982) Oort, J.H. 1982, in Extragalactic Radio Sources, eds. D.S. Heeschen & C.M. Wade, IAU Symposium, 97, 1
- Seyfert (1943) Seyfert, C. 1943, ApJ, 97, 28
- van der Kruit, Oort & Mathewson (1972) van der Kruit, P. C., Oort, J. H., & Mathewson, D. S. 1972, A&A, 21, 169
- Watson & Wallin (1994) Watson, W.D., & Wallin, B.K. 1994, ApJ, 432, L35
- Yang et al. (2007) Yang, T., Li, B., Wilson, A.S., & Reynolds, C.S. 2007, ApJ, 660, 1106