Morphologies and kinetics of a dewetting ultrathin solid film
Abstract
The surface evolution model based on geometric partial differential equation is used to numerically study the kinetics of dewetting and dynamic morphologies for the localized pinhole defect in the surface of the ultrathin solid film with the strongly anisotropic surface energy. Depending on parameters such as the initial depth and width of the pinole, the strength of the attractive substrate potential and the strength of the surface energy anisotropy, the pinhole may either extend to the substrate and thus rupture the film, or evolve to the quasiequilibrium shape while the rest of the film surface undergoes phase separation into a hill-and-valley structure followed by coarsening. Overhanging (non-graph) morphologies are possible for deep, narrow (slit-like) pinholes.
pacs:
68.55.-aI. INTRODUCTION
Recent experiments YZSLLHL ; SECS with the sub-10nm silicon-on-insulator films at 800-900 ∘C demonstrate Si film dewetting caused by the long-range film-substrate interactions (which are also called wetting interactions). The mass transport in this system is by thermally-activated surface diffusion, and there is no stress at the film-substrate interface due to an absence of a lattice mismatch between the film and the SiO2 substrate. Dewetting starts at randomly distributed pinhole defects in the Si planar surface. The pinholes may exist prior to the annealing, or they form shortly after the temperature is raised. Conditions favoring pinhole deepening over contraction, where the latter is caused by minimization of the surface area due to the mean surface energy (tension), and the kinetics of the pinhole and its dynamic shape are not presently known. Besides, in contrast to liquids, the surface energy of solid surfaces is strongly anisotropic, leading to missing orientations in the dynamic or equilibrium surface shape Wulff -Bonzel_physrep and faceting instability LiuMetiu - WORD . These factors are certain to affect the dynamics of the pinhole and moreover, through the nonlinear competition with the attractive wetting potential may lead to the emergence of an equilibria and thus to the suppression of the film dewetting and rupture.
In Ref. Dwt1 , following Ref. GLSD , the partial differential equation (PDE)-based model is developed which allows to predict the wavelength of the fastest growing cosine-like perturbation of the film surface (also called the normal perturbation), assuming surface diffusion and the two-layer wetting potential ORS -BrianWet . The model also enables computation of the dynamical (and probably faceted) morphologies. Such computations are performed for the normal perturbation and they demonstrate the stabilizing impact of the surface energy anisotropy on dewetting dynamics. The model can in principle support any reasonable form of the wetting potential SZ ; Chiu but the corresponding contribution to the governing PDE for the film thickness must be rederived.
In this paper, using the model of Ref. Dwt1 , the kinetics and morphologies are computed systematically for the localized surface defect from the full nonlinear PDE. As has been made clear above, real surface defects are necessarily localized. We compute for different widths and depths of the pinhole and, for all other model parameters fixed, observe very different dynamics and dewetting outcomes. We also relax the assumption made in Ref. Dwt1 that the surface height above the substrate is described by a function (i.e., a one-dimensional (1D) surface is nonoverhanging) and reformulate the model in terms of two parametric PDEs. This allows to compute, say, beyond the surface phase separation LiuMetiu ; SG into orientations and for some surface energy anisotropies. Asymmetric morphologies and different kinetics may arise when the direction of the maximum surface energy is not the reference direction for the shape evolution (i.e., for instance, the -axis perpendicular to the substrate), which is often the case. Thus we incorporate such misorientation in the model. Note that parametric formulations of the geometric surface evolution laws are common, see for instance Refs. BKL ; HLS ; KBM .
II. PROBLEM STATEMENT
A 2D film with the free 1D parametric surface is assumed, where and are the Cartesian coordinates of a point on a surface, is time and is the parameter along the surface. The origin of a Cartesian reference frame is on the substrate, and along the substrate (-direction, or the [10] crystalline direction) the film is assumed infinite. The -axis is along the [01] crystalline direction, which is normal to the substrate. Marker particles are used to track the surface evolution (see Ref. Trygg , for instance) thus and in fact represent the coordinates of a marker particle, which are governed by two coupled parabolic PDEs Sethian1 ; Sethian2 ; BKL ; HLS :
| (1a) | |||||
| (1b) | |||||
Here the subscripts and denote differentiation, is the normal velocity of the surface which incorporates the physics of the problem, and is the metric function (where is the arclength).
The normal velocity of the surface is due to gradients of the surface chemical potential , which drive the mass flux of adatoms along the surface. In other words, redistribution of adatoms along the surface changes its shape, which is equivalent to the surface moving in the normal direction MULLINS5759 ; MULLINS_Metals ; TCH94 . The chemical potential is the sum of two contributions, , where is the regular contribution due to the surface mean curvature , and is the wetting chemical potential GLSD ; LGDV ; Dwt1 :
| (2) |
Here is the atomic volume, is the angle that the unit surface normal makes with the [01] crystalline direction, is the surface energy of the substrate in the absence of the film, is the characteristic wetting length, and is the primary part of the anisotropic surface energy of the film, i.e. for typical four-fold anisotropy
| (3) |
In Eq. (3) is the mean value of the surface energy, determines the degree of anisotropy, is the misorientation angle and is the small non-negative regularization parameter having units of energy. The -term in Eq. (3) makes the evolution equations (1) mathematically well-posed for strong anisotropy AG - Brian_regular , LiuMetiu ; SG ; GoDaNe98 . (The anisotropy is weak when and strong when . in the former case.) The surface energy has a maximum at , i.e. at . For , this direction is the -axis.
The curvature contribution to is GLSD ; LGDV ; Dwt1
| (4) |
where the subscript denotes differentiation with respect to the arclength. If the wetting potential is zero (), this reduces to familiar strongly anisotropic form LiuMetiu ; SG ; GoDaNe98 .
Finally,
| (5) |
and
| (6) |
where is the adatoms diffusivity, the adatoms surface density, the Boltzmann constant and the absolute temperature. The only differences of this formulation from the formulation in Ref. Dwt1 , except for accounting for the surface energy misorientation in Eq. (3) and the parametric representation, are that in , the wetting (exponential) contributions are accounted for in full (that is, the approximation in the form of averaging across the film thickness is not employed) and the regularization term is not included in . ( does not contain the surface stiffness and thus it does not make the PDE ill-posed for strong anisotropy. Besides, the regularization contribution to is vanishingly small for large surface slopes due to its proportionality to Dwt1 ).
To nondimensionalize the problem, the thickness of the planar undisturbed film, , is chosen as the length scale, and as the time scale. Also, let . The dimensionless problem is comprised of Eq. (5) and Eqs. (1) (where differentiations are with respect to the dimensionless variables), and where
| (7a) | |||||
| (7b) | |||||
| (7c) | |||||
| (7d) | |||||
In Eqs. (7) and . For the computational method, using the relation between and ,
| (8) |
the problem is written entirely in terms of the independent variables and (not shown).
In the simulations reported below, the following values of the physical parameters are used: cm2/s, cm3, erg/cm2, erg/cm2, cm-2, erg, cm, and erg. These values translate into , and (or zero). In this paper we consider strong anisotropy, and .
The initial condition in all runs is the Gaussian surface
| (9) |
where and are the depth and the “width” of the pinhole at , respectively (see Figure 4). The length of the computational domain equals to ten times the unperturbed film thickness, and the defect is positioned at the center of the domain. We use values , which correspond to shallow and deep pinhole at , respectively, and (narrow pinhole), (intermediate pinhole) and (wide pinhole).
The method of lines is used for the computation with the periodic boundary conditions at . Eqs. (1) are discretized by second-order finite differences on a spatially-uniform grid in . The integration in time of the resulting coupled system of the ordinary differential equations is done using the implicit Runge-Kutta method. Initially , but periodically (usually after every few tens of the time steps) the surface is reparametrized so that becomes the arclength, and the positions of the marker particles are recomputed accordingly. This prevents marker particles from coming too close or too far apart in the course of surface evolution.
III. RESULTS
A. Kinetics
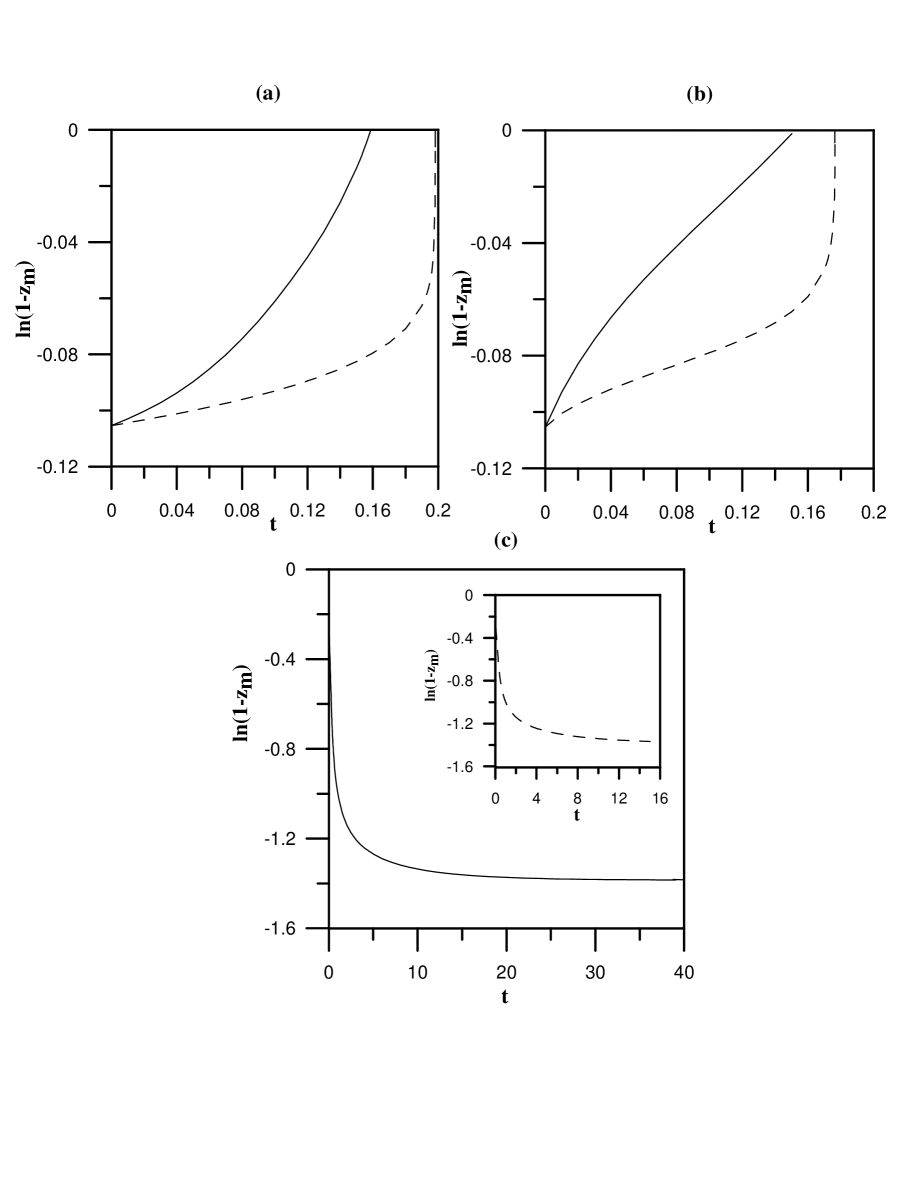
Figures 1 and 2 show the log-normal plots of the pinhole depth vs time, for and , respectively. is the height of the surface at the tip of the pinhole.
Wide and intermediate deep pinholes dewet but the depth of the narrow deep pinhole decreases until it reaches quasiequilibrium at (Figure 1). Quasiequilibrium means that (or, equivalently, the depth) changes very slow or not at all, while the rest of the shape may change relatively fast. Correspondingly, we will call the surface shape at the time when the quasiequilibrium depth is attained, the quasiequilibrium shape. (Again, this shape is changing, but the height of its minimum point (the tip) is not changing, or is changing very slow). Also notice in Figures 1(a) and 1(b) that the growth rate at the rupture time is finite for but infinite (or extremely large) for , and the time to rupture is somewhat less for . However, from Figure 1(c), the time to reach quasiequilibrium is about ten times larger for than for .
As can be seen in Figure 2, only the wide shallow pinhole dewets, and only when . In all other cases of and (except , shown by the solid line in Figure 2(b)) the quasiequilibrium is achieved. For , the depth is initially a non-monotonic function of time, but after the transient phase it monotonically and slowly decreases without reaching the quasiequilibrium (we computed for ). Also, one can see that for the depth at quasiequilibrium decreases as decreases, and it takes less time to reach quasiequilibrium as decreases.
In Figure 3 the dewetting kinetics is compared for several misorientations and strengths of the anisotropy. Shown is the case of the deep, wide pinhole and . The time to rupture increases insignificantly with the decrease of anisotropy or with the increase of the misorientation angle. The faster dewetting for stronger anisotropy here can be attributed to the initial faster shape changes due to larger gradients of , i.e. before the surface orientation falls into an unstable (spinodal) range and faceting steps in, and to the proximity of the pinhole tip to the substrate. That the misorientation slows the kinetics is well-known, for instance Liu & Metiu LiuMetiu in their important study of faceting call the similar situation an “off-critical quench”, and find that at sufficiently large misorientations the “crystal surface will not phase-separate spontaneously, but will have to overcome a finite free-energy barrier”.
B. Morphologies
Figure 4 shows the initial and the final surface shapes of the initially deep pinhole for the three values of . The kinetics of the corresponding dynamical shapes is shown in Figures 1(a)-(c) by solid lines and has been discussed above. Dewetting of the wide and intermediate pinholes proceeds through the extension of the tip of the pinhole until it reaches the substrate at . The quasiequilibrium shape for the narrow pinhole is very similar to the one shown in Figure 5(c). The latter shape is discussed in more details below. While evolving from the initial slit-like shape to the quasiequilibrium shape, the surface of the narrow pinhole overhangs, until it slowly returns to the non-overhanging shape later (Figure 5). In the time interval where the overhanging takes place, the surface slope is large and non-analytic.
Surface shapes for the initially shallow pinhole are shown in Figure 6. Characteristic of these shapes is emergence of the hill-and-valley structure HERRING1 , which becomes possible even when the film dewets (case of the wide pinhole in Figure 6(a)) due to larger time required to reach the substrate in this case. The angle at rupture is . Figure 6(b) shows coarsening of the structure for the intermediate width case. As has been pointed out above at the discussion of Figure 2(b), in this case there is no quasiequilibrium (at least until ), and the tip recedes towards the unperturbed height . Note that the apparent recession rate is slower than the overall coarsening rate. is the time when the two pyramidal structures appear on the film surface. The slope of their walls is shown in the inset and it is almost constant in each of the four characteristic intervals of , with each interval corresponding to a facet. For the walls (facets) become more straight and the graph of becomes nearly constant in each of the four characteristic intervals. Figure 6(c) shows the quasiequilibrium shape for the narrow pinhole. Formation of the hill-and-valley structure followed by coarsening continues for , as is evidenced by the surface slope shown in the inset at the left, but the pinhole depth at is constant. (In fact, the difference of depths at and at is 0.007.) Note that formation of the hill-and-valley structure, its coarsening and slope selection have been the subject of many papers, see for instance Refs. LiuMetiu -WORD , Chiu , GLSD ; LGDV , ORS , SP -Kohn . (Refs. GLSD ; LGDV ; ORS discuss impacts of wetting interactions). Since in this paper we are interested in characterizing dewetting and rupture, we do not further pursue that direction.
Finally, Figure 7 demonstrates impacts of misorientation () on morphology. As expected, asymmetrical shapes emerge for . While the wide, shallow pinhole dewets, only its right sidewall undergoes the phase separation into a hill-and-valley structure. Kinetics is very similar to the case , see Figure 2(a).
IV. DISCUSSION
In this paper a fully nonlinear model is used to compute the complex scenarios of dewetting/equilibration for a localized pinhole defect in the surface of strongly anisotropic thin solid film, assuming the two-layer wetting potential and zero lattice mismatch with the substrate.
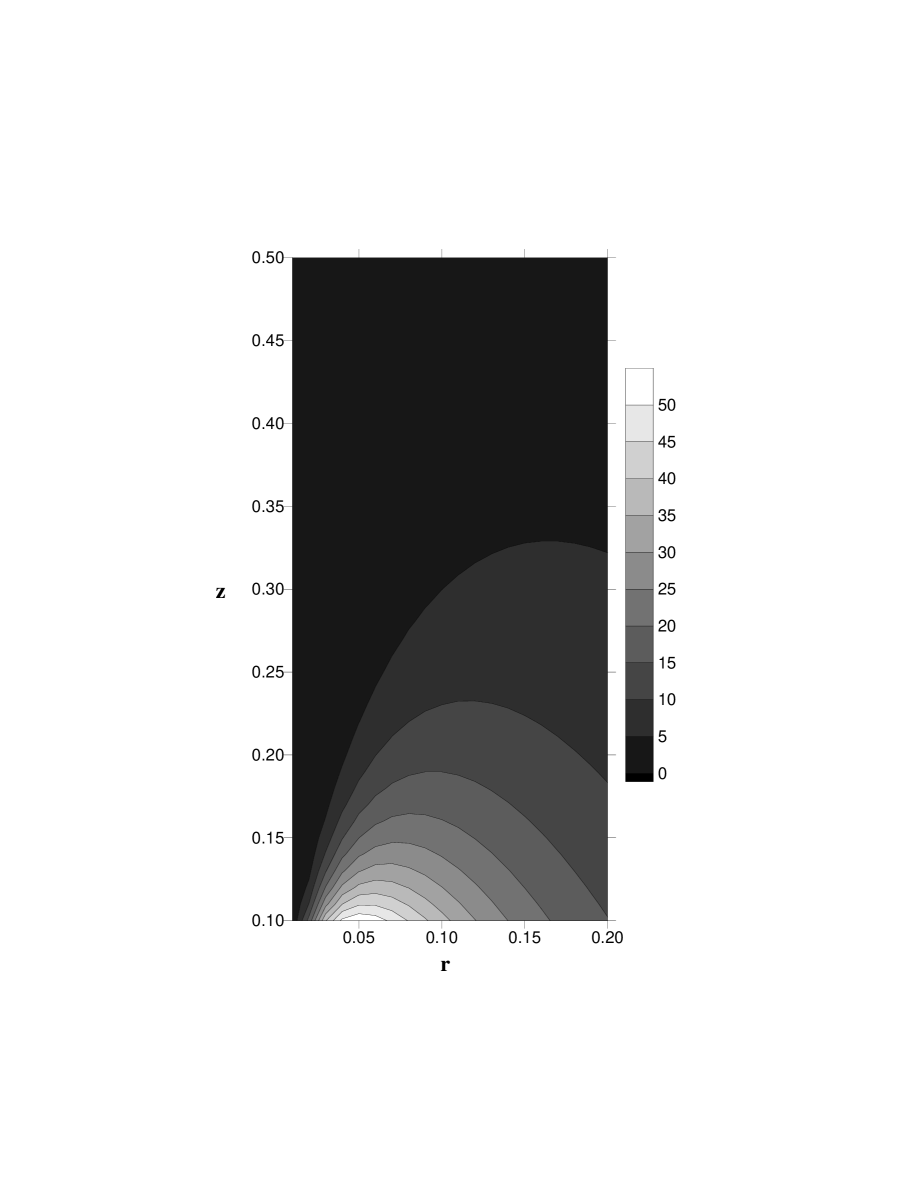
The computed dewetting kinetics can be explained at large using the magnitude of the dewetting factor. In Ref. Dwt1 it was shown that the dominant dewetting terms in the mass-conservation evolution PDE are proportional to (for ). This is plotted in Figure 8. One can see that for the maximum of this factor occurs for small values of the film thickness. This explains why all but one initial conditions in Figure 1 (deep pinhole) lead to pinhole depth increase until the film dewets, while all but one initial conditions in Figure 2 lead to decreasing pinhole depth. The dewetting factor can also explain the small (large) difference in characteristic time scales for and in Figure 1(a) (2(a)). Indeed, for the case of Figure 1(a) the factor is 36.8 () and 16.8 () vs, respectively, 0.7 and for the case of Figure 2(a). Evolution of the film also depends strongly on the film shape and whether is in the unstable range. When it is, as in the cases shown in Figures 4-7 then, the faceting instability is energetically more favorable than dewetting and most often the competition of the two processes causes the unusual hill-and-valley structure where shallow pinhole remains despite the structure coarsening (which takes place separately at both shoulders of the pinhole). Note that the faceting instability seems to be always initiated where the surface changes from horizontal to a sidewall (regions A and B in Figure 4).
We also point out that in our computations the pinhole tip is always nonfaceted at rupture (see Figures 6(a) and 7(a)). In fact, dewetting ceases if the facet spreads to the tip. Also, if the pinhole is not too deep (Figure 4), then the contact angle with the substrate at rupture is . In reality, after the contact this value decreases in order to minimize the total energy of the surface-substrate system YZSLLHL .
ACKNOWLEDGMENT
I thank Brian J. Spencer for the discussion and a few important ideas.
References
- (1) B. Yang, P. Zhang, D.E. Savage, M.G. Lagally, G.-H. Lu, M. Huang, and F. Liu, Phys. Rev. B 72, 235413 (2005).
- (2) P. Sutter, W. Ernst, Y.S. Choi, and E. Sutter, Appl. Phys. Lett. 88, 141924 (2006).
- (3) G. Wulff, Z. Kristallogr. 34, 449 (1901).
- (4) C. Herring, in Structure and Properties of Solid Surfaces, edited by R. Gomer and C.S. Smith (Univ. Chicago Press, Chicago, 1953) pp. 5-81.
- (5) C. Herring, Phys. Rev. 82, 87 (1951).
- (6) H.P. Bonzel and E.Preuss, Surface Science 336, 209 (1995).
- (7) H.P. Bonzel, Phys. Reports 385, 1 (2003).
- (8) F. Liu and H. Metiu, Phys. Rev. B 48, 5808 (1993).
- (9) J. Stewart and N. Goldenfeld, Phys. Rev. A 46, 6505 (1992).
- (10) D.G. Vlachos, L.D. Schmidt, and R. Aris, Phys. Rev. B 47, 4896 (1993).
- (11) A.A. Golovin, S.H. Davis, and A.A. Nepomnyashchy, Physica D 122, 202 (1998).
- (12) A.A. Golovin, S.H. Davis, and A.A. Nepomnyashchy, Phys. Rev. E 59, 803 (1999).
- (13) T.V. Savina, A.A. Golovin, S.H. Davis, A.A. Nepomnyashchy, and P.W. Voorhees, Phys. Rev. E 67, 021606 (2003).
- (14) J.J. Eggleston, G.B. McFadden, and P.W. Voorhees, Physica D 150, 91 (2001).
- (15) S.J. Watson, F. Otto, B.Y. Rubinstein, and S.H. Davis, Physica D 178, 127 (2003).
- (16) M. Khenner, Phys. Rev. B 77, 165414 (2008).
- (17) M. Ortiz, E.A. Repetto, and H. Si, J. Mech. Phys. Solids 47, 697 (1999).
- (18) C.-h. Chiu and H. Gao, in Thin Films: Stresses and Mechanical Properties V, edited by S.P. Baker, MRS Symposia Proceedings No. 356 (Materials Research Society, Pittsburgh, 1995), p. 33.
- (19) A.A. Golovin, M.S. Levine, T.V. Savina, and S.H. Davis, Phys. Rev. B 70, 235342 (2004).
- (20) M.S. Levine, A.A. Golovin, S.H. Davis, and P.W. Voorhees, Phys. Rev. B 75, 205312 (2007).
- (21) B.J. Spencer, Phys. Rev. B 59, 2011 (1999).
- (22) Z. Suo and Z. Zhang, Phys. Rev. B 58, 5116 (1998).
- (23) C.-h. Chiu, Phys. Rev. B 69, 165413 (2004).
- (24) R.C. Brower, D.A. Kessler, J. Koplik, and H. Levine, Phys. Rev. A 29, 1335 (1984).
- (25) T.Y. Hou, J.S. Lowengrub, and M.J. Shelley, J. Comput. Phys. 114, 312 (1994).
- (26) M. Khenner, R.J. Braun, and M.G. Mauk, J. Cryst. Growth 235, 425 (2002); 241, 330 (2002).
- (27) G. Tryggvason, B. Bunner, A. Esmaeeli, D. Juric, N. Al-Rawahi, W. Tauber, J. Han, S. Nas, and Y.-J. Jan, J. Comput. Phys. 169, 708 (2001).
- (28) J.A. Sethian, Comm. Math. Phys. 101, 487 (1985).
- (29) J.A. Sethian, J. Diff. Geom. 31, 131 (1990).
- (30) W.W. Mullins, J. Appl. Phys. 28(3), 333 (1957); 30, 77 (1959).
- (31) W.W. Mullins, in Metal Surfaces (American Society for Metals, Metals Park, OH, 1963), 17–66.
- (32) J.W. Cahn and J.E. Taylor, Acta. Metall. Mater. 42, 1045 (1994).
- (33) S. Angenent and M.E. Gurtin, Arch. Ration. Mech. Anal. 108, 323 (1989).
- (34) A. Di Carlo, M.E. Gurtin, and P. Podio-Guidugli, SIAM J. Appl. Math. 52, 1111 (1992).
- (35) B. J. Spencer, Phys. Rev. E 69, 011603 (2004).
- (36) M. Siegert and M. Plischke Phys. Rev. Lett. 73, 1517 (1994).
- (37) M. Rost and J. Krug, Phys. Rev. E 55, 3952 (1997).
- (38) M. Siegert, Physica A 239, 420 (1997).
- (39) P. Politi, Phys. Rev. E 58, 281 (1998).
- (40) M.F. Gyure, J.J. Zinck, C. Ratsch, and D.D. Vvedensky, Phys. Rev. Lett. 81, 4931 (1998).
- (41) D. Moldovan and L. Golubovic, Phys. Rev. E 61, 6190 (2000).
- (42) R.V. Kohn, Comm. Pure Appl. Math. 56, 1549 (2003).
FIGURES CAPTIONS
Figure 1. Kinetics (rate) data for deep pinhole (). .
Line slope equals the rate of the tip evolution. Solid line: . Dash line: .
(a) Wide pinhole (). (b) Intermediate pinhole (). (c) Narrow pinhole ().
Figure 2. Same as Figure 1, but for shallow pinhole ().
Figure 3. Kinetics data for deep, wide pinhole. . Solid line: .
Dash line: . Dash-dot line: .
Dash-dash-dot-dot line: .
Figure 4. Surface morphologies for the deep pinhole.
. The depth () and the width () of the
pinhole at are defined.
Solid, dash, dash-dot line: , respectively.
Inset: magnified view of dewetting region for .
Figure 5. Magnified view of the transient surface morphology and surface slope (inset) for the deep, narrow pinhole from Figure 4. Dash line: surface at .
Figure 6. Surface morphologies for the shallow pinhole.
.
(a): , (b): , (c): .
Dash line: surface at .
Figure 7. Surface morphology for the shallow, wide pinhole.
.
Dash line: surface at .
Figure 8. Contour plot of the dewetting factor .