present address: ]Deparment of Physics, University of Notre Dame, Notre Dame, Indiana 46556, USA present address: ]Astronomisches Institut, Ruhr-Universität Bochum, Germany present address: ]Lessingschule, Bochum, Germany
Lifetime measurement of the 6792 keV state in 15O important for the astrophysical S factor extrapolation in 14N(p,)15O
Abstract
We report on a new lifetime measurement of the keV state in 15O via the Doppler-shift attenuation method at the keV resonance in the reaction 14N(p,)15O. This subthreshold state is of particular importance for the determination of the ground state astrophysical S factor of 14N(p,)15O at stellar energies. The measurement technique has been significantly improved compared with previous work. The conclusion of a finite lifetime drawn there cannot be confirmed with the present data. In addition, the lifetime of the two states at and 6172 keV have been measured with the same technique in order to verify the experimental method. We observe an attenuation factor for the and 6792 keV states, respectively, corresponding to fs. The attenuation factor for the keV state results in corresponding to fs in excellent agreement with literature.
pacs:
26.20.Cd, 24.30.-v, 26.65.+t , 27.20.+nI Introduction
The capture reaction 14N(p,)15O ( keV, fig. 1) is the slowest process in the hydrogen burning CNO cycle Rolfs and Rodney (1988) and thus of high astrophysical interest. This reaction plays a key role for the energy production of more massive main sequence stars and the detailed understanding of the neutrino spectrum of our sun Ahlen et al. (1990); Arpesella et al. (2008) as well as the age determination of globular cluster stars Imbriani et al. (2004). The reaction was recently studied in three experiments at energies ranging from to 480 keV Formicola et al. (2004); Imbriani et al. (2005); Runkle et al. (2005); Lemut et al. (2006) (all energies are given in the center-of-mass frame if not indicated different) and previously over a wide range of energies, i.e. to 3300 keV (Schröder et al. (1987) and references therein). The major motivation for reinvestigating this reaction was a reanalysis Angulo and Descouvemont (2001) of the data of Schröder et al. (1987) using R-matrix resulting in a significant change in the extrapolation of the ground state astrophysical S factor from keV b Schröder et al. (1987) to a nearly negligible contribution. A reduction of the ground state contribution could indeed be verified by the recent experiments Formicola et al. (2004); Runkle et al. (2005). However, the R-matrix analysis revealed that below the keV resonance the data followed primarily the low energy wing of the resonance (fig. 2) and could not probe significantly the behavior of the interference structure of the four resonances at , 987, 2187 keV and the background pole - here fixed at 6 MeV - around the energy of this resonance which in turn adds incoherently to the ground state S factor (for details see Formicola et al. (2004) and Trautvetter et al. (2008)). A precise knowledge of this interference structure is needed for reliable extrapolation due to a minimum of the S factor curve near keV.

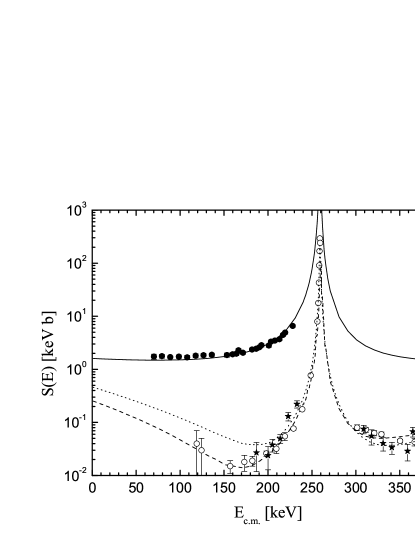
In a second experiment at the LUNA accelerator at the Laboratori Nazionali del Gran Sasso, Italy, with a 4 BGO detector and a windowless gas target system Lemut et al. (2006) the total S factor of 14N(p,O has been measured down to keV with keV b (statistical error only). However, the ground state contribution at that energy is expected to be keV b and falls rapidly above 70 keV up to the resonance Formicola et al. (2004). It is obvious that the experiment Lemut et al. (2006) cannot probe sensitively the contribution of the ground state transition within a factor of two of the results of Formicola et al. (2004). Fig. 2 shows a comparison of the available data together with R-matrix fits Formicola et al. (2004); Runkle et al. (2005). Note: the data of Lemut et al. (2006) are not taken into account in the R-matrix analysis.
The energy dependence of Sgs at low energies is primarily controlled by the width of the subthreshold state at keV. The width could be deduced by a measurement of the lifetime of this state. In this case such an experiment is feasible by means of spectroscopy if the lifetime is long enough to allow for a observable Doppler-shift attenuation in the slowing down process of the recoiling 15O nucleus. This method is called Doppler-Shift Attenuation Method (DSAM) and was reported in Bertone et al. (2001) with an attenuation factor corresponding to a lifetime of fs. In this experiment the authors used three Ge detectors placed at 0∘, 90∘, and 144∘ with respect to the beam axis. The advantage of this approach is that all information in principal could be obtained in a single run, but results in the difficulty that each spectrum had to be calibrated absolutely and as a function of time to a high precision (better than keV) in order to extract an value near unity.
In contrast to the previous experiment Bertone et al. (2001) the present approach uses one detector placed on a turntable with an angle span from -40∘ to +116∘. Gamma spectra were obtained at 11 angles of which 2 angle settings were symmetric around the beam axis leaving 9 different angles. In this way a left/right asymmetry in the detector placement could be detected as well as a possible asymmetry in the beam alignment. Therefore systematic uncertainties could be greatly reduced. The gain stability of the electronics in the course of the experiment was checked by the keV -ray emission from the reaction 19F(p,O. Due to the fact that all measurements were done with the same detector a precise absolute determination of the -ray energy was not necessary. The determination of the slope of the energy calibration was obtained via the 14N(p,O reaction itself using the -ray energy information of the various transitions in 15O given in Imbriani et al. (2005).

II Experimental set-up and experimental procedure
The 500 kV accelerator at the Dynamitron tandem laboratory at the Ruhr-Universität Bochum provided the proton beam with typically 100 to 150 A on target at keV. The energy calibration and the energy spread of the proton beam are known to better than 1 keV, and equal to 70 eV, respectively Klug (2005). Fig. 3 shows a schematic diagram of the experimental set-up. The beam passed through two Ta collimators with a diameter of 10 and 4 mm at a distance to the target of 80 and 6.5 cm, respectively, and was stopped in the N target. A LN2 cooled shroud placed at 20 cm in front of the target avoided C-build up and ensured a typical pressure in the target chamber of about mbar. After focusing the beam, the 4 mm collimator was removed to minimize beam induced background originating from the collimator. The target chamber was formed by a cylindrical T-shape steel tube (inner diameter = 9.7 cm, wall-thickness = 2 mm) in order to ensure the same influence of the -ray absorption in the chamber walls for all angles. The target was mounted on a directly water cooled, rotatable target holder. On the target holder three targets could be placed at the same time and brought into the beam without breaking the vacuum. The alignment of the target chamber and the target itself was checked to be better than mm.
A turntable was placed at the target chamber with its axis at the target position. The 0∘ position could be aligned to the beam axis within . The total uncertainty of the turntable axis position in respect to the beam spot position could be estimated by mm, where the uncertainty coming from the detector positioning on the turntable arm as well as the beam spot position on the target are included. The angles reached by this set-up ranged from -40∘ to 116∘ with respect to the beam axis (fig. 3) and reproducibility within less than 0.2∘ was varified. A HPGe gamma detector was placed on the arm of the turntable (108% relative efficiency, resolution = 2.1 keV at MeV, front face distance to the target = 13.1 cm).
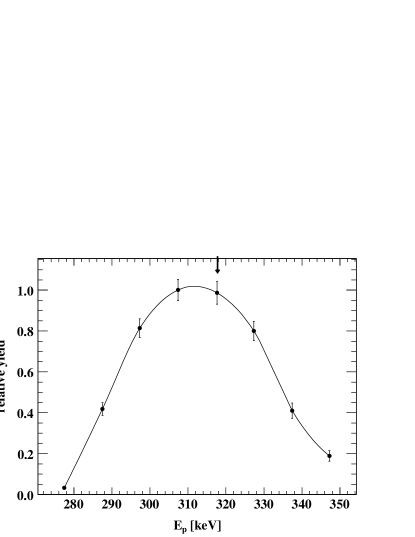
The N target has been produced by implanting 14N into a Ta backing with a 0.5 mm thickness (backing diameter = 50 mm). A molecular N beam at an energy of keV from the 500 kV accelerator was rastered with a pair of magnetic x-y scanners over an aperature (diameter = 24 mm) in close geometry to the target leading to an implanted area of 25 mm diameter. The 14N distribution in the Ta was investigated using the keV resonance of 14N(p,O. A target profile obtained after an 14N irradiation dose of atoms/cm2 is shown in fig. 4. As seen in the figure the 14N atoms are distributed from the surface of the Ta to a depth of 46 keV at half maximum. A proton energy of keV, where the thick-target yield plateau is still almost constant, was chosen for all the measurements. The target stoichiometry after the implantation reaches saturation should be equal to that of the compound Ta2N3 Seuthe et al. (1987); Keinonen and Anttila (1979).

In addition, a CaF target has been evaporated on a Ta backing (thickness of the CaF layer = 410 nm) and was used for calibration purpose. This CaF target was placed on the target holder together with the 14N target and moved into the beam with the proton beam untouched in both focus and energy. This procdure was repeated before and after each run on the 14N target. Thus the gain stability of the detector/electronic system was controlled by observing the keV line of the 19F(p,O reaction at keV ( keV in the 19F + p system) at 0∘ and 90∘, respectively. The peak position of the keV line in each calibration run was extracted from the spectrum by the determination of the centroid of the peak area. Sample spectra are shown in fig. 5. The effect due to different contributions from unstopped 16O nuclei is clearly visible. The absence of a high energy tail suggests a strongly foreward peaked angular distribution of the -particles and as a consequence one observes at 0∘ besides the -ray emission from 16O nuclei at rest a low energy tail due to the backward motion of the 16O nuclei (solid line in fig. 5). However, at 90∘ also a high energy tail emerges. The treatment of the background below the peak from the unshifted contributions depends on the kinematics and angular distribution of the -particles which is not precisely known. Different treatments of this background lead to different centroids which can amount up to 1 keV difference between a 0∘ and a 90∘ measurement. We have adopted a linear background for the 90∘ run and an error function (position and width taken from the peak) for the 0∘ case. The centroid for both runs agreed within 0.15 keV using these assumptions. The result of the calibration runs is that the offset in the energy calibration was constant within keV during the course of the experiment (about 10 hours) while the relative error in the slope was . Moreover, the slope shows a weak linear time dependence of about 0.025 keV/hour. All spectra were corrected for this effect. In summary, the accuracy of the energy calibration is of the order of keV (see inset in fig. 5).
Finally, the angles measured with the N target were chosen to be 90∘, 0∘, 105∘, 75∘, 20∘, -20∘, 116∘, -40∘, 60∘, 40∘, 82∘, 116∘, 0∘, and 90∘ in this order in time. The target holder could be placed in two positions: at +110∘ (1) and at -110∘ (2) with respect to the beam axis. The first 11 angles were obtained with the target in position 1 while the last three angles were measured in position 2. The different target positions were used to exclude possible influences of -ray absorption through the target holder on the determination of the energy-centroid of the peak. Moreover, the fine grid of angles allows to check experimentally a displacement of the turntable in respect to the beam spot position.
In each run or angle measurement, respectively, the centroid of five -ray lines was determined: the secondary transitions of the keV state, primary ( keV) and secondary of the keV state, and primary ( keV) and secondary of the keV state. The primary transition into the keV state was not taken into account due to too small shifts of this line. The observed -ray energy, , at an angle in respect to the recoil direction is related to the emitted -ray energy , (in the center-of-mass frame), by the relation:
| (1) |
where is the initial recoil velocity and is a correction accounting for the finite size of the Ge detector, which has been obtained by a GEANT4 simulation Agostinelli et al. (2003) to .

The quality of the spectra of the present experiment are displayed in fig. 6 for the most important transition: the keV state secondary transition. The statistics of the 90∘ run (filled circles in fig. 6) was improved by a factor two in the present experiment compared to previous experiments, i.e. Bertone et al. (2001). The background of the keV -ray line was - similar to the calibration runs - estimated by an error function and is nearly negligible for this line. We have not analysed the single escape lines - which in principal could be also used - because they have less statistics and higher background, which would in turn introduce larger systematic uncertainty due to the background treatment. The width of the region for the centroid determination was kept constant for all angles but shifted with the Doppler-shift of the line.
The analysis of the keV line was seriously hampered by the double escape line ( keV) of the 6172 keV peak. Both lines shift differently and therefore at 0∘ (116∘) the distance of both lines was only 29 keV (34 keV) complicating the background determination. These circumstances introduce additional systematic errors in the determination of the centroid for this transition. The intensity of the primary transition -ray lines is much higher and hence the precision with which their centroid could be analysed relative to the expected full shift is nearly the same as for the high energy lines. The positions of these lines, which are expected to show full Doppler-shift, serve as a constraint for the determination of the geometrical offset parameters of the turntable relative to the target position.
| [keV] | [fs] | 111ref. Bertone et al. (2001) | [fs]111ref. Bertone et al. (2001) | [fs]222ref. Ajzenberg-Selove (1991) | ||
|---|---|---|---|---|---|---|
| 1384333primary transition | 0.6 | |||||
| 2375333primary transition | 1.0 | |||||
| 5181444secondary transition | 0.4 | |||||
| 6172444secondary transition | 1.1 | |||||
| 6792444secondary transition | 0.7 |

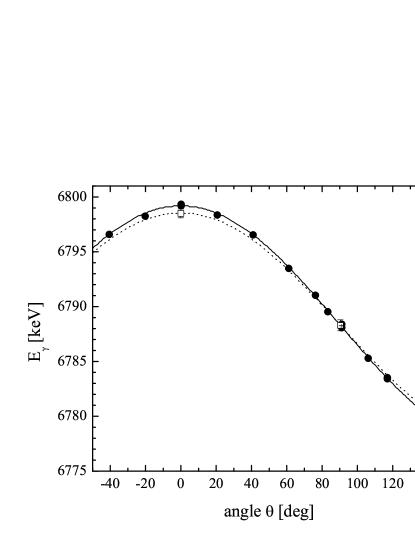
The experimental shifts are obtained from the slope of a linear fit to the observed -ray energies versus , with being the observation angle. The attenuation factor can be calculated analytically from the measured shift values . A correction of the observation angle due to the real position of the turntable was applied, where the geometrical shift parameters a and b were kept as free parameters in the fit. In a combined fit of all lines using eq. 1 the values as well as the parameters a and b were determined, where the values for the primary transitions were only allowed to vary within from unity. The best fit results in an attenuation factor of for the keV -ray line and is displayed in fig. 7 (solid line) together with the experimental data points (filled circles) for this transition. For comparison the measured values (open squares) of Bertone et al. (2001) and their best fit with (dotted line) are shown: the measurements are in good agreement with the present data but the attenuation value of Bertone et al. (2001) is excluded by more than by the dense experimental data grid of the present experiment. The conclusion from the present experiment is that the result is in good agreement with full Doppler-shift. Therefore, only a lower limit of the attenuation factor for the keV transition can be given and, in turn, only an upper limt for the lifetime of the associated state (see below). The results for all transitions are summarized in table 1 together with the calculated uncertainties and the reduced . The residuals of all 5 fits are shown in fig. 8. The geometrical offset of the turntable was determined to mm and mm within expectations.
III Lifetime determination
For the lifetime extraction we followed the assumption of Bertone et al. (2001); Bister et al. (1977) that the implanted N ions occupy interstitial, rather than substitutional, sites within the Ta lattice and, therefore, the density should be close to that of Ta. In this case can be calculated by
| (2) |
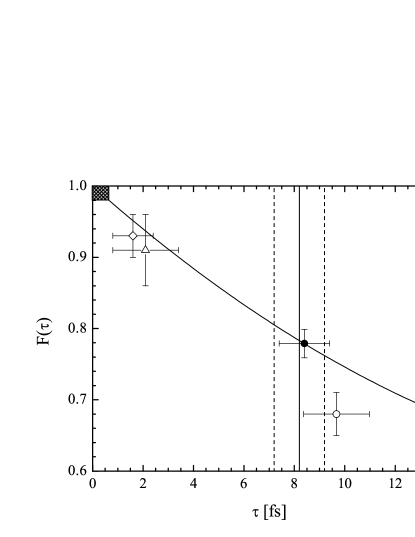
We have run the SRIM program H.Andersen and J.F.Ziegler (1977) to obtain the collision details for a large number of recoiling 15O nuclei from which , the time dependent averaged projection of the recoil velocity distribution on the beam axis, was extracted and then fitted by a sixth order polynomial. Eq. 2 can then be solved analytically. The resulting -curve is not as steep as found in Bertone et al. (2001) (see also open symbols compared to solid line in fig. 9) but results in a lifetime determination of the keV state in 15O (table 1 and solid point in fig. 9) which is in excellent agreement with Ajzenberg-Selove (1991) (vertical lines in fig. 9). The analysis leads to an upper limit of the lifetime of fs for the and 6792 keV states, indicated by the shaded area in the upper left corner of fig. 9. For comparison, fig. 9 also shows the values obtained by Bertone et al. (2001) as open symbols. If the saturation of N in the Ta was not reached completely during the implantation the resulting -curve is not as steep as in the presented case. Consequently, in the worst case of a N:Ta ratio of 1:1 the 1- upper limit increases by only 2 % for the and 6792 keV states and to fs for the MeV state within the given uncertainty range.
In summary, a finite lifetime for the latter states in 15O cannot be extracted from the present data. This leads to the final conclusion that there are strong doubts that the lifetime of these states can be measured by means of the Doppler-shift attenuation method. Moreover, ref. Bister et al. (1977) opens the possibility of an independent check of our analysis procedure on experimental values. In this work the lifetime of states in 14N were obtained using the Doppler-shift attenuation method with the reaction 13C(p,N at keV. The authors also evaluated the lifetime with Monte Carlo calculations and investigated in the course of the measurements experimentally the stopping power of 15N ions in Ta. The reason to choose 15N instead of 14N was only due to the absence of any narrow 14N resonances in the range of their accelerator. Our analysis using the collision details (see above) obtained from SRIM H.Andersen and J.F.Ziegler (1977) is in very good agreement with the results of Bister et al. (1977), see table 2. We also have reproduced the experimental depth profiles of 15N ions implanted in Ta of Bister et al. (1977) using SRIM H.Andersen and J.F.Ziegler (1977), indicating that the stopping power calculation from H.Andersen and J.F.Ziegler (1977) is sufficiently precise for the present experiment.
| level in 14N | ref. Bister et al. (1977) Bister et al. | present | |
|---|---|---|---|
| [keV] | [fs] | [fs] | |
| 3948 | |||
| 5690 | |||
IV Summary and conclusion
The present experiment has improved the statistical as well as systematic uncertainties in the determination of the Doppler-shift attenuation of three -ray transitions in 15O: 5181, 6172 and 6792 keV. Our upper limits on the lifetimes of the and 6792 keV is only marginaly in agreement with the conclusion of Bertone et al. (2001), while the experimental data of Bertone et al. (2001) are not in contradiction with the present data.
The upper limit for the lifetime of the keV subthreshold state in 14N(p,O converts to a lower limit of the -width of this state of eV. This result is in good agreement with the value found in Formicola et al. (2004) with eV from R-matrix analysis of the S factor curve of the ground state transition in 14N(p,O. The S factor extrapolation from the R-matrix fit of Runkle et al. (2005) indicates a value of eV not in contradiction with the present result, but in disagreement with Formicola et al. (2004) (Note: the R-matrix fit of Runkle et al. (2005) was obtained by omitting the high energy data of Schröder et al. Schröder et al. (1987)). In a Coulomb excitation experiment Yamada et al. (2004) a width of eV was reported in agreement with the present result. Hence, the statements in Formicola et al. (2004); Imbriani et al. (2005); Runkle et al. (2005) concerning the ground state transition in 14N(p,O are essentially unchanged, but further conclusions need to await a more detailed R-matrix study. Moreover, further investigations for the ground state S factor of the reaction 14N(p,O are still necessary. Such an experiment Trautvetter et al. (2008) was performed recently, i.e. a precision measurement of the ground state transition above the keV resonance with a Clover detector, reducing the necessary summing correction by one order of magnitude compared to previous direct studies Formicola et al. (2004); Runkle et al. (2005). The results Marta et al. (2008) indicate again a very good agreement with the present result and the of Formicola et al. Formicola et al. (2004).
Acknowledgements.
The authors thank H.W. Becker and J.N. Klug (RUBION Bochum, Germany) for their support with the 500 kV accelerator and Z. Fülöp (ATOMKI Debrecen, Hungary) for fruitful comments on the manuscript.References
- Rolfs and Rodney (1988) C. Rolfs and W. Rodney, Cauldrons in the Cosmos (University of Chicago Press, 1988).
- Ahlen et al. (1990) S. Ahlen et al., Phys. Lett. B249, 149 (1990).
- Arpesella et al. (2008) C. Arpesella et al., Phys. Lett. B658, 101 (2008).
- Imbriani et al. (2004) G. Imbriani et al., Astron. Astrophys. 420, 625 (2004).
- Formicola et al. (2004) A. Formicola et al., Phys. Lett. B591, 61 (2004).
- Imbriani et al. (2005) G. Imbriani et al., Eur. Phys. J. A25, 455 (2005).
- Lemut et al. (2006) A. Lemut et al., Phys. Lett. B634, 483 (2006); D. Bemmerer et al., Nucl. Phys. A779, 297 (2006).
- Runkle et al. (2005) R. Runkle et al., Phys. Rev. Lett. 94, 082503 (2005).
- Schröder et al. (1987) U. Schröder et al., Nucl. Phys. A467, 240 (1987).
- Angulo and Descouvemont (2001) C. Angulo and P. Descouvemont, Nucl. Phys. A690, 755 (2001).
- Trautvetter et al. (2008) H.-P. Trautvetter et al., J. Phys. G35, 014019 (2008).
- Bertone et al. (2001) P. Bertone et al., Phys. Rev. Lett. 87, 152501 (2001).
- Klug (2005) J. Klug, Diploma Thesis (Ruhr-Universität Bochum, Germany, 2005).
- Keinonen and Anttila (1979) J. Keinonen and A. Anttila, Nucl. Instr. Meth. 160, 211 (1979).
- Seuthe et al. (1987) S. Seuthe et al., Nucl. Instr. Meth. A260, 33 (1987).
- Agostinelli et al. (2003) S. Agostinelli et al., Nucl. Instr. Meth. A506, 250 (2003).
- Ajzenberg-Selove (1991) F. Ajzenberg-Selove, Nucl. Phys. A523, 1 (1991).
- Bister et al. (1977) M. Bister, A. Anttila, and J. Keinonen, Phys. Rev. C16, 1303 (1977).
- H.Andersen and J.F.Ziegler (1977) H.Andersen and J.F.Ziegler, The Stopping and Ranges of Ions in Matter (Pergamon, New York, 1977), eprint and SRIM-2006.
- Yamada et al. (2004) K. Yamada et al., Phys. Lett. B579, 265 (2004).
- Marta et al. (2008) M. Marta et al., in preparation (2008).