Conductivity behavior of La0.75Ca0.25MnO3 in vicinity of ferromagnetic-paramagnetic transition studied with single current pulses
Abstract
Temperature and current dependences of resistivity of bulk La0.75Ca0.25MnO3 sample grown by the floating-zone method were studied using single ramp pulses of current. It is found that near the Curie temperature the sample resistance depends substantially on current magnitude. The observed features can be determined by inhomogeneous Joule overheating due to mixed phase state of manganites near the ferromagnetic-paramagnetic transition and percolation character of this transition.
In recent years extensive studies were done on complex manganese oxides with the perovskite structure which are known as manganites with the general formula R1-xAxMnO3,where R is a rare-earth element, A an alkaline-earth element. The keen interest in the manganites is accounted for by their unique physical properties and possibilities of their practical applications. One of those properties is their colossal (negative) magnetoresistance near the Curie temperature of the transition from paramagnetic (PM) to ferromagnetic (FM) states. This transition is often accompanied by such strong (sometimes, tenfold) reduction of the electrical resistance that it looks like an insulator-metal transition. The magnitude of this effect depends on the crystal perfection of samples, their chemical composition, while being very sensitive as well to external influence, in particular to magnetic and electric fields. In the well-known studies on influence of the electric field (or the current J) in bulk and film samples of the manganites (for example, sud ; gao ; palan ; imam ) the observation was made, that, to some extent or another, the Joule selfheating of samples by the measuring current is always present. This phenomenon may well result in thermal bistability in such metals where in the phase transition region a stepwise resistance-on-temperature dependence is observed with the positive temperature coefficient gurev .
The present study concerns with the non-linear effect in conductivity of a bulk specimen of La0.75Ca0.25MnO3 grown by the floating-zone technique with the radiation heating boris1 ; boris2 . The sample structure was close to being single-crystal. For the purpose of measurements such part of the sample was used which had been studied earlier in reference boris1 . It is known boris1 ; boris2 ; boris3 that the PM-FM transition in this compound is first order and has a percolation character. In the region of this transition the system is inhomogeneous and consists of a mixture of PM and FM phases. The non-Ohmic effects in these systems are attributed, first of all, to the Joule heating which raises the temperature of the specimen. However, in the inhomogeneous systems the Joule heating may be inhomogeneous as well. This study aims to reveal such effects. For this purpose, the behavior of the specimen conductivity in the PM-FM transition region was studied by applying single ramp pulses of current that are linearly-increasing with time (in the quasi-adiabatic regime). Thus we expected to be able to keep a global heating of the specimen not too strong (as compared to the well-known DC studies), while simultaneously providing for a large enough value of the measuring current which can give a possibility of determining the peculiarities of the electron transport in this inhomogeneous medium.
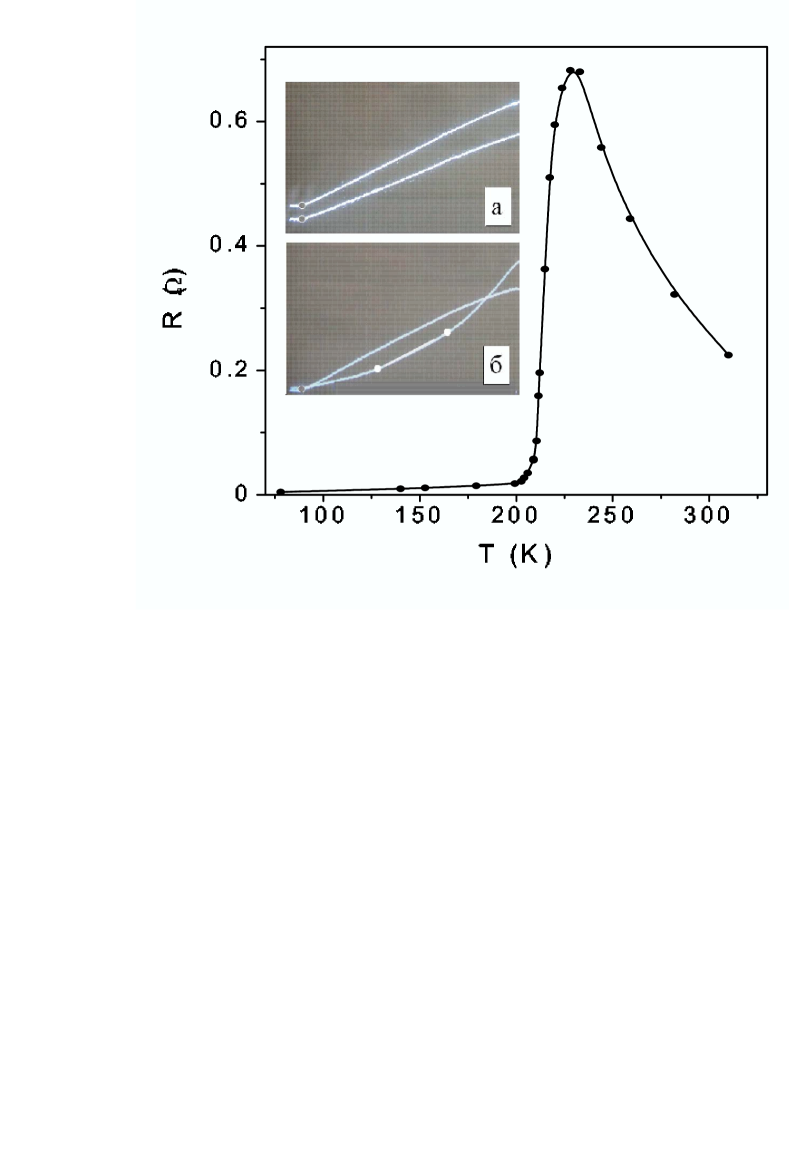
The measurements were taken in the temperature range 77-320 K. The specimen ( mm3) was glued to a copper plate (coated with a thin insulating intermediate layer) which was placed in a chamber of highly rarefied gaseous helium (10-3 - 10-4 Torr), immersed in liquid nitrogen. The current and potential leads to the specimen were soldered with indium. The electric measurements were carried out using a standard four-probe technique applying single current pulses that were linearly increasing with time (“sawtooth” shape) with the widths tp ranging from 0.25 to 5 ms and an amplitude Jmax up to 10 A (the maximum current density being about 2.5102 A/cm2). The operating range of the current pulse widths was chosen such that the width tp, on the one hand should exceed the characteristic times of the magnetic relaxation of the manganite samples of this kind and, on the other hand, that it should meet the desirable minimization of the heat release on this specimen. The latter is determined not so much by the current pulse width, as by its amplitude and the resistivity value of the specimen which during the PM-FM transition (in the temperature interval 200-230 K) varies 40-fold (Fig.1). Upon cooling-down of the specimen to the liquid nitrogen temperature the measurements were taken at fixed temperatures, the voltage drop response on the specimen and signal, that was proportional to the magnitude of current passing through the specimen , being recorded simultaneously at a dual-beam oscilloscope “V6-9”. Fig. 1 (inset) presents two types of the characteristic oscillograms and . In one case, the curves of current and voltage are self-similar (type 1, Fig.1, inset “a”). In the other case (in the steep resistance increase region during the PM-FM transition) the curves display two clear-cut turns (type 2, Fig.1, inset “b”).
The temperature dependences of resistance at assigned current and the current dependences of resistance at assigned temperature were determined from data of the corresponding oscillograms and . The construction of the relations involved the use of current pulses of varying widths and amplitude. To obtain the base relation that would be undistorted by the current influence (Fig.1) such data was processed that pertained to short current pulses of low amplitude ms; A. At those parameters, the oscillograms of the first type were realized (Fig.1) which was indicative of the fulfillment of the Ohm law. The obtained relation coincides with the temperature dependence , measured on the same specimen boris1 at low DC current below 5 mA.
Fig.2 shows the relations for three current values of 2.7, 5.4 and 8 A, which were realized accordingly in 0.25, 0.5 and 0.75 ms after triggering the pulse. At any temperature the Joule heating causes the specimen to raise its temperature. The relation ) in the Ohmic regime is a curve with a rather steep maximum at (Fig. 1). It is clear that at the Joule heating should increase the resistance, and at values higher than it should bring it down, which is what is observable in the first approximation. The inset of Fig. 2 presents the temperature dependence of a relative resistance change during the variations of the current , where - resistance measured at the minimum current. The characteristic feature of it is such that the peak is in the region of the sharpest resistance growth during the magnetic transition (about 210 K).
Major peculiarities of the non-linear behavior came up with the resistance-current relations being in the temperature range 200–240 K (Fig. 3). Below the temperatures K the resistance of the specimen does not depend on the current (in the current range studied). Above the temperatures K the resistance increases with rising current (type 1 oscillogram, Fig.1, inset “a”), while above K it increases at low currents just to come down for relatively large currents, which is consistent with the data presented in Fig. 2. All of this is in line with the anticipated Joule heating influence for approximately homogeneous systems (see similar results for the system La-Ca-Mn-O sud ; gao ).
Yet, in the interval K, the curves of demonstrate an absolutely different nature of the non-linearity featuring two turns which are characteristic of the type 2 oscillogram (Fig.1, inset “b”). This behavior is inconsistent with the Joule heating influence for homogeneous systems and it must be attributed to certain peculiarities of the magnetic transition of first order under study. In this temperature interval of the magnetic transition, the system is inhomogeneous to the utmost, consisting of a mixture of PM and FM phases boris1 ; boris2 ; boris3 . The first turn which is observable at the smallest values of the current (empty circles in Fig.3) is obviously associated with an incipient noticeable influence of the Joule heating of the specimen. The second turn on the curve (Fig.3, filled circles) is observable for far greater currents and, as much as the first turn, it is shifted toward lesser currents with increasing temperature. The average specimen temperature increase as observable by emergence of the second turn can be determined by following the resistance change values from initiation of the pulse to this turn, while comparing them with the relation at the minimum current. In the temperature interval 210–214 K this variation is about 0.1 , which corresponds to the specimen being heated by only 2 K. The appropriate estimation of the specimen heating made in the assumption of the adiabatic nature of the process according to the formula ( and - mass and heat capacity of the specimen) comes out with a closely matched value. Note that the resistance of the current contacts at all temperatures is substantially smaller than that of the specimen and cannot be the cause for its heating. This statement is supported by the specimen resistance being independent of the value of the current at temperatures below K, which is to say when the specimen resistance is smaller than several hundredths of one Ohm.
The specimen studied in this research had been investigated in reference boris1 where DC resistance, magnetization, velocity and absorption of the sound were measured. The anomalies of these properties observed in reference boris1 in the vicinity of the PM-FM transition were interpreted in terms of the existence of a multi-phase state near . It is well-known boris2 ; boris3 that in this system the FM clusters may be present at temperatures far above , while in the meantime a certain number of PM dielectric clusters can be preserved at temperatures that are considerably lower than . This situation implies truthfulness of the percolation nature of the FM-PM transition. This has served as basis, as well, for the interpretation of results of this work. During temperature increase near the volume portion of the FM phase decreases, while the PM one is on the increase. Near the percolation threshold, the conductivity of a system is determined by a small number of high-conductive FM percolation channels (paths). Under those conditions an inhomogeneous Joule heating is possible which is made feasible by the supply of short current pulses so that the locally generated heat has not time enough to dissipate in the ambience during the time of the measurements. Earlier, an inhomogeneous Joule heating was observable at DC measurements in thin and narrow films of La0.7Ca0.3MnO3 nearly 50 m wide palan , which allowed for considerable current densities to be achieved. In this work, we observed jumps of resistance after exceeding the values of the current of some critical magnitude (which were temperature-dependent). Those kinds of jumps are characteristic of the appearance of a bistable state in the region of the phase transitions with S-shaped - characteristics gurev (which was observable as well in manganite films imam ). The unstable states of such kinds that are observable at large currents are quite feasible for the homogeneous systems, as well. The inhomogeneity which is inherent to the manganites in the region of their phase transition enhances such kinds of effects. Really, a large local overheating in the region of the percolation FM current paths causes, at least, a part of these paths to transition to the PM state so that instead of a continuous channel there appears a chain of isolated FM islands in the dielectric PM matrix. This brings about a dramatic increase in the resistance of the entire system which is reflected in the type 2 oscillograms (Fig. 1, inset “b”). In this way, the pulse-application technique has enabled to discover the appearance of an inhomogeneous percolation structure in a bulk specimen of the manganite near the phase transition which agrees well with results from other studies boris1 ; boris2 ; boris3 .
References
- (1) L. Sudheendra, C. N. R. Rao, J. Appl. Phys. 94, 2767 (2003).
- (2) J. Gao, S. Q. Shen, T. K. Li, J. R. Sun, Appl .Phys. Lett. 82, 4732 (2003)
- (3) A. Palanisami, M.B. Weissman, N. D. Mathur, Phys. Rev. B 71, 094419 (2005).
- (4) S. Imamori, M. Tokunaga, S. Hakuta, T. Tamegai, Appl. Phys. Lett. 89, 172508 (2006).
- (5) A. V. Gurevich, R. G. Mints, Rev. Mod. Phys. 59, 941 (1987).
- (6) B. I. Belevtsev, G. A. Zvyagina, K. R. Zhekov et al., Phys. Rev. B 74, 054427 (2006).
- (7) B. I. Belevtsev, D. G. Naugle, K. D. D. Rathnayaka et al., Physica B 355, 341 (2005).
- (8) B. I. Belevtsev, Low Temp. Phys. 30, 421 (2004).