The Exceptionally Large Debris Disk around Ophiuchi
Abstract
Spitzer images resolve the debris disk around Ophiuchi at both 24 and 70 . The resolved images suggest a disk radius of 520 AU at 70 and 260 AU at 24 . The images, along with a consistent fit to the spectral energy distribution of the disk from 20 to 350 , show that the primary disk structure is inclined by 50° from the plane of the sky at a position angle of 55°2°. Among a group of twelve debris disks that have similar host star spectral types, ages and infrared fractional luminosities, the observed sizes in the infrared and color temperatures indicate that evolution of the debris disks is influenced by multiple parameters in addition to the proto-planetary disk initial mass.
Subject headings:
circumstellar matter – infrared: stars – planetary systems – stars: individual ( Oph)1. Introduction
Planetary debris disks are one of the best means to explore the evolution of planetary systems. The Spitzer mission has made fundamental contributions to our understanding of them, including documenting the wide variety in properties such as amounts of excess emission, disk size and grain properties derived from mineralogical features (Rieke et al. 2005, Su et al. 2006, Trilling et al. 2008, Chen et al. 2006). Two possibilities for this variety are: 1.) disks share a similar evolution, but with a wide range of initial masses (e.g., Wyatt et al. 2007b; Kenyon & Bromley 2008); and 2.) there are substantial evolutionary differences such as large collisions that dominate the amount of debris for a period of time (Wyatt et al. 2007a). There may also be a mixture of these possibilities (Rieke et al. 2005; Wyatt et al. 2007b). In any case, understanding debris disks requires determination of their range of behavior where critical boundary conditions that might influence these systems are held fixed.
Here we report a detailed study of the debris disk around Ophiuchi, a 184 Myr-old A0 V star (Song et al. 2001, Rieke et al. 2005) at a distance of 29.10.8 pc with an infrared excess detected in the IRAS point-source catalog (Sadakane & Nishida 1986). Fajardo-Acosta et al. (1997) report marginal evidence that Oph is extended at 60 . In this paper, we describe imaging with Spitzer that confirms this result by clearly resolving the disk at both 24 and 70 . Although the radii of other resolved disks (e.g., Fomalhaut) are typically only about 150 AU, we find that the Oph disk is almost four times as large. We combine this size measurement with the detailed spectral energy distribution (SED) of the disk to derive its properties, and compare them to those of a small sample of debris disks with similar host stars.
2. Observations and Data Reduction
The observations presented here are from various Spitzer programs. The IRS spectrum of Oph was previously published based on an older pipeline reduction (S11) by Chen et al. (2006). Here we present the S15 reduction with updated flux non-linearity corrections. Observations at 24 m were obtained at two epochs in standard small-field photometry mode using 3 sec4 cycles at 5 sub-pixel-offset positions, resulting in a total integration of 840 sec on source for each epoch. The observation at 70 m was done in fine-scale mode with 3 sec1 cycle at 4 sub-pixel-offset positions, resulting in a total integration of 100 sec on source. A MIPS SED-mode observation was obtained with 10 sec10 cycles, and a 1′ chop distance for background subtraction.
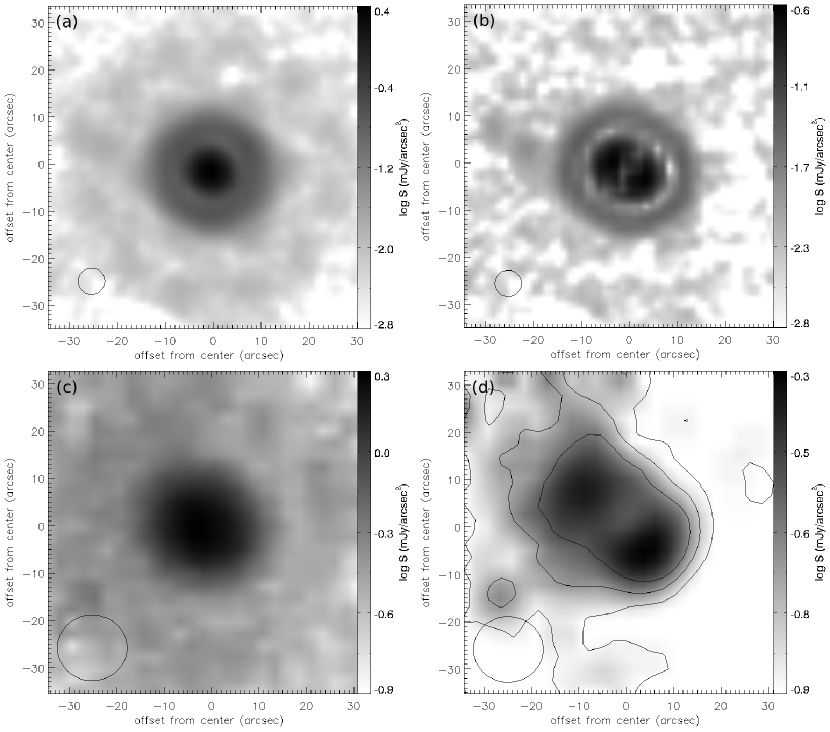
All of the MIPS data were processed using the Data Analysis Tool (Gordon et al. 2005) for basic reduction (e.g., dark subtraction, flat fielding/illumination corrections), with additional processing to minimize artifacts (see Engelbracht et al. 2007). For the 70 fine-scale data, each of the on-source exposures was subtracted from an average background composed of before and after off-source exposures to remove the time-dependent column offsets in the background. The final mosaics were combined with pixels half the size of the physical pixel scale (Figure 1). The MIPS SED-mode data were reduced and calibrated as described by Lu et al. (2008).
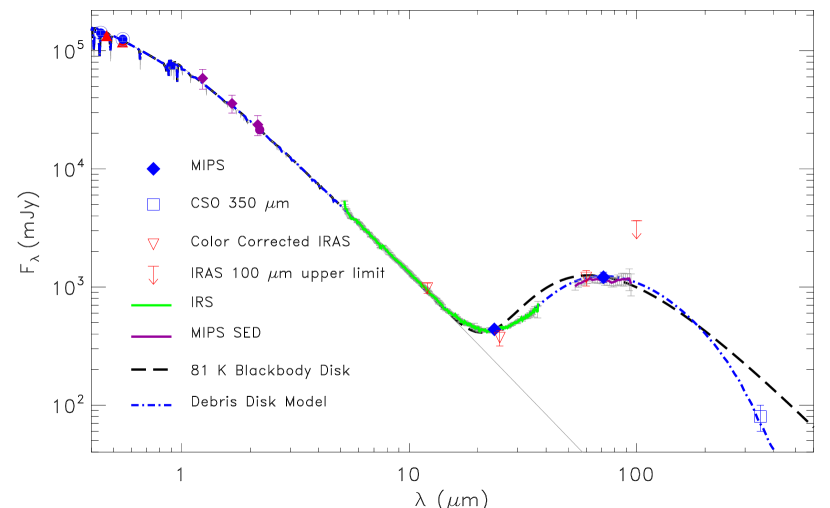
At 24 , the non-color-corrected measurement gives 4343 mJy using an aperture radius of 15″ with a background annulus of 30″–42″, and an aperture correction of 1.143. The expected photospheric flux density in the 24 band is 236 mJy, resulting in a 24 infrared excess of 202 mJy after a color correction of 1.021 (for a blackbody temperature of 80 K, which is the characteristic color temperature of the disk (see §3.2)). The total color-corrected flux density in the 24 band is 43818 mJy, including the uncertainty in the calibration factor of 0.0454 MJy sr-1 (DN s-1)-1 (Engelbracht et al. 2007). For the 70 fine-mode photometry, we use an aperture with a radius of 16″, sky annulus of 18″–39″, and an aperture correction of 1.9. A total flux density of 1140 mJy was estimated using a flux calibration factor of 2894 MJy sr-1 MIPS70F-1 (Gordon et al. 2007). The expected photospheric flux density in the 70 band is 26 mJy; therefore, the disk flux density is 1185 mJy after a color correction of 1.064 (for a blackbody temperature of 80K). The total color-corrected flux density in the 70 band is 1211121 mJy. All available photometry and spectra of Oph are shown in the SED plot in Figure 2.
3. Analysis
3.1. PSF Subtraction
The excess emission at 24 is roughly equal in brightness to the expected photospheric value and yet the source appears point-like at 24 . To reveal the disk, the Point Spread Function (PSF) must be subtracted. We used deep observations of the non-excess A4 V star Eri111MIPS 24 measurement (2473 mJy) and an updated IRS spectrum show no excess in this source. to determine the PSF. At 24 , the Full-Width-Half-Maximum (FWHM24) of the Eri image is 552548 using a 2-D Gaussian fitting function on a field of 26″with an uncertainty of 002002 based on 100 calibration star observations. The Eri image was scaled to the expected photospheric flux density of Oph and to 1.6 times this value for PSF subtraction. The higher value (over-subtraction) allows for the possibility of a significant portion of the excess emission lying close to the star as in Fomalhaut (Stapelfeldt et al. 2004). The results of the PSF subtractions are shown in Figure 1. An elliptical outer disk along the position angle of 56° is seen in the over-subtracted image, while the photospheric-subtracted image confirms that much of the disk emission lies within the PSF. The disk is at least 9″(260 AU) in radius at 24 .
To test for any color dependence in this process, we subtracted the image of Eri from the image of Lep, a debris disk known to be largely confined to within 3 AU (014) radius at 20 (Moerchen et al. 2007), with various scaling factors. There are no disk-like residuals in the subtracted image. The FWHM24 of the photosphere-subtracted Lep image (561555) gives a characteristic resolution for a red point source, slightly broader than given by a blue PSF ( Eri). The FWHM24 of Oph before photospheric subtraction is 584561, which is only 1.061.03 broader than a blue PSF. However, this difference is significant at 16- compared to a blue PSF and 11- to a red PSF. The FWHM24 of the Oph disk after photospheric subtraction is 641575, which is 1.141.03 broader than a red PSF represented by the unresolved core of the Lep disk.
The source appears slightly elongated at 70 (Figure 1c). No photospheric subtraction is needed because the disk is 50 times brighter than the stellar photosphere. However, the faint extended disk emission is more evident after the subtraction of a PSF representing the bright inner disk (Figure 1d). The faint extended emission can be traced up to 18″(520 AU, at 3- level) in radius along the position angle of 55°. The disk has a FWHM70F of 185161 determined using a Gaussian fitting on a field of 55″. Examining two blue calibration stars (HD 48348 and HD 48915), a typical FWHM70F of 153144 with an uncertainty of 02006 was determined, suggesting that the Oph image core at 70 is 1.21.1 times wider than a blue PSF, and resolved at 16- and 28- levels for the major and minor axises. The position angle of the disk determined from both 24 and 70 images is 55°2°. The MIPS slit (width of 198) was at the position angle of 95° when the SED-mode observation was taken. A small fraction of the faint extended disk emission was outside the slit, which may explain the slightly lower (5%) SED-mode flux compared to the fine-mode photometry.
3.2. Spectral Energy Distribution Fitting
The broadband excess photometry at 24 and 70 indicates a color temperature (Tc) of 81 K, which over predicts the observed flux at 28–35 and 55–65 (see Figure 2). This suggests that the dust grains in the system have a wider range of temperatures. To model the disk SED (Figure 3), we use a simple geometrically-thin debris disk model where the central star is the only heating source and the dust is distributed radially between inner (Rin) and outer (Rout) radii according to a power law for the surface number density. The grains in the disk follow a size distribution with a minimum radius of and a maximum radius of , assumed to be the same throughout the disk. To minimize the free parameters, we assume that the grains are astronomical silicates (Laor & Draine 1993) with a density of 2.5 g cm-3 and are in theoretical collisional equilibrium; i.e. .
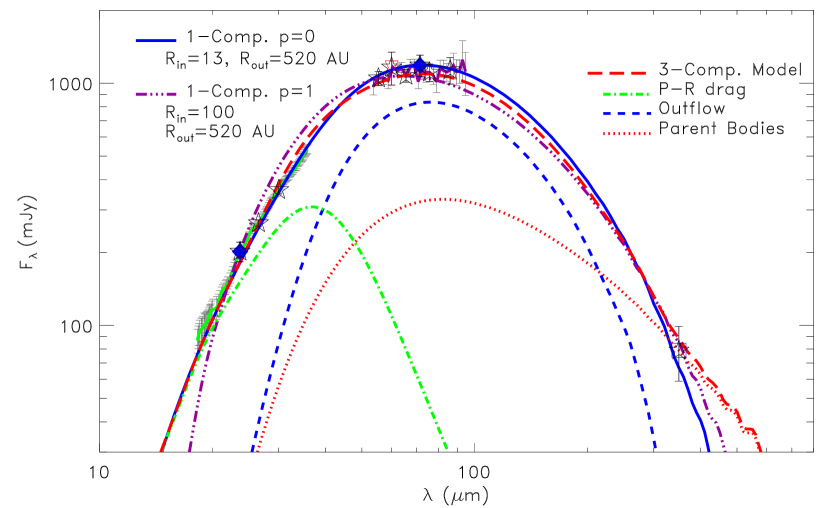
We determined the best-fit Kurucz model for the stellar photosphere by fitting the optical to near-IR photometry (Su et al. 2006), and estimated the stellar temperature and luminosity to be 9750 K and 28.6 L☉. With these stellar parameters, grains smaller than 5 are subject to radiation pressure blowout since , the ratio between radiation and gravitational forces (Burns et al. 1979), is 0.5. To capture the slope of the IRS spectrum and MIPS SED-mode data, we selected two points (26.5 and 30 ) in the IRS spectrum and four wavelengths (55.4, 65.6, 75.8, and 86.0 ) in the MIPS SED-mode data for the global SED fitting. Combined with the broadband photometry, a total of ten data points shown as stars in Figure 3 are used to compute to determine the best-fit debris disk model.
To fit the fairly flat slope between 55 and 95 and the observed flux at 350 simultaneously, the maximum grain size has to be 100 . This might be an artifact of the assumption that the grains have the same size distribution throughout the disk (see §4). In addition, since there are no obvious silicate features, the majority of the grains in the disk are larger than a few microns. Therefore, we assume to be the blowout size, 5 , and to be 63 , and that the disk has a constant surface density consistent with a Poynting-Robertson (P-R) drag dominated disk. With these grain properties and density distribution, the SED is consistent with a 1-component disk with an inner radius of 13 AU and outer radius of 430AU. However, a P-R drag dominated disk is not expected physically given the high disk density (fractional luminosity 910-5) since collisions should destroy grains before they can spiral inward (Wyatt 2005).
We also explored the possibility of fitting the SED with an outflow disk, in which the majority of the grains are smaller than the blowout size and the surface density follows a power law (e.g., the Vega debris disk; Su et al. 2005). Various combinations of , , Rin and Rout were tried, and none yield a correct spectral slope between 20–30 (one example is shown in Figure 3). In addition, because smaller grains have higher temperatures than larger ones at the same radius, models including grains smaller than the blowout size force Rin to be a large distance (100 AU=34), contradicting the observed compact core of the disk. This suggests that the Oph system cannot be an outflow disk entirely.
3.3. Debris Disk Imaging Fitting
Limited by the spatial resolutions, no multiple disk components can be distinguished in the observed images except for the extent of the disk. To further constrain the model, we constructed model images with the best-fit SED parameters (=0, 5 , 63 , Rin=13 AU, and Rout=430 AU) from the SED fitting. These model images were then convolved with appropriate PSFs to compare with the observed images based on the FWHMs and radial surface brightness distributions.
For a geometrically thin disk model, the observed disk morphology only depends on how the disk is viewed, i.e., the inclination angle of the disk with respect to the plane of the sky, . We first explored the influence of the outer radius by fixing Rin=13 AU, the grain parameters and =90°. The FWHM24 of the convolved model images with outer radii ranging from 350 to 1000 AU shows no change, but a major-axis FWHM70F of the convolved model images varies from 170 to 204 with the minor-axis FWHM70F of 142. This again confirms that the 24 emission arises from warm grains that are not sensitive to the outer extent of the disk. The observed major-axis FWHM70F of the disk (185) implies a Rout of 520 AU. With the Rin, Rout and grain parameters fixed, we determined the inclination angle by fitting both major- and minor-axis FWHMs. Convolved model images were constructed for face-on (=0°) to edge-on (=90°) disks in increments of 5°. The major-axis FWHMs of the model images remain the same within measurement errors at both 24 and 70 . From 0° to 90°, the minor-axis FWHM24 and FWHM70F changed from 61 to 56 and 176 to 142, respectively. We conclude that the observed FWHMs at 24 and 70 are consistent with a disk viewed at =50°5°.
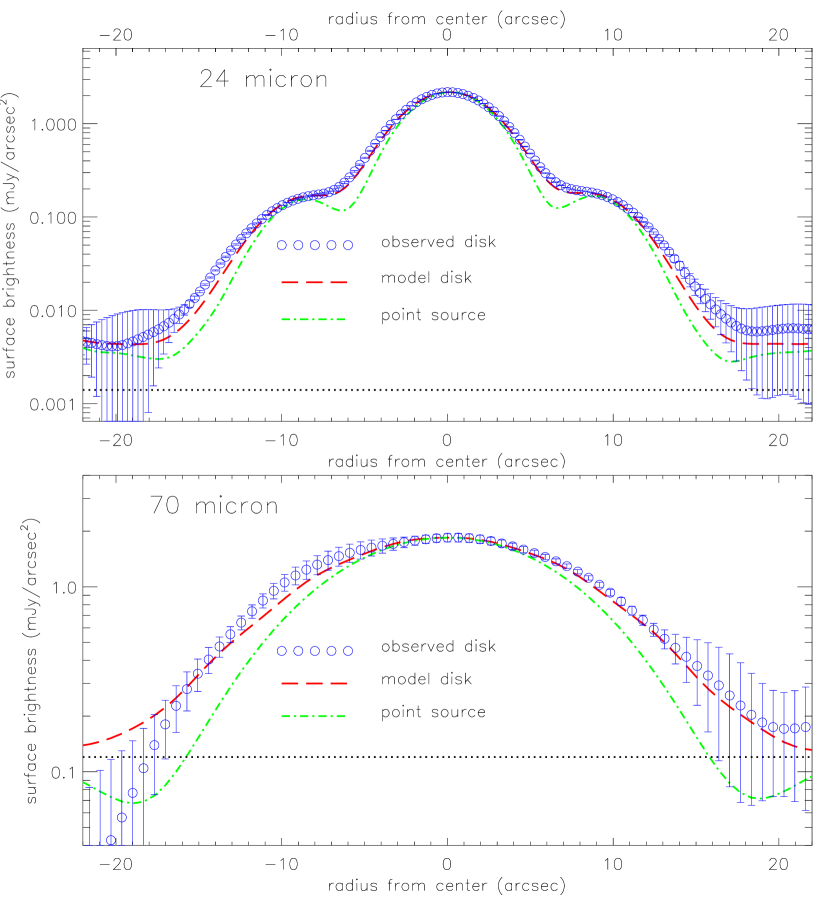
For a quantitative comparison, we show cuts along the disk major axis for both the observed and best-fit model images at 24 and 70 in Figure 4. Similar cuts made on point-source PSFs, scaled to match the peak values of the observations, are also shown. Our simple 1-component, bound-grain debris disk model is in very good agreement with the observed disk surface brightness at 24 over a dynamic range of two orders of magnitude. At 70 , the observed signal-to-noise ratios are not as good as at 24 , but the model agrees to within the estimated uncertainties and approximates the data much better than a point source.
4. Discussion and Summary
Based on the Spitzer images and SED modeling, the disk around Oph has inner and outer boundaries of 13 and 520 AU, respectively, viewed at an inclination angle of 50°, assuming a 1-component constant-surface (=0) density disk consisting of bound (5–63 m) astronomical silicate grains. The dust mass is 1.010-2 M⊕. The star’s projected rotation velocity is 210 km s-1 (Royer et al. 2007), suggesting an equatorial velocity of 256-300 km s-1 with ranging from 55°to 45°. Although these values are very close to the maximum permissible velocity (Gulliver et al. 1994), the estimated disk inclination angle is within the permitted range of plausible stellar inclination angles.
The broadband SED alone provides too little information to constrain properly the variables needed for even the simplest disk models, but a better understanding can be achieved by considering other constraints. The exact Rin of the disk is sensitive to used in the model. The fact that the excess emission starts at 15 suggests that dust exists as close as 10 AU, assuming blackbody radiators. Since the grains in a debris disk are generated by collisional cascades from large (km-size) parent bodies, is usually assumed to be 1000 . To make the single component model consistent with the faint extended disk detected at 70 and with the assumed grain size distribution, has to be reduced to 63 . A more physically realistic model will involve multiple components while requiring the presence of very large grains in the disk.
We used a three-component disk to derive a model consistent with the expected grain physics and the observed spectrum/SED. The three components are: (1) a narrow (R0.1R) ring of parent bodies at 80 AU where large grains are located; (2) an outflow disk (80–520 AU) with density outside the narrow ring consisting of grains being ejected by radiation pressure with sizes smaller than the blowout size; (3) a component with density interior to the narrow ring and extending to 10 AU (e.g., as of grains slowly drifting inward due to P-R drag). Many combinations of parameters in this three-component disk model would yield acceptable fits to the observed data. One example is shown in Figure 3, but it is not unique without further constraints.
Given the exceptionally large disk seen in the Oph images, one may wonder whether it is another Vega-like disk (an outflow disk observed at 24 and 70 extending from a ring of large parent bodies that dominate the emission at 850 , Su et al. 2005). The failure to fit all of the available data with our simple 1-component outflow model suggests that the contribution by grains escaping from the Oph disk is weak, unlike for the Vega disk where such grains dominate the disk emission (100% at 24 and 75% at 70 ). Persuasive evidence of Oph being another Vega-like disk would require the disk size at 350 to be substantially smaller than the size inferred in the infrared. However, the signal-to-noise of the 350 data is too low to show the extent of the emission. Observations at longer submillimeter or millimeter wavelengths and higher spatial resolution are needed to determine the exact location and amount of the cold component.
An attractive comparison sample of debris disks for Oph is defined by systems with stellar ages between 150 and 400 Myr, spectral types between A0V and A3V, and between and , for which Su et al. (2006) find a total of 12 stars222Besides Oph, Vega and Fomalhaut: Cen: T250 K, Lep: T206 K, CrB: T125 K, UMa: T116 K, 30 Mon: T105 K, HD 38056: T96 K, HD 79108 : T88 K, Boo: T86 K, Tri: T75 K. including the resolved disks around Vega and Fomalhaut. The disk around Fomalhaut defines the expected template structure given our knowledge of the solar system. It consists of two separate dust belts: a Kuiper-Belt-analog ring with a radius of 150 AU prominent at 70 and a fair amount of zodiacal-analog warm dust located 20 AU from the star. Little emission originates from outside of the Kuiper Belt ring. In the Fomalhaut disk, the ratio between the central unresolved and the extended emission is 3–6 at 24 (Stapelfeldt et al. 2004), while the ratio is 2–3 in the Oph disk. The Kuiper-Belt-analog ring in the Fomalhaut system totally dominates the emission at 70 , but at the distance of Oph (4 that of Fomalhaut), such a ring would be unresolved.
Two of the twelve systems ( Lep and Cen) have 24 to 70 color temperatures 200 K (Su et al. 2006). Ground-based 20 imaging of Lep shows it to be dominated by a very compact inner warm disk (Moerchen et al. 2007). Three more systems (30 Mon, UMa, CrB) have color temperatures of 100–150 K, indicating relatively large amounts of material in their inner zones. All of these systems are likely to have more debris-generating activity close to the star than the disks around Fomalhaut (color temperature of 70 K) or Oph. Of the remaining seven systems, at least two have anomalous activity in their outer zones: Vega with its large (800 AU) halo, and Oph with a disk 520 AU in radius.
It appears that much of the overall debris disk behavior can be explained as the result of similar evolution from starting points that differ in the initial disk mass (Wyatt et al. 2007b). However, the large variety in behavior among the sample of twelve middle-aged disks demonstrates that one or more additional parameters must also be at play. For instance, the presence and number of massive planets, the recent collisional history of the system (Kenyon & Bromley 2005, 2006), as well as the variety in the initial disk size may all play important roles in the wealth of disk behavior.
References
- Burns et al. (1979) Burns, J. A., Lamy, P. L., & Soter, S. 1979, Icarus, 40, 1
- Chen et al. (2006) Chen, C. H., et al. 2006, ApJS, 166, 351
- Engelbracht et al. (2007) Engelbracht, C. W., et al. 2007, PASP,119, 994
- Fajardo-Acosta et al. (1997) Fajardo-Acosta, S. B., Stencel, R. E., & Backman, D. E. 1997, ApJ, 487, L151
- Gulliver et al. (1994) Gulliver, A. F., Hill, G., & Adelman, S. J. 1994, ApJ, 429, L81
- Gordon et al. (2005) Gordon, K. D., et al. 2005, PASP, 117, 503
- Gordon et al. (2007) Gordon, K. D., et al. 2007, PASP, 119, 1019
- Kenyon & Bromley (2005) Kenyon, S. J., & Bromley, B. C. 2005, AJ, 130, 269
- Kenyon & Bromley (2006) Kenyon, S. J., & Bromley, B. C. 2006, AJ, 131, 1837
- (10) Kenyon, S. J & Bromley, B. C., 2008, submitted.
- Laor & Draine (1993) Laor, A. & Draine, B. T. 1993, ApJ, 402, 441
- Lu et al. (2008) Lu, N., et al. 2008, astro-ph 0802.3723
- Moerchen et al. (2007) Moerchen, M. M., Telesco, C. M., Packham, C., & Kehoe, T. J. J. 2007, ApJ, 655, L109
- Rieke et al. (2005) Rieke, G. H., et al. 2005, ApJ, 620, 1010
- Royer et al. (2007) Royer, F., Zorec, J., & Gómez, A. E. 2007, A&A, 463, 671
- Sadakane & Nishida (1986) Sadakane, K., & Nishida, M. 1986, PASP, 98, 685
- Song et al. (2001) Song, I., Caillault, J.-P., Barrado Y Navascués, D., & Stauffer, J. R. 2001, ApJ, 546, 352
- Stapelfeldt et al. (2004) Stapelfeldt, K. R., et al. 2004, ApJS, 154, 458
- Su et al. (2005) Su, K. Y. L., et al. 2005, ApJ, 628, 487
- Su et al. (2006) Su, K. Y. L., et al. 2006, ApJ, 653, 675
- Trilling et al. (2008) Trilling, D. E., et al. 2008, ApJ, 674, 1086
- Wyatt (2005) Wyatt, M. C. 2005, A&A, 433, 1007
- Wyatt et al. (2007a) Wyatt, M. C., Smith, R., Greaves, J. S., Beichman, C. A., Bryden, G., & Lisse, C. M. 2007a, ApJ, 658, 569
- Wyatt et al. (2007b) Wyatt, M. C., Smith, R., Su, K. Y. L., Rieke, G. H., Greaves, J. S., Beichman, C. A., & Bryden, G. 2007b, ApJ, 663, 365