Overdensity of -Dropout Galaxies in the Subaru Deep Field:
A Candidate Protocluster at 11affiliation: Based on data collected at Subaru Telescope, which is operated by National Astronomical Observatory of Japan. 22affiliation: Some of the data presented herein were obtained at the W.M. Keck Observatory, which is operated as a scientific partnership among the California Institute of Technology, the University of California and the National Aeronautics and Space Administration. The Observatory was made possible by the generous financial support of the W.M. Keck Foundation.
Abstract
We investigate the sky distribution of Lyman break galaxies selected as -dropouts having down to in the Subaru Deep Field (SDF). We discover 37 -dropouts clustered in a projected comoving Mpc2 region at , showing a local density excess. Carrying out follow-up spectroscopy, we identify four of them as Ly emitters at , 6.01, 6.03 and 6.03 (spread over a distance of 46.6 Mpc). The number density of the cluster itself in SDF is Mpc-3, smaller than those of protoclusters (i.e., forming galaxy clusters) at –5.7. Also, the structure shows –21 times larger galaxy number density than those of galaxies in a general field. It has a mass of , comparable to those of –5 protoclusters. Since the contamination of our sample by interlopers is estimated to be quite low, 5.9%, most of the other unconfirmed -dropouts in the overdense region can be also galaxies. Hence, it could be a candidate forming cluster at , representing a progenitor of galaxy clusters seen in the recent-day Universe.
1 Introduction
Observations of high- star-forming galaxies such as Ly emitters (LAEs) and Lyman break galaxies (LBGs) have been used to search for large-scale structures and primeval forming galaxy clusters—protoclusters—at high redshifts. Starting from the discovery of protoclusters made of these galaxies at –3 (Malkan et al., 1996; Pascarelle et al., 1996; Giavalisco et al., 1994; Le Févre et al., 1996; Steidel et al., 1998), subsequent searches at higher redshifts have achieved remarkable success finding large-scale structures up to –5.7 (Overzier et al., 2006; Venemans et al., 2007; Shimasaku et al., 2003; Kashikawa et al., 2007; Malhotra et al., 2005; Ouchi et al., 2005). Several attempts have been made to search for even higher- galaxy clustering targeting fields around quasars, but only two possible such system has been found (Stiavelli et al., 2005; Willott et al., 2005; Zheng et al., 2006; Ajiki et al., 2006).
To study galaxy clustering at even larger lookback time (i.e., ), we have selected galaxy candidates by the -band dropout technique, in the Subaru Deep Field (Kashikawa et al., 2004, SDF; , ; an area of arcmin2), taking the full advantage of its extremely wide and deep optical images. The present paper reports our finding of -dropout overdensity that could be a protocluster at , and our follow-up spectroscopy of some of the -dropouts forming this overdense structure. In §2, we describe the data used for our photometry as well as our -dropout sample selection. The sky distribution of -dropouts in SDF is analyzed statistically in §3. §4 presents the result of the follow-up spectroscopy. Finally, discussion and conclusion are given in §5 and 6. Throughout we adopt an cosmology and AB magnitude with aperture unless otherwise specified.
2 -Dropout Sample
2.1 Sample Selection
We used official catalogs888Available from http://step.mtk.nao.ac.jp/sdf/data/ of the objects detected in SDF, for which each of the deep images was taken by one pointing of the Subaru Prime Focus Camera (Miyazaki et al., 2002, Suprime-Cam) on the 8.2m Subaru telescope. All the images were convolved to have common seeing size of . Source detection and photometry in each waveband were performed by using SExtractor version 2.1.6 (Bertin & Arnouts, 1996) and the limiting magnitudes in our aperture at are . The aperture and total magnitudes were measured with MAG_APER and MAG_AUTO parameters, respectively. From the objects detected down to , we selected 158 -dropouts by using the criteria: , , . Null detections () in and were required since the flux of a LBG blueward of Ly should be absorbed by the intergalactic medium. Our criterion picks up galaxies having Lyman breaks at –7.1, based on calculations using population synthesis models (Bruzual & Charlot, 2003; Madau, 1995). This model calculation also shows that there could be weak remainig fluxes not completely absorbed by the intergalactic medium in the -band wavelength of galaxies’ spectra. Hence, we did not require a null detection in . All the magnitudes fainter than 28.62 ( limits) were replaced by this value in application of the selection criteria.
2.2 Contamination from Interlopers
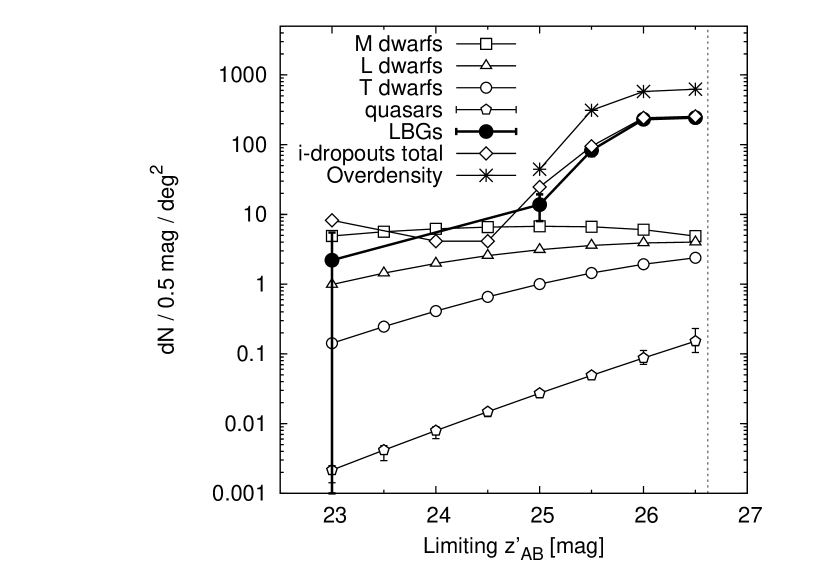
The problem in selecting galaxies without near-infrared images is contamination. Three different types of interlopers could satisfy ; dwarf stars with spectral type later than M7 (Hawley et al., 2002), –2 old elliptical galaxies called Extremely Red Objects (EROs) with 4000Å Balmer break in -band and quasars with Ly absorption. We evaluated fractions of these interlopers in our sample using the same method as Ota et al. (2005): using a star count model (Nakajima et al., 2000), old elliptical ERO samples actually observed in Subaru/XMM-Newton Deep Survey (Miyazaki et al., 2003) and Hubble Ultra Deep Field (UDF) (Yan et al., 2004), and a quasar luminosity function (Yan & Windhorst, 2004). The calculated number counts of each interloper as well as LBG are shown in Figure 1. Most (%) of the -dropouts in SDF are fainter than . The possible fractions of dwarfs, EROs and quasars in are only 5.9%, 0% and 0.12%, respectively. If we consider cosmic variance of ERO number density (Somerville et al., 2004) and Poisson error for 0 (Gehrels, 1986), the upper limit of ERO fraction could be % in SDF survey area if these EROs satisfy . However, Malhotra et al. (2005) also confirmed that no ERO shows color (See their §3 and Fig.1) based on their spectroscopy of -dropouts in UDF. Hence, we ignore the ERO contamination in the subsequent analyses and discussions. The low contamination rate estimated here is consistent with the fact that our follow-up spectroscopy did not reveal any candidates to be interlopers (See §4).
3 Sky Distribution
3.1 Discovery of A Local Surface Overdensity
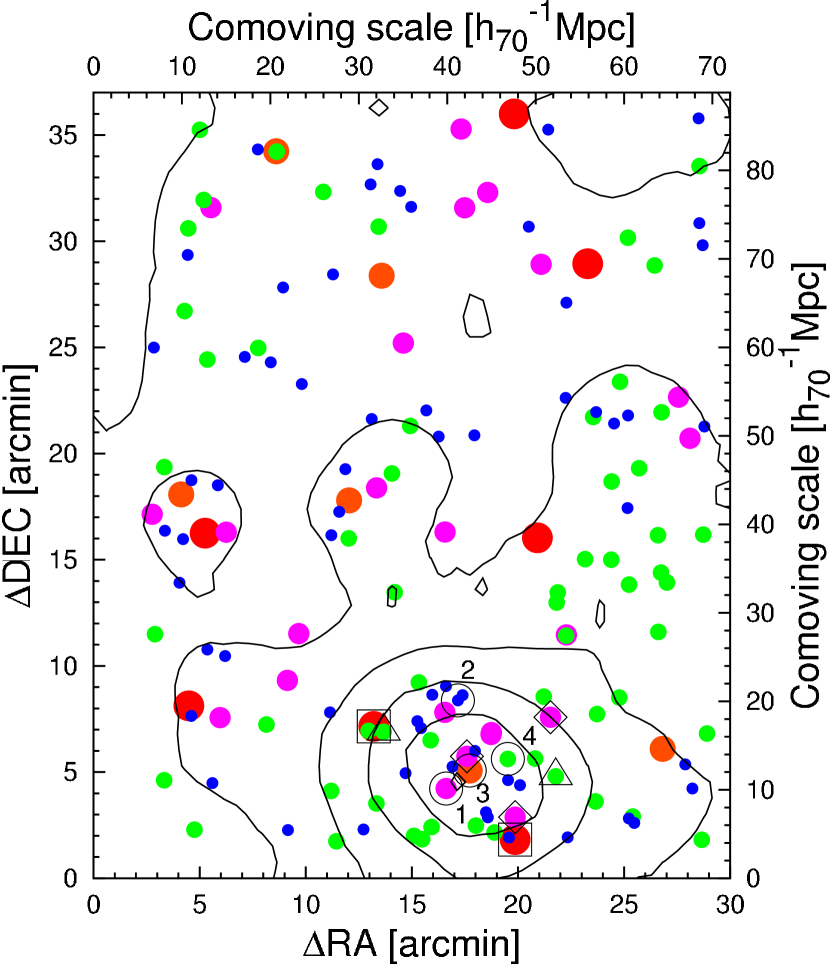
The sky distribution of 158 -dropouts in SDF is shown in Figure 2. A very interesting region in the south shows a significant overdensity of these -dropouts which may be a protocluster at . To verify the significance of this compared to other regions quantitatively, we measured the degree of density excess, , the overdensity of -dropouts in a circle of 20 Mpc comoving radius at defined as (Peebles, 1980). Here, and are the number of objects in the circle and the mean of values measured in circles at 2000 randomly chosen positions in the image of SDF, respectively. We obtained with significance for the region of our interest. This value is much higher than those of any other places in SDF, and comparable to that of protoclusters found by Ouchi et al. (2005). This area also shows the highest density contrast: with 5 excess measured in a comoving 8 Mpc circle. This value is comparable to those for a structure found by Shimasaku et al. (2003, 2004) and protoclusters by Ouchi et al. (2005). We found 56 and 22 -dropouts in 20 Mpc and 8 Mpc circles, respectively.
The overdense region contains two extremely bright ( and 22.16) -dropouts that might be quasars or dwarf stars as seen in Figure 2. They could be part of a system consisting of LAEs physically associated with one or two quasars at , although these bright -dropouts are more plausibly dwarf stars.
In the SDF, galaxy candidates had been also selected by two different techniques. Shimasaku et al. (2005) made and filters splitting the waveband at 9500Å and selected out LBG candidates in the vs. color plane down to . Meanwhile, Shioya et al. (2005) detected –6.5 LBG candidates (NB816-dropouts) using the vs. NB816 color diagram down to , where NB816 is a narrowband filter centered at 8150Å with FWHM of 120Å. Our overdensity region includes three such -detected objects out of 14 -dropouts down to (total mag) assuming it is comparable to ( on average; see Table 2 in Shimasaku et al. (2005)) and two NB816-dropouts out of 14 -dropouts down to . They are regarded as more plausible galaxy candidates at . Note that since their candidate selections adopt null detection in -band (–), we also limited our sample to – in the comparison.
4 Follow-up Spectroscopy
To obtain information about the physical clustering and to check the validity of our sample selection, we obtained spectra of 20 -dropouts in the overdense region with Faint Object Camera and Spectrograph (Kashikawa et al., 2002, FOCAS) on the Subaru Telescope and the DEIMOS spectrograph (Faber et al., 2003) on the Keck II Telescope. Spectroscopy of these -dropouts is summarized in Table 1, and in Kashikawa et al. (2006), Iye et al. (2006) and Ota et al. (2008).
We identified four -dropouts as LAEs at similar redshifts , 6.01, 6.03 and 6.03. The emission lines found in their spectra are asymmetric with their blue side absorbed and have weighted skewness of –17.9Å, comparable to the values of and 6.6 LAEs, –20.66Å and –16.34Å (See Table 2 and Shimasaku et al. (2006) and Kashikawa et al. (2006)). Since each of the four spectra shows only one emission line, the line is not H, [OIII]4959Å, [OIII]5007Å, H, [SII]6717Å or [SII]6731Å. Also, the emission lines we found are not the [OII] doublet with 7Å separation (3726Å and 3727Å at rest frame) because we actually resolved even closer (5–6Å) skylines in the same wavelength range. In addition, the objects are not active galactic nuclei, since we did not find NV 1240Å lines at 8680Å. Also, FWHMs of the 4 confirmed emssion lines are 367–464 km s-1 and much smaller than the average FWHM of quasars’ Ly lines, km s-1 (Fan et al., 2004). Hence, we consider all the emission lines we detected to be Ly of LAEs. The photometric and spectroscopic properties of four confirmed LAEs as well as their spectra, are presented in Table 2 and Figure 3. Their sky distribution is shown in Figure 2.
Spectra of 15 out of 16 unconfirmed -dropouts were obtained during the 2005 run whose main targets were other brighter objects, and thus integration times were rather short (only 1.25–3.75 hours) for our faint (–26.5) -dropouts. Hence, if the Ly lines are absent or overlapped with OH-airglow lines, identification is much harder. Thus, we cannot completely deny the possibility of these unconfirmed -dropouts being galaxies at . None of the 20 spectroscopic targets turned out to be low- emission-line galaxies. Hence, the possible contamination of low- galaxies in our photometric -dropout sample seems very rare.
5 Discussion
Analyses of the overdense region implies that it might be a protocluster. In the following discussion, we estimate the basic properties of the overdense region and compare them with those of protoclusters and field galaxies to see if it can be a protocluster that is a progenitor of galaxy clusters seen in the present-day universe.
5.1 Number Density of the Cluster Itself
Since we have probed the comoving depth of 887 Mpc (corresponding to –7.1 of -dropout selection function) and area of SDF (876 arcmin2), our survey volume is approximately Mpc3. Since we found only one overdensity in this volume, its number density is estimated to be Mpc-3. This is smaller than those of protoclusters at lower-; e.g., Mpc-3 at (Ouchi et al., 2005), Mpc-3 at (Shimasaku et al., 2003), Mpc-3 at –5 (Venemans et al., 2007), Mpc-3 at (Steidel et al., 1998, converted to our cosmology). The smaller number density might be because forming clusters are not virialized yet and difficult to identify at higher redshifts as implied by hierarchical clustering scenario.
5.2 Galaxy Number Density
If we define the border of the overdense region as the place where the density contrast drops to the half of unity , its size is ( comoving Mpc2 at ), approximately within – and – in Figure 2. There are a total of 37 -dropouts in it. Four of them are identified as LAEs, of which one has . Also, two bright objects might be dwarf stars or quasars. Since the contamination rate of dwarfs in is expected to be 5.9% (See §2.2), 32 out of the remaining 34 -dropouts in can be galaxies. Hence, we assume that the overdensity consists of 33 galaxies at . If we assume the line-of-sight scale of the overdensity corresponds to –6.03 of confirmed LAEs (46.6 comoving Mpc), its volume would be Mpc3. This gives the galaxy number density of Mpc-3. The uncertainty is large since it includes Poisson errors as well as large cosmic variance due to the small volume. Cosmic variance is estimated in the same way as in Ota et al. (2008). For comparison, we calculated the number density of galaxies in the general field and obtained Mpc-3 (same uncertainty as above) by integrating the best-fit Schechter luminosity function (LF) (Schechter, 1976) of -dropouts derived by Bouwens et al. (2006) down to (corresponding to our detection limit ). Thus, the overdensity region has about four times () higher surface density than galaxies in a field. Note that this factor and are lower limits because the incompleteness regarding -dropout selection is not taken into account. Hence, those values could be larger if the incompleteness were corrected.
5.3 Star Formation Rate
We estimate the average UV star formation rate (SFR) of the overdense region, excluding two bright -dropouts that might be dwarfs or quasars and assuming that all the rest of 33 -dropouts (corrected for contamination) are galaxies at . Their rest frame UV continuum luminosities, , are calculated from -band total magnitudes and converted to SFR at 1500Å, using the formalism of Madau et al. (1998): erg s-1 Hz-1. This yields the average SFR of yr-1. Meanwhile, the average SFR of 116 -dropouts with the same magnitude cuttoff of (total mag) outside the overdense region in SDF is yr-1. This implies that star formation activity in the the overdense region does not differ much from that in a general field.
5.4 Mass Estimate
Now that the galaxy overdensity is known, we can estimate the mass of the overdensity region with (Steidel et al., 1998; Venemans et al., 2005). Here, Mpc-3 is the mean matter density of the Universe with gravitational constant . Mpc3 is the volume of the candidate protocluster. is the mass overdensity related to the bias parameter with . , where in our cosmology, corrects the volume for redshift space distortion due to peculiar motions of protocluster galaxies (Steidel et al., 1998; Venemans et al., 2005). Using and suggested by Ouchi et al. (2005), we estimate that and thus . Our estimated mass is comparable to the mass of the protocluster, (1–, estimated by Venemans et al. (2002), that of the LBG concentration, (0.98– by Steidel et al. (1998), those of –5 protoclusters, (2–, by Venemans et al. (2007), and that of a protocluster, , by Shimasaku et al. (2003). According to the large sample statistics (152–170 clusters) of nearby () galaxy clusters studied by Girardi et al. (1998a, b), our overdensity mass is also comparable to their masses. Moreover, the estimated mass and number density of the overdensity measured in §5.1 are consistent with mass functions derived from large samples of –300 –0.2 nearby galaxy clusters (Girardi et al., 1998b; Bahcall et al., 2003; Rines et al., 2007). Hence, like other lower- protoclusters, it might be an ancestor of a cluster of galaxies seen in the present-day Universe.
6 Conclusion
The number density, number density of member galaxies and mass of the -dropout overdensity in SDF imply that there exist forming clusters—protoclusters—at a redshift as high as . However, the result presented here is based on photometry and a few spectroscopically identified LAEs at –6.03. Hence, the overdensity is still a ”candidate” protocluster. Further follow-up deep spectroscopy of the unconfirmed -dropouts will reveal if it is a real protocluster and constrain its physical properties.
References
- Ajiki et al. (2006) Ajiki, M. et al. 2006, PASJ, 58, 499
- Bahcall et al. (2003) Bahcall, N. A. et al. 2003, ApJ, 585, 182
- Bertin & Arnouts (1996) Bertin, E., & Arnouts, S. 1996, A&A, 117, 393
- Bouwens et al. (2006) Bouwens, R.J., Illingworth, G.D., Blakeslee, J.P., & Franx, M. 2006, ApJ, 653, 53
- Bruzual & Charlot (2003) Bruzual, A.G., & Charlot S. 2003, MNRAS, 344, 1000
- Faber et al. (2003) Faber, S.M. et al. 2003, Proc. SPIE, 4841, 1657
- Fan et al. (2004) Fan, X. et al. 2004, AJ, 128, 515
- Gehrels (1986) Gehrels, N., 1986, ApJ, 303, 336
- Giavalisco et al. (1994) Giavalisco, M., Steidel, C. C., & Szalay, A. S. 1994, ApJ, 425, L5
- Girardi et al. (1998a) Girardi, M., Giuricin, G., Mardirossian, F., Mezzetti, M., & Boschin, W. 1998, ApJ, 505, 74
- Girardi et al. (1998b) Girardi, M., Borgani, S., Giuricin, G., Mardirossian, F., & Mezzetti, M. 1998, ApJ, 506, 45
- Hamuy et al. (1994) Hamuy, M., Suntzeff, N.B., Heathcote, S.R., Walker, A.R., Gigoux, P., & Phillips, M.M. 1994, PASP, 106, 566
- Hawley et al. (2002) Hawley, S.L. et al. 2002, AJ, 123, 3409
- Iye et al. (2006) Iye, M. et al. 2006, Nature, 443, 186
- Kashikawa et al. (2002) Kashikawa, N. et al. 2002, PASJ, 54, 819
- Kashikawa et al. (2004) Kashikawa, N. et al. 2004, PASJ, 56, 1011
- Kashikawa et al. (2006) Kashikawa, N. et al. 2006, ApJ, 648, 7
- Kashikawa et al. (2007) Kashikawa, N., Kitayama, T., Doi, M., Misawa, T., Komiyama, Y., & Ota, K. 2007, ApJ, 663, 765
- Kennicutt (1998) Kennicutt, R.C., Jr., 1998, ARA&A, 36, 189
- Le Févre et al. (1996) Le Févre, O., Deltorn, J. M., Crampton, D., & Dickinson, M. 1996, ApJ, 471, L11
- Madau (1995) Madau, P. 1995, ApJ, 441, 18
- Madau et al. (1998) Madau, P., Pozzetti, L., & Dickinson, M. 1998, ApJ, 498, 106
- Malhotra et al. (2005) Malhotra, S. et al. 2005, ApJ, 626, 666
- Malkan et al. (1996) Malkan, M. A., Teplitz, H., & McLean, I. S. 1996, ApJ, 468, L9
- Miyazaki et al. (2002) Miyazaki, S. et al. 2002, PASJ, 54, 833
- Miyazaki et al. (2003) Miyazaki, M. et al. 2003, PASJ, 55, 1079
- Nagao et al. (2005) Nagao, T. et al. 2005, ApJ, 634, 142
- Nagao et al. (2007) Nagao, T. et al. 2007, A&A, 468, 877
- Nakajima et al. (2000) Nakajima, T. et al. 2000, AJ, 120, 2488
- Oke (1990) Oke, J.B. 1990, AJ, 99, 1621
- Ota et al. (2005) Ota, K., Kashikawa, N., Nakajima, T., & Iye, M. 2005, JKAS, 38, 179
- Ota et al. (2008) Ota, K. et al. 2008, ApJ, 677, 12
- Ouchi et al. (2005) Ouchi, M. et al. 2005, ApJ, 620, L1
- Overzier et al. (2006) Overzier, R.A. et al. 2006, ApJ, 637, 58
- Pascarelle et al. (1996) Pascarelle, S. M., Windhorst, R. A., Driver, S. P., Ostrander, E. J., & Keel, W. C. 1996a, ApJ, 456, L21
- Peebles (1980) Peebles, P. J. E. 1980, The Large-Scale Structure of the Universe (Princeton: Princeton University Press)
- Rines et al. (2007) Rines, K., Diaferio, A., & Natarajan, P. 2007, ApJ, 657, 183
- Reiprich & Bhringer (2002) Reiprich, T.H., & Bhringer, H. 2002, ApJ, 567, 716
- Schechter (1976) Schechter, P. et al. 1976, ApJ, 203, 297
- Shimasaku et al. (2003) Shimasaku, K. et al. 2003, ApJ, 586, L111
- Shimasaku et al. (2004) Shimasaku, K. et al. 2004, ApJ, 605, L93
- Shimasaku et al. (2005) Shimasaku, K., Ouchi, M., Furusawa, H., Yoshida, M., Kashikawa, N., & Okamura, S. 2005, PASJ, 57, 447
- Shimasaku et al. (2006) Shimasaku, K. et al. 2006, PASJ, 58, 313
- Shioya et al. (2005) Shioya, Y. et al. 2005, PASJ, 57, 569
- Somerville et al. (2004) Somerville, R.S., Lee, K., Ferguson, H.C., Gardner, J.P., Moustakas, L.A., Giavalisco, M. 2004, ApJ, 600, 171L
- Steidel et al. (1998) Steidel, C. C., Adelberger, K. L., Dickinson, M., Giavalisco, M., Pettini, M., & Kellogg, M. 1998, ApJ, 492, 428
- Stiavelli et al. (2005) Stiavelli, M. et al. 2005, ApJ, 622, L1
- Venemans et al. (2002) Venemans, B.P. et al. 2002, ApJ, 569, L11
- Venemans et al. (2005) Venemans, B.P. et al. 2005, A&A, 431, 793
- Venemans et al. (2007) Venemans, B.P. et al. 2007, A&A, 461, 823
- Willott et al. (2005) Willott, C.J., Percival, W.J., McLure, R.J., Crampton, D., Hutchings, J.B., Jarvis, M.J., Sawicki, M., & Simard, L. 2005, ApJ, 626, 657
- Yan et al. (2004) Yan, H. et al. 2004, ApJ, 616, 63
- Yan & Windhorst (2004) Yan, H., & Windhorst, R.A. 2004, ApJ, 600, L1
- Zheng et al. (2006) Zheng, W. et al. 2006, ApJ, 640, 574
| Ob | ID | date | seeing | exposure | I | grating | wavelength | filter | slit | standard starse | |
|---|---|---|---|---|---|---|---|---|---|---|---|
| (HST) | (′′) | (seconds) | (mm-1) | (nm) | (′′) | ||||||
| 2a | 1 | 24–27 Apr 2004c | 0.4–0.8 | 16200 | F | 300 | 1300 | 540–1000 | 0.6 | Hz 44, Feige 34 | |
| 8a | 0 | 14–15 May, 1 Jun 2005d | 0.5–1.0 | 13500 | F | 175 | 1600 | 830–1000 | SDSS | 0.8 | Hz 44, Fiege 34, Feige 110 |
| 4 | 1 | 14–15 May, 1 Jun 2005d | 0.5–1.0 | 9000 | F | 175 | 1600 | 830–1000 | SDSS | 0.8 | Hz 44, Fiege 34, Feige 110 |
| 5 | 0 | 14–15 May 2005d | 0.5–1.0 | 4500 | F | 175 | 1600 | 830–1000 | SDSS | 0.8 | Fiege 34, Feige 110 |
| 2 | 2b | 23–24 Apr 2004c | 0.6–1.0 | 9000 | D | 830 | 3600 | 500–1000 | GG495 | 1.0 | Feige 110, BD+28∘4211 |
| Object and Coordinate | |||||||||
|---|---|---|---|---|---|---|---|---|---|
| (mag) | (mag) | (Å) | (10-17erg s-1 cm-2) | (1043erg s-1) | (M⊙ yr-1) | (Å) | (Å) | ||
| (1) SDF J132418.4+271633a | 5.92 | 27.30 | 25.74 | 13.5 | 36 | ||||
| (2) SDF J132429.0+271918a | 6.01 | 28.62 | 26.29 | 11.2 | 30 | ||||
| (3) SDF J132426.5+271600b,c | 6.03 | 27.43 | 25.36 | 13.2 | 84 | ||||
| (4) SDF J132431.5+271509b | 6.03 | 27.83 | 25.88 | 14.2 | 81 |