22institutetext: INAF Istituto di Radioastronomia, via P.Gobetti 101, I-40129 Bologna, Italy
33institutetext: INAF - Osservatorio Astronomico di Cagliari, Loc. Poggio dei Pini, Strada 54, 09012 Capoterra (CA), Italy
44institutetext: Dipartimento di Astronomia, Universita’ di Bologna, via Ranzani 1, 40127 Bologna, Italy
The dynamical state of A548 from XMM-Newton data: X-ray and radio connection
Abstract
Context. We present a detailed study of the X-ray properties of the galaxy cluster Abell 548b (z=0.04), using XMM-Newton data, and discuss the connection between the thermal properties and the presence of two extended relic radio sources located at the cluster periphery.
Aims. We wish to analyze the dynamical state of the cluster and confirm the presence of a major merger. We will discuss the merger effects on the extended nonthermal emission.
Methods. We analyzed the X-ray brightness distribution, the surface brightness profiles in different directions, and the spectral properties in several cluster regions. Moreover, to better understand the dynamical history of this cluster, we performed an optical analysis of the cluster galaxies.
Results. From the analysis of the temperature distribution and of the surface brightness profiles, we find evidence of a shock in the northern cluster region, just before the location of the two extended peripheral relics. From the optical analysis, we find that the cluster galaxies show a large , and two components are needed to fit their velocity distribution. Observational results were compared with a cluster simulation. The maps of gas temperature and density distribution from the simulation agree with the observational data in the case of a cluster merger nearly perpendicular to the plane of the sky and in the state after the maximum core collapse.
Conclusions. We conclude that we are observing a galaxy cluster in a major merger phase, just after the maximum core collapse. The mass ratio is about 1:2, and the merger collision is nearly perpendicular to the plane of the sky. A shock is present in the northern cluster region, and it is very likely responsible for the electron reacceleration and the magnetic field amplification that will give cause the cluster relics. The relative position of the shock and the relics is strongly affected by projection effects.
Key Words.:
galaxies:cluster:individual: Abell 548b observation -X ray1 Introduction
Cluster formation is a still active process in the local Universe. Galaxy clusters exhibit small-and large-scale substructures that clearly indicate of merging activity with other clusters or groups of galaxies. The X-ray observations of the thermal gas in galaxy clusters allow us to study the hot intra cluster medium (ICM), which is the main baryon source in the Universe. Thanks to the XMM-Newton and Chandra observations, we can obtain detailed temperature distributions of the ICM and understand the influence of the cluster’s formation history on the thermodynamics of the IGM.
The galaxy cluster Abell 548b (z =0.04) is a merging cluster with two extended radio relics (A and B), located in a cluster peripheral region, on the same side with respect to the cluster center, and another possible relic source of small size (C), near in projection to the cluster center (Feretti et al. 2006). These diffuse radio sources have no obvious connection to cluster galaxies, but are rather associated with the ICM.
Diffuse cluster radio sources appear to fall into two categories: halos, which are centrally located in the cluster, relatively regular in shape, and unpolarized, and relics which are peripherally located, fairly elongated, irregular and often highly polarized. The presence of these large regions (300-600kpc), which show a diffuse synchrotron emission, reveal the existence of a large-scale magnetic field and of relativistic particles in the cluster volume. These nonthermal components have earned a lot of attention in the last years since their formation and evolution is connected to the cluster’s dynamical history, and therefore they are important for a complete description of the ICM.
Present models of the origin of relics suggest that they are tracers of merger shocks. Relativistic particles are accelerated by shocks either by diffusive shock acceleration or adiabatic recompression of fossil radio plasma (Ensslin and Bruggen 2002;Hoeft & Bruggen 2007). The production of outgoing shock waves at the cluster periphery is indeed observed in numerical simulations of cluster merger events (Schindler 2002).
The cluster A548b is located in the cluster system A548, which includes several substructures: A548a, A548b, and A548-2 associated with optical condensations (Davis et al. 1995). The combination of X-ray and optical data show that A548 is a cluster that is still in a formation phase and that has a complex morphology. The ROSAT data, presented by Davis et al. (1995) and by Neumann & Arnaud (1999), indicate that this cluster is in a merging phase, hence not yet dynamically relaxed. A cooling core is clearly not present ( White et al. 1997).
In this paper we present a study of the dynamical state of the galaxy cluster A548b by detailed X-ray analysis with new XMM-Newton data to understand the connection between X-ray properties and the presence of radio relics. In Sect. 2 we present a summary of the radio properties. In Sect. 3 we present the new data, their reduction, and the results of the detailed image and spectral analysis (surface brightness profiles, 2D -model analysis using XMM-Newton and ROSAT data, total temperature profile, temperature profiles in different regions, temperature map). Section 4 gives the relationship between X-ray and radio data. In Sect. 5 we compare our results with optical data and simulations to analyze the dynamical status of the cluster. Results are discussed in Sect. 6, and conclusions are found in Sect. 7.
We assume a concordance cosmology with kms-1Mpc-1, , . At the redshift of the Abell 548b cluster (z = 0.04), the angular scale of 1 corresponds to a linear size of 47 kpc.
2 Summary of radio properties
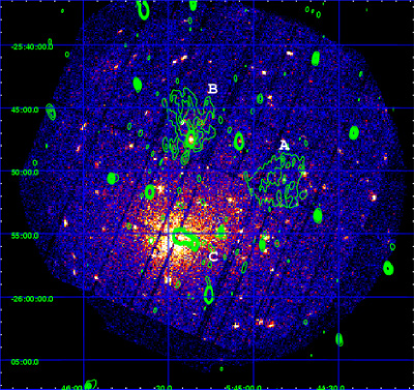
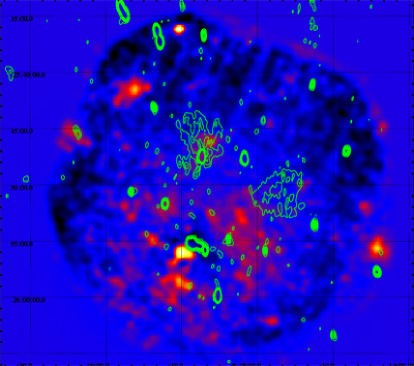
Figure 1 shows the contours of the radio emission at 1.4 GHz, obtained and discussed by Feretti et al. (2006). We concentrate here on the extended diffuse radio sources. A diffuse source, named A, was detected in the western cluster region. This extended source has quite a regular morphology and is not associated with any galaxy. Also diffuse emission, named relic B, was detected in the northern cluster region, around a strong point-like radio source. This extended emission is filamentary and irregular. The embedded radio galaxy is not at the center of the diffuse radio emission, but located at its southern boundary. The two diffuse radio sources A and B are strikingly similar in the total flux density at 1.4 GHz and with similar size. The relics A, B are polarized at a level of 30 per cent. No information about Faraday rotation is available. They have steep spectra, with a spectral index value of -2 1.
Another apparently diffuse source (labeled C) was detected closer to the cluster center, to the northwest, at about 1 from the galaxy triplet VV 162, classified in the literature as a dumbbell galaxy and coincident with the X-ray centroid. The diffuse radio source C is elongated with no obvious optical identification, and it is polarized at a 7% level. At high resolution, it shows a central diffuse emission and two brighter and more compact spots possibly identified with cluster galaxies. No sign of a radio source coincident with the brightest cluster galaxy is detected. The total flux density of this complex in the high-resolution image is only about 1/3 of that in the image at lower resolution, thus indicating a diffuse structure of lower brightness. Therefore, this source has been classified by Feretti et al. (2006) as a relic.
3 X-ray analysis
3.1 Observations and data reduction
Abell 548b was observed on 2006 February 17 with 70 ksec for EPIC MOS cameras and 64 ksec for pn camera. Figure 1 shows the A548b observation of XMM-Newton with the radio relics contours (A,B,C). The pointing position was chosen to be between the cluster center and the position of radio relics to have information on the cluster peripheral region and to study the connection between the X-ray and radio emission. For the data analysis we used the background of J. Nevalainen (Nevalainen et al. 2005). We also checked our results using the background of Lumb et al. (2002) and obtained similar results for temperature and surface brightness profiles. We used the method of double background substraction by Arnaud et al. (2002) (see next section). For the analysis, we used the XMM-Newton data from EPIC cameras (MOS 1,2, and pn) and the XMM-Newton Science Analysis System (SAS) for data reduction. In the MOS 1,2 data set we took into account event patterns 0 to 12 and in pn data – patterns 0 to 4, flag=0. In the spectral analysis, we used the data from three EPIC cameras, while we used only the EPIC cameras MOS2 and pn in the image analysis and 2D beta analysis, because we did not have any statistics in CCD6 for camera MOS1. For background observation, the sky coordinates in the event files were modified using the aspect solution of the cluster observation. From the data counts, we detected and excluded the periods of “flares”. The final observing time after flare subtraction was 45 and 33 ksec respectively. We normalized the background with the count rate of observation in the high energy bands and exposure time of observation. For correction of the vignetting effect in observation and background data, we used the weighted function (Majerowicz et al. 2002). The extended cluster emission was clearly detected, and we analyzed the data in the 0.3-4.5 keV energy band to optimize the signal-to-noise ratio. Visible point-like sources were masked with circles, and excluded from the observational data in our spatial and spectral analysis. We filled these gaps with the mean value of surrounding environment by multiplying by random values from Poisson distribution.

3.2 Double background subtraction
After cleaning the flare events, the XMM background is dominated by the cosmic X-ray background (CXB) and non X-ray background (NXB) induced by high-energy particles. The background subtraction is very crucial when reducing extended diffuse sources. To properly remove it, we used the double-subtraction method by Arnaud et al. (2002). It consists of two steps: (i) we subtracted the corresponding normalized blank field obtained using the same spatial and energy selection (NXB component), and (ii) then we subtracted the residual components using the data in the outer part, outside the cluster (CXB component). The CXB component of the background is affected by vignetting of the X-optics. In the first step we used the background of Nevalainen et al. (2005). In the second step, we minimized the in the outer regions. The background counts were normalized using the count rate of our observation in the high-energy bands and taking the observation exposure time into account.
3.3 X-ray brightness distribution analysis
3.3.1 X-ray image
In Fig. 1 we show the A548b XMM-Newton image (colors) uncorrected for background or exposure. The superposed contour represents the radio emission. The radio relics are named A, B, and C according to Feretti et al. (2006). From this image, it is clear that the cluster emission it extend out to 4 – 5 from the central region in north direction (N) and up to 3 – 4 in south direction (S). The pointing position (see Sect. 3.1) is far from the X-ray peak in the XMM image, and the cluster center is strongly affected by the vignetting effect. For this reason we used the position from the ROSAT image (Bohringer et al. 2004) as the cluster center.
3.3.2 Corrected X-ray image with modeling of background from observation data
In the data analysis of extended X-ray emission from clusters of galaxies, the background estimate and subtraction is very important. In our case we also have the problem that the vignetting effect can seriously affect our data because of the peripheral pointing center.
For all the 2D analysis, we needed to obtain a vignetting-corrected and background-subtracted image. This is specially important since A548b was observed in the border of the field of view where vigneting effects is more significant. Since one component of the background, the CXB, is vignetted by the X-rays optics when the other, the NXB, is not, we need to estimate their relative contribution to be able to subtract them correctly. In the outer region, where the cluster contribution could be neglected, we can model the observation by . Since the vignetting function, , is known from calibration, one can disentangle the CXB from the NXB contribution by fitting this model to the background data in this external region. From this model and our outer region profile, we minimize the to achieve the two components (Solovyeva et al. 2007).
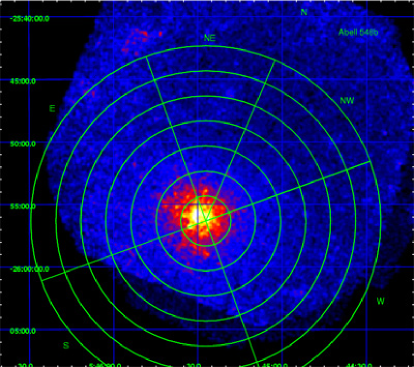
The obtained image of background was subtracted, and we finally corrected our image for the gap and the presence of point sources. We filled the regions where the mask value is zero with the mean value of the surrounding environment by multiplying by random values from Poisson distribution. We then summed the images for cameras MOS2 and PN, excluding the MOS1 camera because of the absence of CCD6. Figure 2 shows the cluster image after the background subtraction, with vignetting, gap, and point sources correction. This image also shows the chosen direction of sectors for study, and the image is smoothed with a Gaussian filter of = 7 .
3.3.3 Surface brightness profile
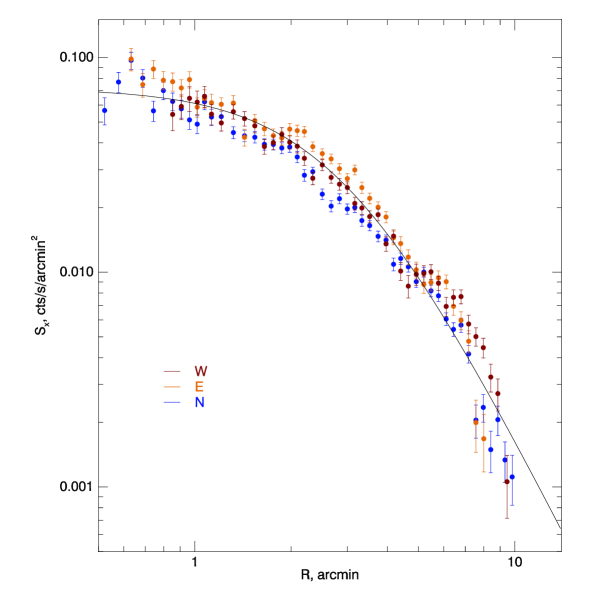
Abell 548b is a non relaxed cluster (Davis et al. 1995), so we did not expect it to show a gas distribution consistent with a single -model. We thus obtained fits with a -model in different directions. We performed a PSF convolution on the beta-model in the fit of the surface brightness profile. In the obtained image for each XMM camera (using standard data reduction, with the background of J. Nevalainen), we summed and rebinned the photons into concentric annuli with a size of 3.3 , centered on the center of the X-ray emission given by Bohringer et al. (2004) (see sect. 3.3.1) for each camera. In Fig. 3a we show the total radial surface brightness profile and the obtained -model fit.
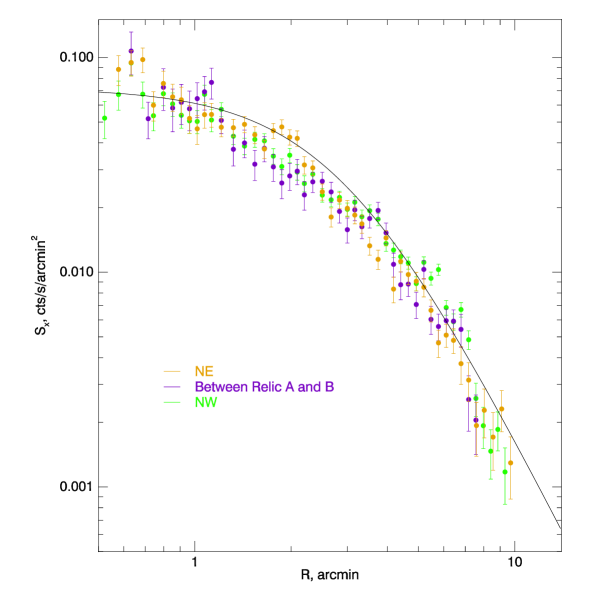
We also derived the surface brightness profiles’ averaging data in three sectors: N, Western (W), and Eastern (E), defined as in Fig. 2. The results are in Fig. 3b. As a second step to obtain more detailed information in the relic’s direction, we obtained surface brightness profiles in sectors NE, NW, and in between the two relics (Fig 3c). The different sectors, except those between the two relics, are shown in Fig. 2. (Note the sector between relics A and B is the angle 45-70 degree if the sector N is the angle 10-110 degree.) We fitted each surface brightness profile with a -model (Cavaliere and Fusco-Femiano 1976). We did not use the first ten points to avoid contamination from the galaxy triplet VV 162, present at the cluster cluster. We note that the brightest cluster galaxy is not identified with any discrete radio source and that no optical counterpart is associated with the extended emission identified as relic C (Feretti et al. 2006 and Sect. 2).
The results of the -model fit are given in Table 1. All the fits at any position angle are poor, as indicated by the high values for the reduced . This agrees with the fact that A548b is a non relaxed cluster. We also compared our results with those of Neumann & Arnaud (1999) obtained from ROSAT, and the comparison confirms that the region where data show the more significant perturbation is at 1.5 and at 5, in each of the directions for our research.
| direction | (arcmin) | /d.o.f | |
|---|---|---|---|
| total | 0.67 | 3.01 | 171/40 |
| West | 0.56 | 2.52 | 96/33 |
| East | 0.80 | 3.91 | 78/34 |
| North | 0.62 | 2.74 | 134/40 |
| North-West | 0.72 | 3.79 | 161/39 |
| North-East | 0.60 | 2.22 | 65/38 |
| Between relics A B | 0.717 | 3.65 | 50/32 |
| Neumann&Arnaud | 0.520.06 | 2.820.04 | 1.35 |
| from 1’ to 5’ | 0.54 | 2.21 | 43/30 |
| Parameter | Best-fitting | |
|---|---|---|
| XMM | Rosat | |
| () | 2.46 | 2.76 |
| () | 2.87 | 3.34 |
| 0.69 | 0.65 | |
| Pa | 1.92 | 1.99 |
| RA | 05:45:29 | 05:45:28 |
| Dec | -25:55:56 | -25:55:58 |
3.3.4 2D- analysis, X-ray residuals
To better analyze the brightness distribution in the cluster, we performed a two-dimensional fit to the cluster brightness using a modified 2D- -model that allows for two different core radii along the two principal axes of the cluster image ellipse. We estimated the deviations from the model, in the inner 6. Figure 4 shows the residuals after the model subraction from the XMM-Newton Gaussian-smoothed image. The residual map is smoothed with a Gaussian of 25 FWHM. If one computes the significance of the structures of this size, we found roughly 10 for each structure inside a 10 arcmin distance from the cluster center.
The same analysis was performed in the ROSAT data and we obtained similar results. In particular from both data sets we obtained a very similar residual map showing a clear decrease in the emission at 1.2, and 7, and an increasing emission at 4.5 around the cluster center, in the relic direction (N and W). This result agrees with the surface brightness profiles obtained at the different directions (Sect. 3.3.2). The best fitting parameters are listed in Table 2. Note that XMM data give better results then ROSAT data since the XMM image was obtained after a more careful subtraction of the background (CXB and NXB components).
The present profile analysis confirms that A548b is a perturbated cluster, with a complex dynamical history. Moreover, we observe an asymmetrical perturbation from the 2D- -model displaced from the cluster center. To better understand the dynamical state of A548b, we need to perform a spectral analysis now.
3.4 Spectral analysis
To perform the spectral analysis of the XMM-Newton data, we used three cameras of XMM-Newton, the background from J. Nevalainen, and the method of double background substraction by Arnaud et al. (2002), and we fitted the spectrum with XSPEC using a redshifted MEKAL plasma emission model with absorbtion (Davis et al. 1995) and abundance = 0.3. Reported errors in the text and tables are at a confidence level.
The best fit to the mean cluster temperature in the inner 3 gives a central cluster temperature keV and a reduced = 1.02.
We checked our results using models with free abundance, and obtained similar results and, in particular, same temperature values.
3.4.1 Temperature in different regions
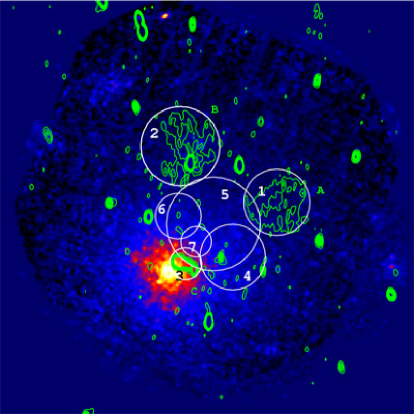
To study the influence of the ICM gas on the radio relics, we extracted the X-ray spectrum in different regions near the radio relics. Chosen regions are shown in Fig. 5. The results are shown in the Table 3. A temperature higher than the cluster average derived in the previous subsection was found in regions 6 and 4, located between the cluster center and relics A and B, with temperatures of 4.6, and 4.5 keV, respectively. The fits in the regions 1 and 2, i.e. in the relic regions A and B, are not conclusive because of the poor statistics in this peripheral cluster area. However, in region 1 (relic A) we obtained a temperature of 6.2 keV, suggesting a possible temperature increase in the relic location. To study the influence of the ICM on relic C, we extracted the spectra in the regions 7 and 3. The obtained temperatures are 3.0keV and 3.9 keV, respectively, so very close to the cluster average temperature in the inner 3 ( 3.4 keV).
| region | (keV) |
|---|---|
| 1 | 6.23/1.06 |
| 2 | 3.74/0.89 |
| 3 | 3.95/0.80 |
| 4 | 4.46/0.88 |
| 5 | 4.04/0.88 |
| 6 | 4.62/0.93 |
| 7 | 3.00/0.91 |
| cluster | |
| 2 | 3.28/0.93 |
| 3 | 3.37/1.02 |
| 5 | 3.59/1.09 |
3.4.2 Temperature Map
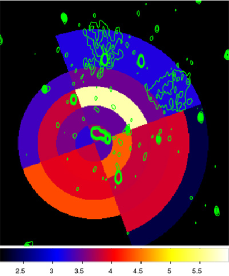
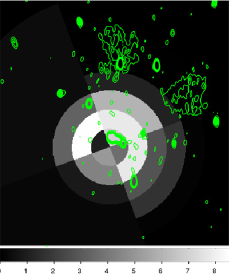
The temperature map is the best measurable indicator of equilibrium in a system. We obtained temperature maps by integrating by sectors or boxes (2 in size) and by an X-ray wavelet spectral mapping algorithm. In all three cases we obtained similar results and find a clear temperature increase at 5 from the cluster center followed by a temperature decrease at 7. The most significant temperature increase was from 3.2keV to 6.5 keV, obtained in the relic direction on the 2-3 keV. Figure 6 we show the temperature map obtained in different sectors where the temperature trend is more visible. In Fig.6b we have the ‘significance map’ that shows the difference between observed and average temperature divided on temperature error, where average temperature is 3.3 keV through the whole the cluster.
3.4.3 Temperature profiles in sectors
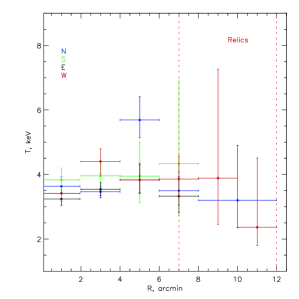
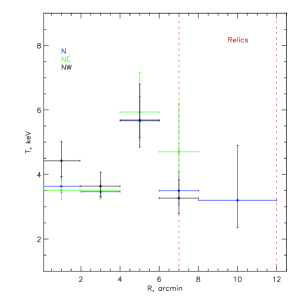
For a better understanding of the previous result, we derived temperature profiles in the different sectors for the directions: N, S, E, W (as in Fig. 2). We extracted spectra in each sector up to 10 from the cluster center, and the size of sectors was chosen similar to the size annuli used to derive the radial temperature profile .
Figure 7a shows obtained temperature profiles in each direction. A significant increase in the temperature at about 5, for the N direction, (in the region just before relics A and B), is clear. By splitting the N sector in the two subsectors NW and NE, we observed the same increase of the temperature in the region between 4 - 6, before the relic location (see Fig. 7b). The highest temperatures are about 5-6 keV .
3.5 Do we detect shocks toward the relics?
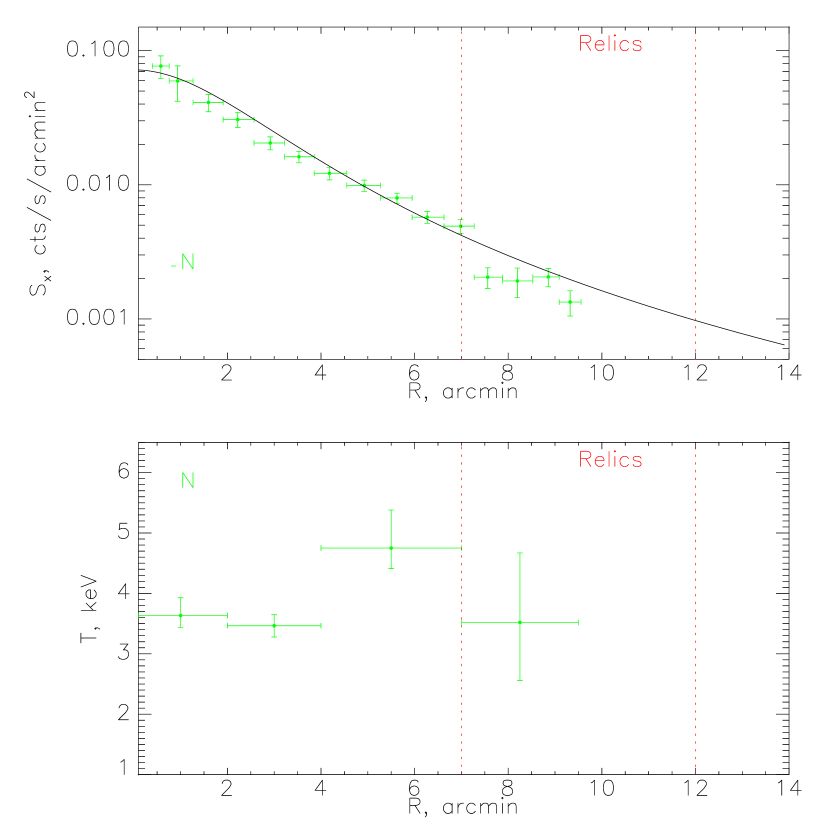
Figure 8 shows the surface brightness and temperature profiles in the direction of the radio relics A and B. We clearly observe an increase at 5 in the temperature profile (see Fig. 7b ) and a significative drop at 7 in surface brightness, just before the relic location. On one hand, if one considers that statistics are much better in brightness and that surface brightness is less affected by the averaging along the line of sight, one should use this profile to estimate the shock position and its mach number. On the other hand, the detection of a clear jump in the temperature could also be interpreted as a shock signature. That the projected positions of the shock are different in the two profiles should then be interpreted as different projection/averaging effect for surface brightness and temperature (also taking into account that we need a larger bin to estimate the temperature and then suffer stronger effects). Due to these statistical considerations, it seems better to define the shock position using the surface brightness profile. We, thus compute the temperature profile again so as to have bins just before and after the shock (see Fig. 8).
Considering a possible shock in the N direction and taking the surface brightness profile into account(see Fig. 8), the density compression given by is 1.74 at 7. We can use this value to constrain the kinematics of the merger: the Mach number of the shock can be derived by employing the Rankine-Hugoniot shock relations (Landau & Lifshitz 1959, Markevitch & Vikhlinin 2007) for density or temperature jumps of
| (1) |
| (2) |
where the subscript 2 denotes material behind the shock (the “postshock” region), and 1 denotes material ahead of the shock (the “preshock” region). For the intracluster gas, we used .
Using the above compression value and Eq. 1, the data agree with the presence of a moderately supersonic outflow with a Mach number =1.50.1. This result implies a temperature jump of = 1.54, in very good agreement with the measured discontinuity, at 7 : = 1.4. In a first conclusion, keeping in mind both the different averaging and projection effect along the line of sight for temperature and density and the fact that both jumps lead to similar mach number, we think that we probably detect a relatively mild shock toward the relics.
4 Relationship between X-ray and radio data
4.1 X-ray versus radio emission
Current models propose that merger shocks are at the origin of relics. In our case, the two radio relics A and B are well outside the cluster core radius (100-150 kpc), at projected distances of 500 and 430 kpc from the cluster center, at the boundary of the detected X-ray emission. The poor statistics do not allow us to derive conclusive information on the temperature in the relic regions, whereas a significant temperature increase is detected in the region before the relics. The presence of perturbations in the X-ray brightness distribution and of variations in the cluster temperature is a clear indication of a disturbed cluster, thus supporting the connection between the formation of relics and a strong cluster dynamical activity. On the other hand, it seems that there is no point-to-point coincidence between the radio regions and the shocked region. We show that it is possible to explain the link between the radio emission and the X-ray properties by invoking projection effects.
The small relic C, located at about 1 from the cluster center, i.e. within the cluster core radius, in the NW direction, is not associated with any obvious X-Ray substructure or temperature jump. This source consists of three components: a central diffuse emission and two brighter and more compact spots possibly associated with cluster galaxies (see Figs. 6 and 7 and the discussion in Feretti et al. 2006). The total flux density present in the high-resolution images is only about 1/3 of the flux density measured in the lower resolution image (77 mJy), thus indicating the presence of a diffuse structure of low brightness that, according to Feretti et al. (2006) we associate to the relic structure. Because of the low flux density of discrete sources (6.9 and 4.2 mJy, respectively), the flux density and size of source C are only marginally affected by the presence of these possibly unrelated sources. This source could belong to the subclass of small-size relics like those in A13, A85, A133, and A4038 (Giovannini and Feretti 2004, Feretti and Giovannini 2007) located near the central brightest cluster galaxy. A proper study of this central region is prevented by the presence of nearby discrete sources and the insufficent angular resolution of the X-ray data.
4.2 Pressure in relic regions
The Mach number obtained in the previous subsection can be used to estimate a theoretical pressure ratio 3.0. This is consistent with the observations: indeed in the direction relic A the pressure ratio is 2.9, of relic B it is 2.3, toward the N direction it is 2.8, and between A and B it is 2.7. In the other directions the pressure ratio is much lower: to the W it is 1.6, and to the E it is 2.0 (see Table 4). These results confirm that the shock region is only in the relic direction. Note that to calculate the pressure, we used the observed electronic density in each direction obtained from -model fits of the surface brightness (Neumann 2005).
We computed the minimum nonthermal energy density in the relic sources from the radio data under equipartition conditions, with standard assumptions. We obtained about 1.6 erg cm-3 for relics A and B and 1.2 erg cm-3 for C. The nonthermal pressure is 9.9 erg cm-3 and 7.4 erg cm-3, respectively. To estimate the minimum nonthermal energy density in the source C, we used the total flux density at low resolution, after subtracting components 7a and 7c (see Sect. 4.1). If we compare these results with the thermal pressure estimated in the relics region, we note that the minimum nonthermal pressure is about a factor 10 lower (but still in agreement with present uncertainties) than the thermal pressure. (From X-ray analysis we obtained 3.5 erg cm-3 in the shock near relics A and B, and erg cm-3 in the relic region.) This result confirms our general analysis of the gas pressure in this region. The higher value for relic C agrees with locat at the cluster center, and not simply projected onto it. The equipartition magnetic field is 0.9 G in relics A and B, and 3.6 G in source C.
| region | (keV) | cm | dyn cm |
|---|---|---|---|
| to A, in shock | 5.7 1.0 | 0.40 0.01 | 3.6 |
| to A, out shock | 3.3 0.5 | 0.24 0.01 | 1.2 |
| to B, in shock | 5.9 1.0 | 0.33 0.01 | 3.2 |
| to B, out shock | 4.7 1.1 | 0.19 0.01 | 1.4 |
| N, in shock | 5.7 0.6 | 0.36 0.01 | 3.3 |
| N, out shock | 3.5 0.5 | 0.22 0.01 | 1.2 |
| W, in shock | 3.8 0.5 | 0.39 0.01 | 2.4 |
| W, out shock | 3.8 0.5 | 0.24 0.01 | 1.5 |
| E, in shock | 3.7 0.4 | 0.45 0.01 | 2.6 |
| E, out shock | 3.3 0.6 | 0.26 0.01 | 1.3 |
| relic A, 9’ | 6.2 2.2 | 0.14 0.01 | 1.4 |
| relic B, 9’ | 3.7 1.2 | 0.14 0.01 | 0.9 |
| between AB, in | 5.7 0.6 | 0.37 0.01 | 3.4 |
| between AB, out | 3.5 0.5 | 0.22 0.01 | 1.2 |
5 Cluster dynamical state
A548b is a cluster with complex dynamical state. Observational evidence suggests the presence of a shock structure before the radio relics A and B. To explain this result, we need to understand the cluster’s dynamical history better since radio relics would generally be expected to coincide with the shock region.
We therefore performed a study of the geometry of the merger from optical analysis and from simulations. In this study, we need to take into account the projection effects.
5.1 A548b galaxies velocities and environment
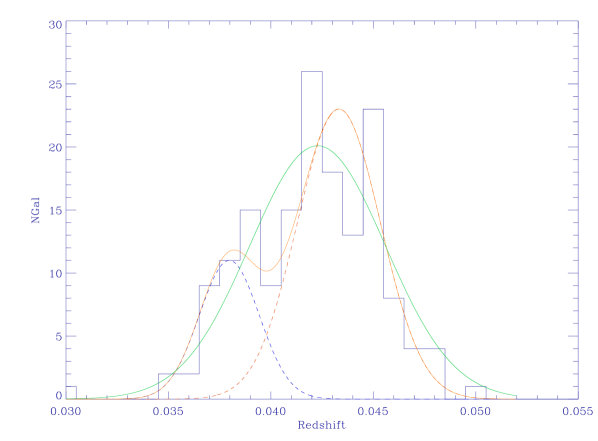
To estimate possible projection effects, we retrieved optical information on the galaxies of A548 from the NED database. Among 606 galaxies found in NED near the A548b cluster, 371 have a velocity measurement. Among these galaxies, 193 lie at a projected distance less than 1.5Mpc (i.e. r30.5) from the A548b cluster X-ray center. In Fig. 9, we present the histogram of the velocities of these galaxies. First, we obtained a fit to this histogram using a single Gaussian. The fit result implies a large value of nearly 1300kms-1. Using this value, the expected cluster average temperature should be 8 keV more than twice the observed value in the relation (Xue et al. 2000). Therefore, even if statistics are relatively poor, we have tried to fit the galaxy velocity histogram with two Gaussians. In this case, we found the major component with 925 135kms-1 and = 0.0432, whereas the second component has 664kms-1 and = 0.038.
Remembering that A548b (05h45m27.9s -25d56m19s V = 12708 kms-1 z = 0.042389) belong to a structure containing A548-2 (05h42m18.0s -26d05m00s V = 12861 kms-1 z = 0.0429), probably in the same plane of the sky and A548a (05h48m38.9s -25d28m12s V = 11834 kms-1 z = 0.039474), some 1000 km s-1 less than the two others, the velocities found in the fit with two Gaussians, compare quite well with these redshifts (see Fig. 9).
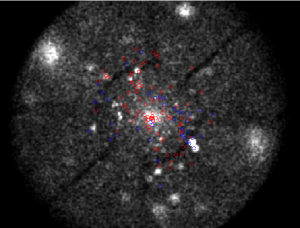
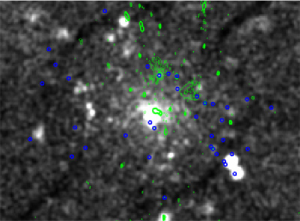
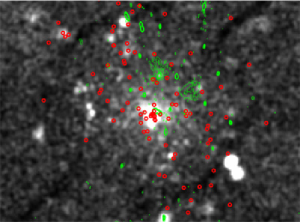
We then divided the galaxy data set in two groups at a redshift limit of 0.04. We have 39 galaxies with and 96 galaxies with . In an Ra-Dec plane centered on the X-ray center, we plotted (Fig. 10a) these two velocities groups as blue and red circles. One can see that the “red” group gently fills the whole space, while the “blue” one seems to be more distributed along the NE – SW direction.
We now try to estimate the mass ratio of the merging units. On one hand, if we split the histogram in two parts at 0.04-0.042 and consider identical galaxy mass distributions for the“blue” and “red” samples, then the number ratio is a first approximation of the mass ratio. In this way, we find 2.46. On the other hand, if we use the fit results, the ratio between the areas of each component gives an estimate of 2.700.94 or, if we try with , and , we find a mass ratio 1.91.3. If we remember the poorf statistics, these three estimates are fairly coherent even if not strongly constraining.
We can thus explain the apparently large and the spatial distribution of the “red” galaxies if we consider the following merging scheme: A548b would be the merger of two units, the major component being A548b, and a smaller one from the direction of A548a. Notice that, in this scheme, the collision axis forms a relatively small angle with respect to the line of sight.
Different situations are possible as a merger between A548b and A548a, from the NE or clump arriving from A548-2 to A548b but it is very probably so that the merger collision is nearly perpendicular to the plane of the sky.
In conclusion, from this optical analysis, we propose that we are observing a merger between two clusters with 1:2-3 mass ratio (estimated from the velocity histogram of galaxies as shown in Fig. 9). The merger’s collision axis is nearly on the line of sight. The smaller cluster probably is located in the SW from the cluster emission center and we are observing the merger just after the core collapse. It should be noted that we detected no galaxy associated with the second component (“blue” circles), behind the radio relics A and B, and in the cluster center (see Fig. 10).
5.2 Comparison with simulations
To understand the dynamical history of A548b and to explain the connection between X-ray, radio, and optical data, we found it useful to compare observational data to the theoretical predictions of a high–resolution cosmological simulation. For that purpose, we considered the 6th most massive halo (hence the name Cluster6) in the snapshot of a dark matter only simulation of a CDM universe with a periodic box size of 80 Mpc. We then resimulated the same box this time using the N body and hydrodynamics AMR code RAMSES (Teyssier 2002), with a much higher resolution in a region of 20 h-1Mpc around the cluster, and with a much lower resolution outside this radius, just enough to get the correct large-scale tidal field. This now rather standard simulation technique is usually called “zoom simulation” or “re-simulation”, and it is used in cosmology to focus computational resources on one specific object. Cluster6 is very interesting for this paper, since its final Virial temperature is close to 3.3 keV and 1.42Mpc, in striking agreement with A528b. Last but not least, Cluster6 experienced a major merger around , and at this redshift Cluster6 should be close to the assumed dynamical state of A548b. The simulation was initialized using a Cartesian grid to cover the whole box, and then derefined outside the central 20 h-1 sphere. We then progressively and dynamically increased the level of refinement only in the high-resolution region, using a quasi-Lagrangian refinement strategy, until we reached 7 additional levels of refinement. Our finest cell size is therefore close to 1 kpc, comfortabily smaller than the observational resolution. The number of AMR cells in the Virial radius is almost , while the number of dark matter particles is slightly above .
We performed the comparison between simulation results and X-ray data for gas density, gas temperature and, Mach number. These parameters are important for tracing the connection with radio data and particle acceleration.
We chose the different outputs obtained from simulation around the maximum core collapse. We focused on the epoch when two clumps merge along a large-scale filament and consider different projection axes. At the same time, we studied the effect of projection on the gas distribution. We examined the different projection X, Y, Z of the merger to have a complete scenario of all the merger situations. We obtained different results for the gas density, gas temperature map with a the same outputs, from the same cluster at the same time. After our analysis of different outputs from simulation and comparison with X-ray data of A548b, we selected the output results just after the maximum core collapse. In this case simulated results for the temperature ratio and distance to the shock agree with observational results of A548b.
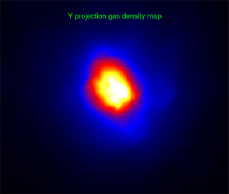
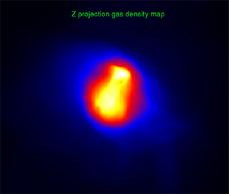
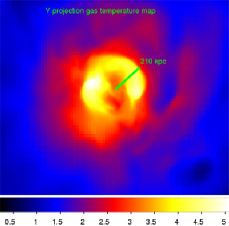
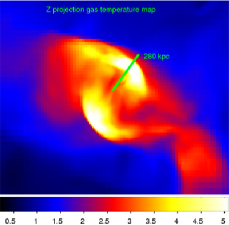
Figure 11 shows the temperature and density maps obtained from the Y and Z projections. The results are very different, and we select the Y projection, because the density map has the same distribution of the A548b emissivity map. Moreover, the temperature map obtained from the simulation has a temperature increase around the cluster center, similar to the observed one. The maximum of the temperature is in the annulus at 210 kpc, with values between 4.5 and 6 keV. The same temperature of A548b (3.3 keV) was obtained at the cluster center. Two peaks in temperature (6 keV) are present in the two regions around the cluster center. Note that the position of the peaks depends on the line-of-sight direction. After the optical analysis, we derived that A548b is in the state of merging, with 1:2-3 mass ratio of the units, and the merger collision direction nearly perpendicular to the plane of the sky.
To compare our results with radio data, we calculated the Mach number map for different projections of chosen outputs, using the projected velocity distribution and the projected speed of sound, in particular (Vazza, Brunetti & Gheller 2008):
| (3) |
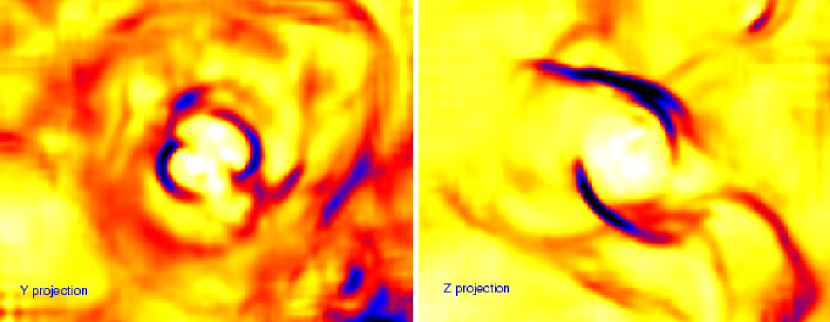
Figure 12 shows the obtained Mach number maps for Y, Z projection, just after maximum core collapse. In Y projection we observed a circular shock after temperature shock in the radius 250kpc, where the relativistic particles can be accelerated.
6 Discussion
To explain the observational properties of A548b we need to understand the cluster dynamical history, in particular the merger collision scenario. After our analysis we found the following main facts:
-
•
From the X-ray analysis, we observed the shock in the ICM temperature and emission just before the relic’s location, and the increase in the temperature and highly perturbed emissivity profiles in all cluster sectors.
-
•
From the optical analysis, we found that we very likely observed a merger of two units with 1:2-3 mass ratio, with the smaller unit located in the SW.
-
•
From our simulations and from A548b environments, we found that the merger collision should be nearly perpendicular to the plane of the sky.
To reconstruct the geometry of the merger, we compared the observations with simulations. We propose the following merging scheme: A548b would be the merger of two units, with a 1:2-3 mass ratio, a major component coming from A548b, and a smaller one coming from the NE direction ( i.e. from A548a). The merger collision is nearly perpendicular to the plane of the sky, the small clump arrived from the NE, merged with the large clump, and now the gas from the small clump is located in the SW region, with respect to the cluster emission center.
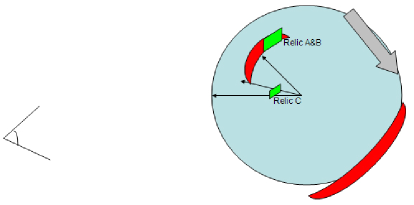
In the scenario that radio relics should be recently triggered by a shock wave for an efficient particles acceleration mechanism, the projection effects could help us to reconcile the relic position with the apparent position of the temperature enhancement. The A548b complex scenario, i.e. the relic’s location (on the same side with respect to the cluster center) and the shock just before the relic’s location, can be explained by the merger geometry sketched in Fig. 13. The two radio relics A and B, located at projected distances of 500 and 430 kpc from the cluster center, lie at the boundary of the X-ray brightness distribution, but this is due to strong projection effects of a merger along the line of sight.
The two relics represent two enhanced regions belonging to a large-scale shock, originated at the cluster center and moving to the peripheral region. A second symmetrical shock is expected by simulations, but because of mass ratio and merging geometry, it should be present in a peripheral region in SW direction (see Fig. 13) with a very low density. It cannot be present in our observation because of the chosen pointing center, but we do not expect that it could also be seen in a pointed XMM observation. According to present models of the formation of radio relics, we can imagine that a bubble of relativistic particles is accelerated by the shock originated by the major merger, the local magnetic field is compressed and amplified, originating the radio emission. The origin of relativistic particles is unknown. We note that relativistic particles should not be present in the whole shocked region, but only in the region where we see the extended radio emission. This suggests that these relativistic particles, possibly originating in past AGN activity, were confined in floating discrete bubble regions.
In this scheme, we observe the shock before the relic location due to the projection effects, because the merger collision is nearly perpendicular to the plane of the sky. Due to the poor statistics, the temperature in the relic regions is poorly constrained, but we expect these regions also to be shocked regions. In this scenario, the relics are at the same distance from the cluster center as the detected hot region, although the projected distance is smaller. The origin of relativistic particles responsible for the relic radio emission is puzzling. Indeed, it seems that the relativistic particles are not present in the fully shocked region, but only where radio emission is detected.
7 Conclusions
The main results of our study of the galaxy cluster Abell 548b from XMM-Newton observations can be summarized as follows:
We used XMM-Newton data to obtain X-Ray images and temperature distribution of the thermal ICM in A548b. We found that the -model is not a good fit of the data for the whole radial surface brightness profile in different sectors towards the N, S, W and E. Moreover we observed significant perturbations at 1.5, 5, and 7 from the cluster center in all the surface brightness profiles we obtained in different sectors and directions. The most significant perturbation is present towards relics A and B. Perturbations are also present in the residual image after subtraction of a 2D model, and here the most relevant perturbations are in the region towards the relics.
We studied the dynamics of A548b from a detailed spectral analysis. The central cluster temperature estimated in the inner 3 is 3.4 0.1 keV. The spectral study confirms that this cluster is not relaxed. We obtained a radial temperature profile, which shows a clear temperature increase at 5 from the cluster center. We extracted spectra in the regions between the cluster center and the relics A and B, and found that the most significant increase in temperature is present in the N (in direction of the two relics), but definitely before the relic location. We studied the temperature distribution in sectors, in boxes, and with the X-ray wavelet spectral mapping algorithm. In all cases we obtained similar results: a temperature increase in the annulus at 5 from the cluster center. The most significant increase in the temperature (from 3.5 keV to 6 keV) was observed towards the relic’s direction. The temperature distribution shows a similar asymmetry to the brightness distribution.on.
From an optical analysis we observed a large galaxy velocity dispersion of 1300kms-1, which is likely to be derived from two groups of galaxies with different velocities and velocity dispersions: “red”-kms-1 and ; “blue”- kms-1 and . Assuming that the “red” galaxies are associated with the cluster A548b, the “blue” galaxies are associated with a merging clump, with a 1:2-3 mass ratio. We can explain the apparent large and the spatial distribution of the “blue” galaxies if we consider the following merging scheme. Since A548b is in a rich environment with two other clusters A548-2 and A548a, it would be the merger of two units, a major component and a smaller one coming from the NE (from A548a). From the optical data we know, that A548a, A548b, and A548-2 are located at redshift 0.0394, 0.0423, and 0.0429, respectively. In this scheme, the collision axis forms a relatively large angle with the plane of the sky.
We used Cluster 6, obtained from the hydro N-body cosmology simulation, code RAMSES (Teyssier 2002), to draw the dynamical history of A548b. The mean temperature obtained from simulations is 3.3 keV, consistent with the temperature observed in A548b. We compared simulations and X-ray data for density, temperature, and Mach number maps at epochs around the maximum core collapse, in particular just after the maximum core collapse. We also studied the influence of projection effects on the observations. After this simulation analysis, we selected the output where density and temperature simulated maps were very similar to images obtained from our observation. The better agreeement was found under Y projection, i.e. with the merger axis nearly perpendicular to the plane of the sky, and at the epoch just after the first maximum core collapse. To compare our results with the radio data, we also derived the Mach number map from the previous simulations.
A548b is a cluster in a complex dynamical state. From the current data, it is not possible to establish if the central relic C is associated with any shock or X-ray feature. Higher angular resolution data are needed to analyze this cluster region. We observed an increase in the temperature at 5 -7 from the cluster center, i.e. before the radio relics A and B. This is interpreted as being caused by a shock with Mach number 1.5. We can explain the relative location of the relics with respect to the shocks by strong projection effects due to a merger occurring nearly perpendicularly to the plane of the sky (see Fig. 13). This scenario agrees with the suggestion that relics A and B could be part of a common structure (Feretti et al. 2006).
Acknowledgements.
We would like to thank Franco Vazza for useful discussions. R.T. would like to thank Stefan Gottloeber for providing the Cluster 6 initial conditions. The simulation work was done with the support of the Horizon project. This research also made use of the NASA/IPAC Extragalactic Database (NED), which is operated by the JPL, CalTech, under contract with NASA.References
- Arnaud et al. (2001) Arnaud, M., Neumann, D.M., Aghanim, N., et al, 2001, A&A, 365, L80
- Arnaud et al. (2002) Arnaud, M.,Majerowicz, S., Lumb D., et al 2002, A&A, 390, 27
- Belsole et al. (2005) Belsole, E., Sauvageot, J.L., Pratt, G.W., & Bourdin H. 2005, A&A, 430, 385
- Berrington et al. (2005) Berrington, Robert C., Lugger, P. M., Cohn, H. N., 2002, AJ, 123, 2261
- Bohringer et al. (2004) Bohringer, H., Schuecker, P., Guzzo, et al 2004, A&A, 425, 367
- Briel et al. (2004) Briel, U. G., Finoguenov, A., Henry, J. P., 2004, A&A, 426, 1
- Cavaliere and Fusco-Femiano (1976) Cavaliere, A., Fusco-Femiano, R. 1976, A&A, 49, 137
- Chatzikos et al. (2006) Chatzikos, M., Sarazin, C. L., Kempner, J. C., 2006, ApJ, 643, 751
- Clarke and Ensslin (2006) Clarke, T. E., Ensslin, T. A., 2006, AJ, 131, 2900
- Ensslin and Bruggen (2002) Ensslin, T. A., Bruggen, M., 2002, MNRAS, 331,1011
- Davis et al. (1995) Davis, D., Bird, C., Mushotzky, R., Odewahn, S., 1995, ApJ, 440, 48
- Dolag (2006) Dolag, K., 2006, AN, 327, 575
- Feretti et al. (2006) Feretti, L., Bacchi, M., Slee, O. B., Giovannini, G., Govoni, F., Andernach, H., Tsarevsky, G., 2006, MNRAS, 368, 544
- Feretti and Neumann (2006) Feretti, L., Neumann, D. M., 2006, A&A, 450L, 21
- Feretti (2003) Feretti, L., 2003, ASPC, 301, 143
- Feretti & Giovannini (2007) Feretti, L., Giovannini, G., 2007, Springer Lecture Notes in Physics, Ed. M. Plionis et al., in press (arXiv:astro-ph/0703494)
- Ferrari (2005) Ferrari, C., Benoist, C., Maurogordato, S., et al, 2005, A&A, 430, 19
- Ferrari (2006) Ferrari, C., Arnaud, M., Ettori, S., Maurogordato, S., Rho, J., A&A, 446, 417
- Fujita (2006) Fujita, Y., Sarazin, C. L., Sivakoff, G. R., 2006, PASJ, 58, 131
- Giovannini & Feretti (2000) Giovannini, G. , Feretti, L., 2000, New Astronomy 5, 335
- Giovannini & Feretti (2004) Giovannini, G. , Feretti, L., 2004, JKAS 37, 323
- Govoni & Feretti (2004) Govoni, F., Feretti, L., 2004, IJMPD, 13, 1549
- Henriksen et al. (2004) Henriksen, M., Hudson, D., 2004, JKAS, 37, 299
- Henry et al. (2004) Henry, J. P., Finoguenov, A., Briel, U. G., 2004, ApJ, 615, 181
- Hoeft et al. (2004) Hoeft, M., Brggen, M., Yepes, G., 2004, MNRAS, 347, 389
- Kempner et al. (2003) Kempner, J., Sarazin, C., Markevitch, M., 2003, ApJ, 593, 291
- Kempner and David (2004) Kempner, J. C., David, L. P., 2004, MNRAS, 349, 385
- Landau & Lifshitz (1959) Landau, L. D., & Lifshitz, E.M., 1959, Fluid Dynamics
- Lumb et al. (2002) Lumb, D.H., Warwick, R.S., Page, M., and De Luca, A., 2002, A&A 389, 93-105
- Markevitch et al. (2000) Markevitch, M., Ponman, T. J.,Nulsen, P. E. J., et al, 2000, ApJ, 541, 542
- Markevitch et al. (2001) Markevitch, M., Vikhlinin, A., 2001, ApJ, 563, 95
- Markevitch & Vikhlinin (2007) Markevitch, M., Vikhlinin, A., 2007, Phys. Rep., 443, 1
- Majerowicz et al. (2002) Majerowicz, S., Neumann D. & Reiprich, T. 2002, A&A, 394, 77
- Majerowicz et al. (2004) Majerowicz, S., Neumann, D.M., Romer, A.K., et al 2004, A&A, 444, 673
- Mazzotta et al. (2002) Mazzotta, P., Fusco-Femiano, R., Vikhlinin, A., Markevich, M, 2002, ApJ, 569L, 31
- Mazzotta et al. (2004) Mazzotta, P., Brunetti, G., Giacintucci, S., Venturi, T., Bardelli, S., 2004, JKAS, 37, 381
- Neumann (2005) Neumann, D., 2005, A&A, 439, 465
- Neumann & Arnaud (1999) Neumann, D. & Arnaud M. 1999, A&A, 348, 711
- Nevalainen et al. (2005) Nevalainen, J., Markevitch, M., Lumb, D. 2005, ApJ, 629,172
- Ricker and Sarazin (2001) Ricker, P.M. and Sarazin, G.L. 2001, ApJ, 561, 621
- Sauvageot et al. (2005) Sauvageot, J.L., Belsole, E.,& Pratt, G.W. 2005, A&A, 444, 673
- Schindler (2002) Schindler, S., Mergers of Galaxy Clusters in Numerical Simulations, 2002, 229
- Solovyeva et al. (2007) Solovyeva, L., Anokhin, S., Sauvageot, J. L., Teyssier, R., Neumann, D. 2007, A&A, 476, 63
- Vazza, Brunetti & Gheller (2008) Vazza F., Brunetti G. & Gheller C., 2008, submitted to MNRAS
- Venturi et al. (2007) Venturi, T., Giacintucci, S., Brunetti, G., Cassano, R., Bardelli, S., Dallacasa, D., Setti, G., 2007, A&A, 463, 937
- Vikhlinin et al. (2001) Vikhlinin, A., Markevitch, M., Murray, S. S., 2001, ApJ, 551, 160V
- Teyssier (2002) Teyssier, R., 2002, A&A 385, 337
- White (2000) White, D.A., 2000, MNRAS, 312, 663
- White et al. (1997) White, D.A., Jones, C., Forman, W., 1997, MNRAS, 292, 419
- Xue et al. (2000) Xue, Y.-J., Wu, X.-P., 2000, ApJ, 538, 65X