XMM-Newton observations of the TeV BL Lac object PKS 2155–304 in 2006: signature of inverse Compton X-ray emission?
Abstract
This paper reports the first discovery of possible inverse Compoton (IC) X-ray emission below 10 keV in the typical high-energy peaked BL Lac object (HBL) PKS 2155–304. Two XMM-Newton observations performed in 2006 reveal that the 0.6–10 keV X-ray spectra of the source harden ( 0.1–0.3) at break energies of keV. The concave X-ray spectra of the source could be easily interpretated by a mixture of a steep component (i.e., the high energy tail of the synchrotron emission) and a flat one (i.e., the low energy side of the IC emission). However, the steep spectra ( 2.3) in the hard X-rays indicate that the synchrotron emission still domiantes over the IC one, while the latter is effectively present and perceived as flattening the synchrotron spectrum in this energy range. The quasi-simultaneous optical-UV-X-ray spectral energy distributions (SEDs) obtained with XMM-Newton suggest that the concave X-ray spectra of the source could be the result of down-ward shift of the synchrotron peak frequency to the optical band, incuring the IC emisssion to become more important in the hard (–10 keV) X-ray band with respective to other cases in which the synchrotron emission peaks in the UV-soft-X-ray range. This discovery provides a new clue for a smooth transition between HBLs and the low-energy peaked BL Lac objects (LBLs).
1 Introduction
BL Lac objects are currently classified on the basis of the peak frequency of synchrotron emission. The synchrotron emission of the high-energy peaked BL Lac objects (HBLs) peaks in the UV-X-ray range, while the low-energy peaked BL Lac objects (LBLs) are those whose synchrotron emission peaks in the IR-optical band. The transition from HBLs to LBLs is expected to be smooth rather than dichotomic, forming a continuous sequence of synchrotron peak frequency with luminosity. A few bright LBLs, when they are in very high states, can exhibit X-ray spectra typical of HBLs.
PKS 2155–304 (=0.116) is the brightest BL Lac object at the UV and EUV wavelengths as revealed by the IUE and EUVE satellites. It is also among the brightest X-ray BL Lac objects. Though it is classified as a HBL, the peak energy of its synchrotron emission were found to be no larger than a few tenth of a keV even in very high states (Zhang et al. 2002; Massaro et al. 2008). Numerous X-ray observations with various X-ray telescopes instead suggested that the synchrotron emission of PKS 2155–304 tends to peak in the UV-EUV rather than in the X-rays. In contrast, for the other two well studied HBLs Mrk 421 and Mrk 501, the synchrotron emission can peak at a few keV or even at very high energy X-ray band (e.g., Pian et al. 1998; Massaro et al. 2004; Tramacere et al. 2007). It is the fifth among the twenty extragalactic very high energy (VHE) or TeV -ray sources known so far (Chadwick et al. 1999). An extreme TeV outburst of about an hour duration was recorded on 2006 July 28, and the most rapid TeV variation was seen down to a timescale of s (Aharonian et al. 2007). However, the rapid TeV flare did not accompany spectral variability, and SWIFT follow-up observations did not reveal shift of the synchrotron peak frequency either (Foschini et al. 2007). The CANGAROO-III observations also showed raipd VHE -ray variability over timescales shorter than a few hours (Sakamoto et al. 2008).
As a calibration target, XMM-Newton repeatedly monitored PKS 2155–304 since 2000. In this paper, we present X-ray spectral analysis and quasi-simultaneous optical-UV-X-ray SEDs of two observations performed on 2006 May 1 (orbit 1171, obs. ID 0158961401) and November 7 (orbit 1266, obs. ID 0411780101), to show the signature of the possible IC emission between 4 and 10 keV. A complete data analysis for all available XMM-Newton obervations will be presented elsewhere.
2 The XMM-Newton Observations and Data Reduction
We follow the standard procedures to reprocess the Observation Data Files (ODF) with the XMM-Newton Science Analysis System (SAS) version 7.1.0 and with the calibration files as of 2007 October. Firstly we extract a high energy (10 keV 12 keV for pn, and 10 keV for mos) light curve only with single event (PATTERN=0) from full frame of the exposed CCD, to identify intervals of flaring particle background for pn, mos1 and mos2, respectively. No background flares are found. Pile-up effects are then examined with the SAS task epatplot. The pn data are not affected by the pile-up effects, while the mos data meet with strong pile-up effects. As a result, we extract pn source counts from a circle region centered on the source with radius of 40 arcsec, while the mos1/mos2 source counts are extracted from an annulus region centered on the source with inner and outer radii of 5/10 and 40 arcsec, respectively. The pn background counts are selected from a circle region least affected by the source counts on the same CCD as the source region. Because there are no mos background region available on the same CCD as the source region, we select mos background counts from a circle region of another exposed CCD. Single and double (pn) and single-to-quadruple (mos) events with quality FLAG=0 are selected for our analysis. For consistency, we use the same energy range of 0.6–10 keV for both pn and mos data, in an attempt to exclude any possible remaining (cross-)calibration uncertainties below 0.6 keV. The pn and mos spectra are created with SAS task XMMSELECT and grouped with FTOOL task GRPPHA in order to have at least 30 counts in each energy bin for the use of statistics. Redistribution matrices and ancillary response files are produced with SAS task RMFGEN and ARFGEN. The journal of the pn and mos observations is shown in Table 1.
The Optical Monitor (OM) observations were taken in standard imaging mode with a sequence of six filters (i.e., V,B,U, UVW1, UVM2 and UVW2). The OM observations have two images for UVW1 filter and one image for other filters. We reprocess the OM imaging data using the standard omichain pipeline of SAS 7.1.0, from which we obtain the source count rates and instrumental magnitudes. The OM count rates are then converted into fluxes according to the average conversion factors derived from observations of white dwarf standard stars. The OM observational results are listed in Table 2.
3 X-ray data analysis
3.1 Timing analysis
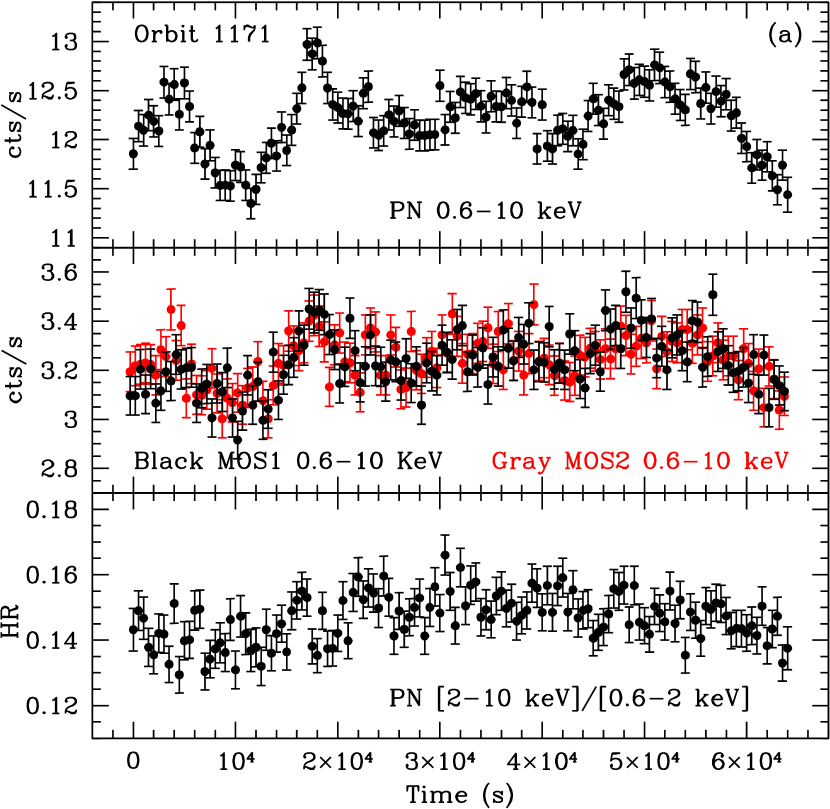
Figure 1a shows the 0.6–10 keV light curves and hardness ratios for orbit 1171. The pn light curve exhibits an overall variation of from the minimum to the maximum, characterized by multiple “flare-like” events. The mos1 and mos2 light curves are basically identical, and both roughly tracks the pn one. The pn hardness ratios (2–10 versus 0.6–2 keV) are not strongly variable.
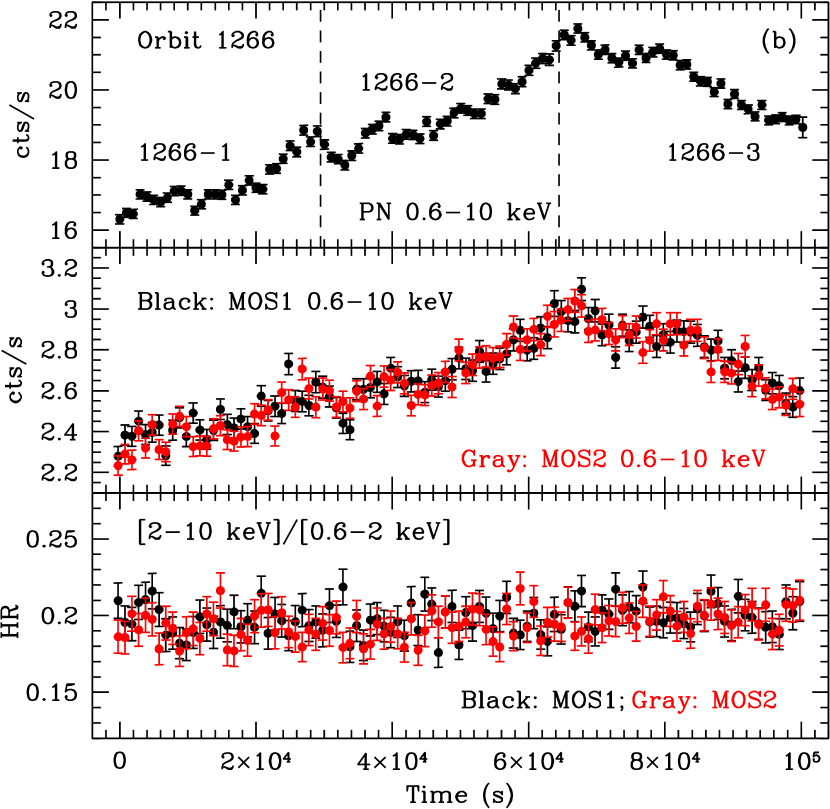
The 0.6–10 keV light curves and hardness ratios for orbit 1266 are plotted in Figure 1b. The pn light curve is separated into three sections due to different filters used for 1266-1 (thin), 1266-2 (medium) and 1266-3 (thick), respectively. This brings about an offset between different sections, in particular between 1266-2 and 1266-3. The mos1 and mos2 light curves overlap each other very well, showing an asymetric flare with minimum-to-maximum variability amplitude and a rising timescale of 70 ks. The decaying phase of the flare may be not fully sampled, but its variating rate is slower than the rising one. The mos1 and mos2 hardness ratios (2–10 to 0.6–2 keV) are roughly constant. The pn light curve appears to follow the mos ones very well after one arbitrarily scales the three sections of the pn light curve together (see Figure 1b).
3.2 Spectral analysis
Roughly constant hardness ratios imply that the X-ray spectra are not strongly variable during each orbit, so we fit a (mean) spectrum with XSPEC 12.3.1 for each exposure. The Galactic neutral hydrogen absorption ( , Lockman & Savage 1995) in sight of light toward PKS 2155–304 is fixed for all of spectral fits. The results of the spectral fits are summarized in Table 3.
Firstly we fit each pn spectrum with a single power-law model to inspect if the spectrum is typical of HBLs, characterized by continuously downward-curved (convex) shape with increasing energy. The pn count spectra with the best power-law fit models and the data-to-model ratios are shown in Figure 2a for orbit 1171 and 1266-3, respectively. To our surprise, both fits clearly show positive residuals above 4–5 keV, becoming larger with increasing energy. This feature indicates a spectral flattening with increasing energy. A single power-law fit leaves similar residuals for the other two pn spectra (i.e., the orbit 1266-1 and 1266-2) and all the mos spectra. Due to much smaller photon counts compared to the pn ones, the residuals for the mos spectra are relatively weak.
It is well known that the residuals, from a single power-law fit to the X-ray spectra of HBLs, are negative below a few tenth of keV and above a few keV, and are positive between them, implying that the spectra are continuously down-ward curved below 10 keV. The broad band X-ray spectra with BeppoSAX suggest that a spectral hardening of PKS 2155–304 occurs above tens of keV, while the spectra below 10 keV are still typical of HBLs (Giommi et al. 1998; Chiappetti et al. 1999). To firmly believe the reality of our new discovery, we make several tests. A single power-law fit to the pn spectra extracted only with single events (minimizing the pile-up effects) yields identical photon index and residuals. We then extract the pn spectra from an annulus by excluding the inner 10 arcsec to avoid probable residuals of the pile-up effects, and the fits with a single power-law model leave similar tails. We also extract the pn background spectra from various locations of the CCD, and the tails persist as well. We further use a single power law model to fit all other available XMM-Newton pn spectra of PKS 2155–304, in particular the two observations performed in 2005 November 30 (orbit 1095) and 2007 April 22 (orbit 1349), only about half year before orbit 1171 and after orbit 1266. We find that these pn spectra are all typical of HBLs. As an example, Figure 2a also shows the pn spectrum and the data-to-model ratios for the observation in 2002 Nov 29-30 (orbit 0545, see Zhang et al. 2005, 2006 for the light curve) when the source was in an X-ray state similar to orbit 1171 and 1266. The residuals are completely distinguished from those of orbit 1171 and 1266-3, indicating that the X-ray spectra in 2006 indeed are not typical of HBLs.
Excellent spectral fits are achieved with a broken power-law model, showing that the spectra are flatter in the hard than in the soft X-rays for orbit 1171 and 1266. The spectral hardening ( 0.1–0.3) occurs at a break energy of 3–5 keV. This is sharply opposite to the spectral softening () at a break energy of 2 keV for orbit 0545. We present in Figure 2b the pn, mos1 and mos2 count spectra with the best broken power-law models and the data-to-model ratios for orbit 1171. Moreover, Figure 3 plots the 68%, 90%, and 99% confidence level contours for the break energy and the soft/hard X-ray photon index under the best fits with the broken power law model to the PN spectra of the orbit 1171 and 1266-3. The contours demonstrate that the soft and the hard X-ray photon index are completely separate at 99% confidence level, confirming the hard tails of the concave X-ray spectra of the source in 2006. The similar contours also show that the soft and the hard X-ray photon index are completely disjoint at 99% confidence level for all other cases.
The logarithmic parabolic model, often used to describe continuously downward-curved X-ray spectra of HBLs (e.g., Massaro et al. 2004), also presents good fits. The curvature index is for the pn spectrum of orbit 0545, indicating downward-curved spectral shape. However, the curvature index is and for the pn spectra of orbit 1171 and 1266, respectively, suggesting that the spectra are weakly up-ward curved and in surpport with the concave spectral shape derived from the broken power-law fits.
4 Optical Data and Spectral Energy Distribution
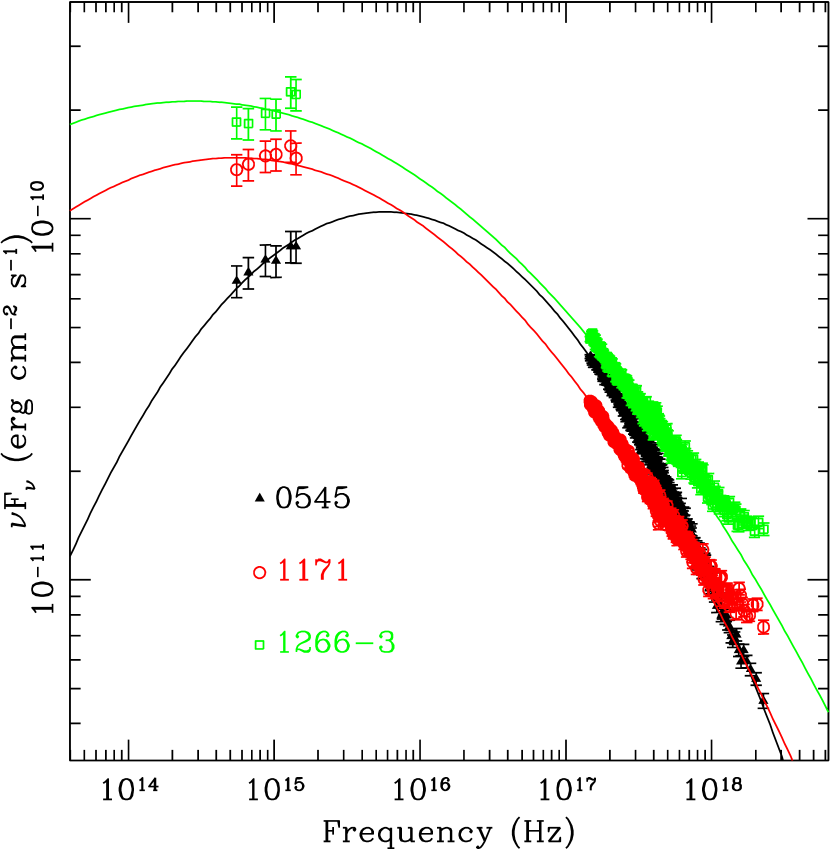
The OM observations do not provide useful information for short-term variability of PKS 2155–304 in the optical-UV bands because only one or two images were obtained for each filter with exposure time of 1000–4400 s during each orbit. However, they do show long-term optical and UV variability over timescales of years. More importantly, the OM and X-ray observations present quasi-simultaneous optical-UV-X-ray SEDs that are precious to understand the long-term evolution of synchrotron spectra of the source. Figure 4 plots the SEDs for orbit 0545, 1171, and 1266-3, respectively. The X-ray SEDs are derived from the average pn spectra that are unabsorbed and unfolded with the best broken power-law model. The OM fluxes are dereddened by using the extinction formula of Cardelli et al. (1989). A 10% error is assigned to each OM flux to account for the uncertainties of both the flux conversion and extinction correction. It is worth noting, during each orbit, that the OM observations at the six wavelengths are not simultaneous, and the PN and OM observations do not cover the same length of time (in fact, the OM exposure times are much shorter than the pn ones). As we are concentrated on the long term evolution of the SEDs of the source, the average pn fluxes are used for constructing the quasi-simultaneous SEDs.
The X-ray SEDs of PKS 2155–304 clearly show an upturn in the high energy X-ray band for orbit 1171 and 1266-3. It is also obvious that the source goes through strong evolution of synchrotron emission spectra, manifested by very different amplitude of flux variability in different energy bands. The optical-UV fluxes increase by a factor of 1.6–2.0, depending on the wavelengths, over a time interval of about four years from orbit 0545 to 1266-3. However, the 0.6–10 keV X-ray flux increases only 38% over the same time period even though the X-ray variability amplitude strongly increases with increasing energy. Similar flux variability amplitude of 50% occurs in the optical-UV and X-rays over a timescale of about half year from orbit 1171 to 1266-3.
5 Discussion
The X-ray spectra of HBLs are characterized by convex shape or by continuously down-ward curved shape in some cases. This is the signature of the high energy tail of the synchrotron emission as the result of the energy-dependent particle acceleration and cooling (e.g., Massaro et al. 2004). Previous X-ray observations by various X-ray telescopes showed that the X-ray spectra of PKS 2155–304 are convex at the X-ray energy range below 10 keV (e.g., Kataoka et al. 2000; Zhang et al. 2002). Though numerous XMM-Newton observations of the source exhibited the convex X-ray spectra as well (Foschini et al. 2006a; Massaro et al. 2008), the two XMM-Newton observations in 2006 we analyzed here clearly show that the X-ray spectra of the source are concave. A broken power-law fit to the 0.6–10 keV spectra yield a break energy around 3–5 keV, with a spectral flattening of 0.1–0.3 from the soft to hard X-rays. However, such break energy usually occurs around energy of several tens of keV as revealed by the broad-band BeppoSAX X-ray spectra of PKS 2155–304 (Giommi et al. 1998; Chiappetti et al. 1999). This paper thus presents the first evidence for the concave X-ray spectra below 10 keV for a typical HBL.
In the X-rays below 10 keV, the concave X-ray spectra are a common feature of LBLs. This has been interpreted as a mixture of two spectral components. A steep and variable spectral component, attributed to the synchrotron emission from the high-energy tail of an electron distribution, dominates at the soft X-rays, while a flat but less variable spectral component, associated with the IC scattering of the low-energy side of the same electron distribution off the synchrotron (and/or external in some cases) photons, is dominant at the hard X-rays. This explanation is supported by the fact that the transiting energy between the two spectral component increases with increasing X-ray flux (e.g., S5 0716+714: Ferrero et al. 2006; Foschini et al. 2006b; BL Lacertae: Ravasio et al. 2003). Moreover, in very high states, the synchrotron emission from S5 0716+714 can be dominant up to 10 keV (Ferrero et al. 2006).
In analogous to LBLs, we may attribute the concave X-ray spectra of PKS 2155–304 to a mixture of the two spectral component as well: the low energy X-ray emission, whose spectrum is steep () , originates completely from the high enegy end of the synchrotron emission, but the high energy X-ray emission, whose spectrum is flatter than the soft one, should be a mixture of the most energetic end of the synchrotron emission and the low energy side of the IC emission. The IC emission whose spectrum is flat, gradually becomes important with increasing energy. However, the high energy X-ray spectra is steep (), implying that the high energy X-ray emission is still dominated by the synchrotron emission. The contamination of the IC emission flattens a bit the high energy X-ray spectra. If it is dominated by the IC component, the high energy X-ray spectra should be flat similar to LBLs (i.e., ; e.g., Ferrero et al. 2006). Our analyses of all available XMM-Newton observations show that PKS 2155–304 was in relatively low X-ray states in 2006, indicating that the emergence of the IC component may be realted to its low X-ray state. However, in other epochs with similar low X-ray states (e.g., orbit 0545 shown in this paper), the X-ray spectra of the source are still convex. Another possibility to account for the flatter but steep high energy X-ray spectra is that the X-ray emission of PKS 2155–304 in 2006 may consist of two synchrotron components with different spectral slopes.
With XSPEC 12.3.1, we simulate a spectrum consisting of two power law components: one with represents the steep synchrotron component, and another one with is for the flat IC component. We normalize the relative importance of the two components such that they contribute equally to the observed flux at 30 keV. The simulated spectrum is then folded with the pn response and auxiliary files of orbit 1171, and normalized to the pn 0.6–10 keV flux and photon counting statistics (with 60000 s exposure time) of orbit 1171 as well. We then group and fit the simulated spectrum in the exact same way as the observed spectra (§ 3.2), which is presented in Figure 5. All the fits present very similar results and fit statistic as the observed ones. The single power law fit gives (, dof=1276 and probability=2.3%) and leaves similar hard tail above keV (middle panel of Figure 5). The broken power law fit results in and with break energy at keV (, dof=1274 and probability=13.2%), and the logarithmic parabolic model yields the curvature index of and at 1 keV (, dof=1275 and probability=9.0%). The simulation thus demonstrates that the concave spectra with steep photon index at the hard X-rays is very likely a mixture of a steep synchrotron component dominating below 10 keV and a flat IC one domianting above 10 keV. However, the IC component is effectively present and perceived as a hardening of the synchrotron spectrum between and 10 keV.
The simultaneous optical-UV-X-ray SEDs show that PKS 2155–304 is more variable in the optical-UV bands than in the X-rays, implying strong evolution of the synchrotron spectra from orbit 0545 to 1171 and 1266-3. Although the synchrotron peak is not directly perceived due to a broad data gap between the optical-UV and X-rays, we may fit the SEDs with a parabola to phenomenologically determine the synchrotron peak frequency and flux. The fit is restricted to the optical-UV and 0.6–2 keV range to avoid putative contamination of the IC emission above 3 keV. The parabola from the best fit is then extended to the whole observed X-ray range, which is plotted in Figure 4 along with the SEDs, to show the degree of the IC contribution to the synchrotron component (i.e. the parabola). The high energy X-ray SED is clearly above the extrapolation of the parabola for orbit 1171 and 1266-3, while for orbit 0545 it is very well in agreement with the extrapolation of the parabola. The derived peak frequency () of the parabola is , and Hz, and the corresponding peak flux, , is , and for orbit 0545, 1171 and 1266-3, respectively. The peak flux is thus anti-correlated with the peak frequency: the lower the peak frequency, the higher the peak flux. The down-ward shift of the synchrotron peak to the optical wavelengths might be the reason that the IC component become visible below 10 keV for orbit 1171 and 1266-3. However, this behaviour is inconsistent with the positive correlation between the frequency and flux of the synchrotron peak found in some X-ray bright TeV HBLs (Tramacere et al. 2007; Massaro et al. 2008). In fact, Massaro et al. (2008) already noticed that PKS 2155–304 behaves differently. This new discovery warrants further more simultaneous multiwavelength observations with the EUV range involved in particular and theoretical considerations.
References
- (1) Aharonian, F., et al. 2007, ApJ, 664, L71
- (2) Cardelli, J.A., Clayton, G.C., & Mathis, J.S. 1989, ApJ, 345, 245
- Chadwick P.M. et al. (1998) Chadwick, P.M., et al. 1999, ApJ, 513, 161
- (4) Chiappetti, L., et al. 1999, ApJ, 521, 552
- (5) Ferrero, E., Wagner, S.J., Emmanoulopoulos, D., & Ostorero, L. 2006, A&A, 457, 133
- (6) Foschini, L., et al. 2006a, A&A, 453, 829
- (7) Foschini, L., et al. 2006b, A&A, 455, 871
- (8) Foschini, L., et al. 2007, ApJ, 657, L81
- (9) Giommi, P., et al. 1998, A&A, 333, L5
- Kata (2000) Kataoka, J., et al. 2000, ApJ, 528, 243
- (11) Lockman, F.J., & Savage, B.D. 1995, ApJS, 97, 1
- (12) Massaro, E., Perri, M., Giommi, P., & Nesci, R. 2004, A&A, 413, 489
- (13) Massaro, F., Tramacere, A., Cavaliere, A., Perri, M., & Giommi, P. 2008, A&A, 478, 395
- (14) Pian, E., et al. 1998, ApJ, 492, L17
- (15) Ravasio, M., Tagliaferri, G., Ghisellini, G., Tavecchio, F., Bottcher, M., & Sikora, M. 2003, A&A, 408, 479
- (16) Sakamoto, Y., et al. 2008, ApJ, 676, 113
- (17) Tramacere, A., Massaro, F., & Cavaliere, A. 2007, A&A, 466, 521
- (18) Zhang, Y.H., et al. 2002, ApJ, 572, 762
- (19) Zhang, Y.H., Treves, A., Celotti, A., Qin, Y.P., & Bai, J.M. 2005, ApJ, 629, 686
- (20) Zhang, Y.H., Treves, A., Maraschi, L., Bai, J.M., & Liu, F.K. 2006, ApJ, 637, 699
| Obs. ID | Orbit | Date (UT) | Detector | ModeaaSW indicates imaging small window. | Filter | Duration (s) | Live Time (s) | Count RatebbBackground subtracted mean count rate in the 0.6–10 keV energy band. |
|---|---|---|---|---|---|---|---|---|
| 0158961401 | 1171 | 2006 May 1 12:31:58-06:24:50ccNext day. | PN | SW | Medium | 64372 | 45108 | 12.2 |
| 1171 | 12:26:48-06:22:50ccNext day. | MOS1 | SW | Medium | 64563 | 62638 | 3.24 | |
| 1171 | 12:26:48-06:22:54ccNext day. | MOS2 | SW | Medium | 64568 | 62637 | 3.23 | |
| 0411780101 | 1266-1 | 2006 Nov 7 00:31:25-08:50:03 | PN | SW | Thin | 29918 | 20869 | 17.3 |
| 1266-2 | 08:52:19-18:35:53 | PN | SW | Medium | 35015 | 24356 | 18.8 | |
| 1266-3 | 18:38:36-04:24:57ccNext day. | PN | SW | Thick | 35179 | 24626 | 16.6 | |
| 1266 | 00:23:33-04:22:06ccNext day. | MOS1 | SW | Medium | 100714 | 97288 | 2.66 | |
| 1266 | 00:23:34-04:22:11ccNext day. | MOS2 | SW | Medium | 100718 | 97285 | 2.65 | |
| 0124930601 | 0545 | 2002 Nov 29 23:32:52-15:20:17ccNext day. | PN | SW | Thick | 56845 | 39794 | 13.0 |
| Filter | Wavelength (nm) | Data (UT) | Exp. Time (s) | Count RateaaBackgound subtracted count rate. | MagnitudebbInstrumental magnitude. | FluxccFlux in unit of is converted from the count rate using the conversion factor of white dwarf standard star. |
|---|---|---|---|---|---|---|
| Orbit 1171 (2006-05-01) | ||||||
| V | 543 | 12:34:59-12:51:40 | 1000 | |||
| U | 344 | 12:56:48-13:13:26 | 1000 | |||
| B | 450 | 13:18:32-13:35:13 | 1000 | |||
| UVW1ddTwo images are combined. | 291 | 17:37:40-18:49:49 | 4000 | |||
| UVM2 | 231 | 19:37:55-20:44:35 | 4000 | |||
| UVW2 | 212 | 20:49:42-21:56:23 | 4000 | |||
| Orbit 1266 (2006-11-07) | ||||||
| V | 543 | 08:55:01-09:11:41 | 1000 | |||
| U | 344 | 09:46:49-10:03:29 | 1000 | |||
| B | 450 | 10:08:36-10:25:17 | 1000 | |||
| UVW1ddTwo images are combined. | 291 | 14:27:42-16:46:31 | 8000 | |||
| UVM2 | 231 | 17:34:37-18:41:18 | 4000 | |||
| UVW2 | 212 | 18:46:24-19:53:04 | 4000 | |||
| Orbit 0545 (2002-11-30) | ||||||
| V | 543 | 00:15:02-00:31:41 | 1000 | |||
| U | 344 | 00:36:49-00:56:49 | 1200 | |||
| B | 450 | 01:01:55-01:18:35 | 1000 | |||
| UVW1 | 291 | 03:54:25-04:44:25 | 3000 | |||
| UVM2 | 231 | 04:49:32-05:39:32 | 3000 | |||
| UVW2 | 212 | 05:44:38-06:57:58 | 4400 | |||
| Orbit | bb is the photon index at 1 keV in the LP model. The errors are smaller than 0.01. | /cc is the break energy in the BKPL model. is the curvature parameter in the LP model ( means downward curved shape and upward cuved shape). | Kdd is the normalization factor in unit of . The errors are smaller than 0.01. | /dof | Prob. | FeeUnabsorbed 2–10 keV flux in unit of . | FffUnabsorbed 0.6-10 keV flux in unit of . | |
|---|---|---|---|---|---|---|---|---|
| Power law (PL) model | ||||||||
| 1171/PN | – | – | 1.11/1272 | 0.003 | 1.60 | 4.28 | ||
| 1171/MOS1 | – | – | 1.12/375 | 0.053 | 1.72 | 4.46 | ||
| 1171/MOS2 | – | – | 1.12/382 | 0.053 | 1.72 | 4.58 | ||
| 1266-1/PN | – | – | 1.03/1127 | 0.241 | 2.28 | 5.84 | ||
| 1266-2/PN | – | – | 1.01/1226 | 0.412 | 2.57 | 6.51 | ||
| 1266-3/PN | – | – | 1.12/1245 | 0.003 | 2.73 | 6.91 | ||
| 1266/MOS1 | – | – | 1.22/406 | 0.001 | 2.70 | 6.47 | ||
| 1266/MOS2 | – | – | 1.18/402 | 0.008 | 2.74 | 6.87 | ||
| 0545/PN | – | – | 1.72/1134 | 0.000 | 1.65 | 5.13 | ||
| Broken power law (BKPL) model | ||||||||
| 1171/PN | 1.00/1270 | 0.511 | 1.65 | 4.33 | ||||
| 1171/MOS1 | 1.09/373 | 0.112 | 1.76 | 4.50 | ||||
| 1171/MOS2 | 1.04/380 | 0.307 | 1.79 | 4.65 | ||||
| 1266-1/PN | 1.01/1125 | 0.433 | 2.31 | 5.87 | ||||
| 1266-2/PN | 0.96/1224 | 0.818 | 2.61 | 6.56 | ||||
| 1266-3/PN | 1.03/1243 | 0.243 | 2.79 | 6.97 | ||||
| 1266/MOS1 | 1.17/404 | 0.011 | 2.77 | 6.69 | ||||
| 1266/MOS2 | 1.12/400 | 0.044 | 2.80 | 6.93 | ||||
| 0545/PN | 1.02/1132 | 0.289 | 1.56 | 5.06 | ||||
| Logarithmic parabolic (LP) model | ||||||||
| 1171/PN | – | 1.05/1271 | 0.115 | 1.64 | 4.32 | |||
| 1171/MOS1 | – | 1.12/374 | 0.055 | 1.73 | 4.48 | |||
| 1171/MOS2 | – | 1.12/381 | 0.055 | 1.73 | 4.60 | |||
| 1266-1/PN | – | 1.01/1126 | 0.447 | 2.32 | 5.87 | |||
| 1266-2/PN | – | 0.96/1225 | 0.820 | 2.62 | 6.56 | |||
| 1266-3/PN | – | 1.02/1244 | 0.332 | 2.80 | 6.98 | |||
| 1266/MOS1 | – | 1.22/405 | 0.002 | 2.73 | 6.65 | |||
| 1266/MOS2 | – | 1.18/401 | 0.009 | 2.75 | 6.89 | |||
| 0545/PN | – | 1.00/1133 | 0.513 | 1.56 | 5.05 | |||