Spitzer Observations of Star Formation in the Extreme Outer Disk of M83 (NGC5236)
Abstract
Spitzer IRAC observations of two fields in the extended UV disk (XUV-disk) of M83 have been recently obtained, 3 away from the center of the galaxy (=6.6 kpc). GALEX UV images have shown the two fields to host in-situ recent star-formation. The IRAC images are used in conjunction with GALEX data and new HI imaging from The HI Nearby Galaxy Survey (THINGS) to constrain stellar masses and ages of the UV clumps in the fields, and to relate the local recent star formation to the reservoir of available gas. Multi-wavelength photometry in the UV and mid–IR bands of 136 UV clumps (spatial resolution 220 pc) identified in the two target fields, together with model fitting of the stellar UV–MIR spectral energy distributions (SED), suggest that the clumps cover a range of ages between a few Myr and 1 Gyr with a median value around 100 Myr, and have masses in the range 103–3106 M⊙, with a peak . The range of observed ages, for which only a small fraction of the mass in stars appears to have formed in the past 10 Myr, agrees with the dearth of H emission observed in these outer fields. At the location of our IRAC fields, the HI map shows localized enhancement and clumping of atomic gas. A comparison of the observed star formation with the gas reservoir shows that the UV clumps follow the Schmidt–Kennicutt scaling law of star formation, and that star formation is occurring in regions with gas densities at approximately (within a factor of a few) the critical density value derived according to the Toomre Q gravitational stability criterion. The significant 8 excess in several of the clumps (16% of the total by number accounting for 67% of the 8 m flux)) provides evidence for the existence of dust in these remote fields, in agreement with results for other galaxies (e.g. Popescu & Tuffs, 2003). Furthermore, we observe a relatively small excess of emission at 4.5 m in the clumps (14%6% by flux), which suggests contribution from hot small grains ( 1000K), as already observed in other galaxies. From our data, the outer regions of the M83 galaxy disk show evidence of a time-extended star formation history over 1 Gyr, and of a moderately chemically-evolved interstellar medium, in agreement with recent findings on the metallicity of the outer HII regions of M83 (Gil de Paz et al., 2007).
1 Introduction
Star formation in the outer disks of galaxies has multiple implications for our understanding of the formation and evolution of disks, of the laws that govern star formation, and of the interaction of massive stars with the rarefied interstellar medium in those fields. Presence of star formation ensures that those external fields are undergoing some chemical enrichment. Radiative and mechanical feedback from massive stars may be more efficient in a low–density environment, which may thus play a key role in the enrichment of the pristine halo. The star formation process in the outer disk takes place late compared to the inner disk (Mun̈oz-Mateos et al., 2007). Furthermore, the low gas density enables tests of the star formation threshold (Martin & Kennicutt, 2001) and of the relation between gas density and star formation rate density (the Schmidt–Kennicutt Law, Kennicutt, 1998) at the low end of the range. Overall, outer disks provide insights into low–density conditions for the star formation that may have characterized the early disk formation.
Deep H imaging had already revealed outer disk star formation beyond two optical radii () in a few nearby galaxies (Ferguson et al., 1998; Lelievre & Roy, 2000). Broadband observations had also shown presence of significant numbers of B stars in the outer disk of M31 (Cuillandre et al., 2001) and NGC 6822 (de Blok et al., 2003). Unlike their counterparts in the inner disks, the outer disk HII regions are small, faint and isolated. Thus, the presence of such HII regions does not represent a challenge to the notion that H ‘edges’ exist in most disks (Martin & Kennicutt, 2001).
More recently, GALEX has shown that the UV profile of disks extends, with a smooth trend, well beyond the H radius or the R25 of galaxies (Thilker et al., 2005; Gil de Paz et al., 2005, Thilker et al., 2007, in press, Boissier et al., 2007, in press). XUV-disks are apparently common in the present epoch – though not ubiquitous –, as they are found at least at a low level in about one-quarter of the spiral galaxy population (Zaritsky & Christlein,, 2007, Thilker et al. 2007, in press). The UV clumps in the outer disk are generally associated with extended HI structures, and show evidence for metal enrichment, with metallicities in the range Z⊙/5–Z⊙/10 (Gil de Paz et al., 2007). Indeed, extended UV disks are generally hosted within extended HI disks (Thilker et al., 2005; Gil de Paz et al., 2005). Thus, the rarified outer disk is not quiet and star formation process is occurring stealthily in the extended HI disk. The presence of smooth UV surface brightness profiles does not counter the paucity of H emission found in the outer disk UV emission, since the UV probes a larger range of ages than H and at low–star–formation levels the number of ionizing stars may be very small and stochastically absent (Boissier et al., 2007). Thus, the outer disk star formation merits careful investigation, to understand its nature and the conditions under which it occurs.
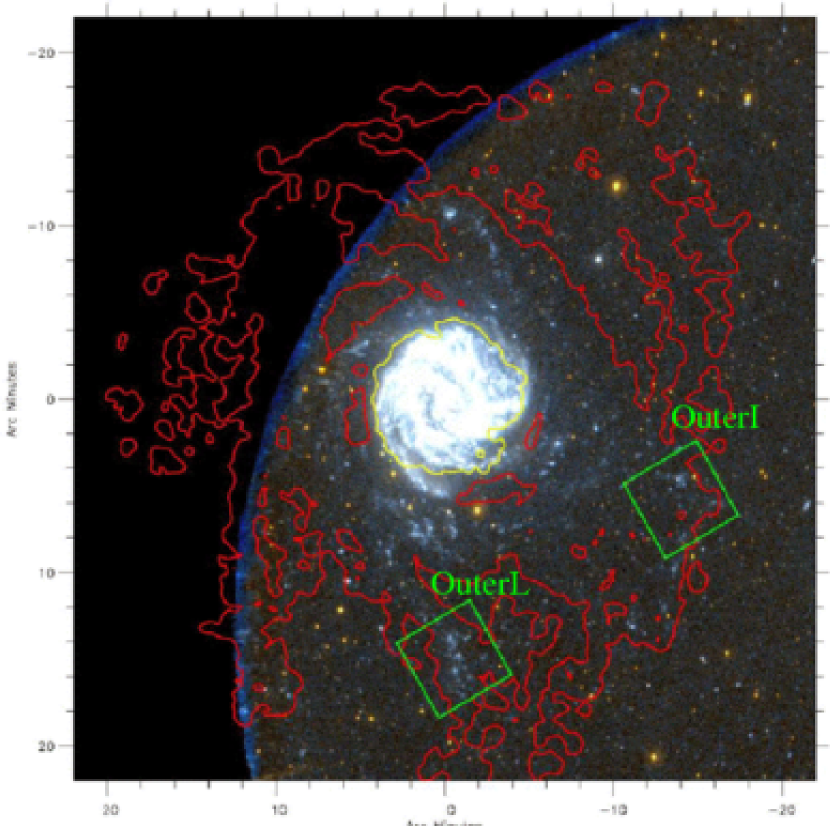
The southern grand-design galaxy M83 (RA(2000): 13h37m00.9s, Dec(2000): -29d51m57s) is a metal rich () Sc galaxy, viewed almost face on (i, Sofue et al., 1999). Its distance, 4.5 Mpc (Thim et al., 2003; Karachentsev, 2005), makes the spatial resolution of Spitzer (2”, 44 pc) and GALEX (5”, 109 pc), sufficient to isolate large star formation complexes. The mean star formation rate per unit area of M83 is roughly 0.04 and the total star formation rate (SFR) is about 5 (Kennicutt, 1998). Therefore, M83 is relatively active among the local normal star forming galaxies. The H emission of M83 has a well–defined ‘edge’ at the galactocentric distance of around 6.6 kpc (Martin & Kennicutt, 2001). M83 also has a very extended HI disk which is about 3 times larger than the optical one (R25). The possibility of a close tidal encounter with its companion NGC 5253, around 1–2 Gyr ago (Rogstad et al., 1974; van den Bergh., 1980) is still controversial, but if confirmed, it could have triggered the starbursts in both galaxies. Additional sources of interaction for this galaxy include dwarf companion galaxies such as KK208 (Karachentseva et al., 1998).
GALEX images of M83 have revealed the presence of more than 100 UV-bright sources grouped in highly structured complexes beyond the radius where the H surface brightness decreases abruptly (Thilker et al., 2005). However, only a few of these UV bright regions (10%-20%) have H counterparts. This apparent discrepancy has been suggested to be due to the wide range of the stellar populations’ age within the outer disk of M83 (Thilker et al., 2005) and/or to the stochastic nature of the stellar IMF at the very low gas densities in these remote regions (Boissier et al., 2007).
New mid–infrared images, from Spitzer IRAC , of two fields in the extreme outskirts of M83 are presented here, and are combined with the GALEX images and a 21 cm (HI) image from The HI Nearby Galaxy Survey (THINGS, Walter et al. (2005, 2008)) to investigate the properties of the UV–bright extended disk; we are exploiting the leverage offered by the multi–wavelength observations to constrain ages and masses, and to infer the star formation characteristics of the UV knots in the outer regions of M83. The targeted IRAC fields show relatively high UV surface brightness and are associated with large scale filamentary HI structures. The THINGS HI image offers about 3 times better angular resolution than pre-existing HI images, and enables us to explore in detail the scaling laws of star formation at a local level.
In section 2, we provide a brief description of our data. We describe in section 3 the methods used to select the sample of regions for the detailed analysis. The analysis of the photometry is presented in section 4 and our results are summarized in section 5.
2 Observations and Data Reduction
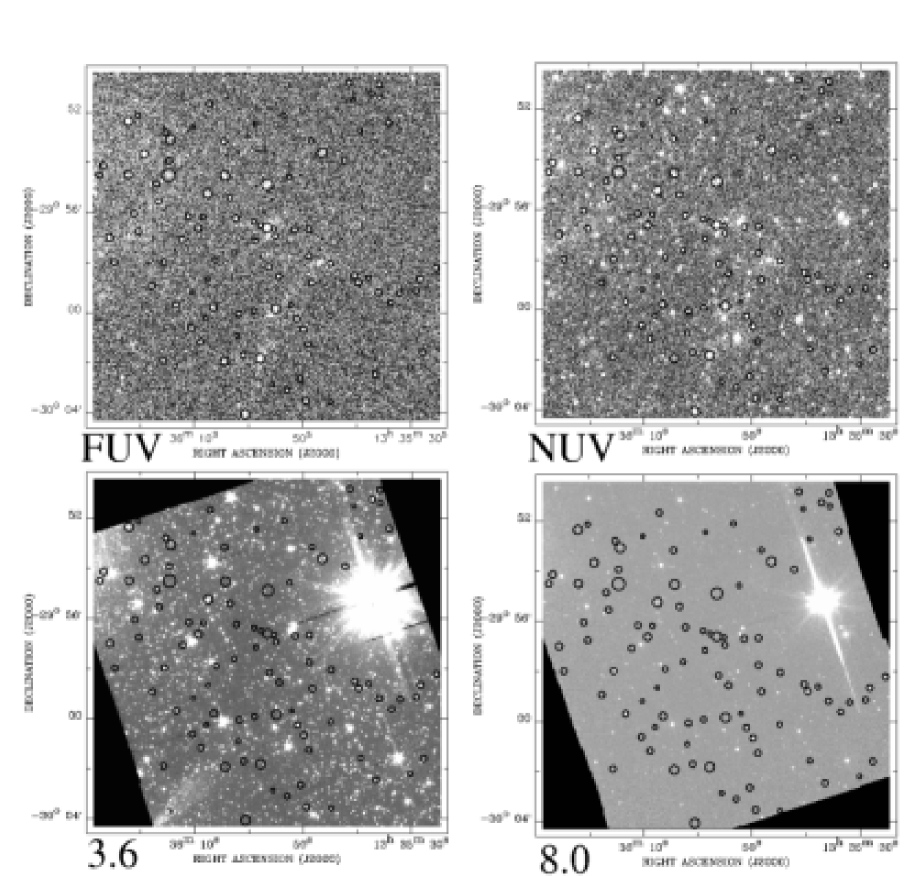
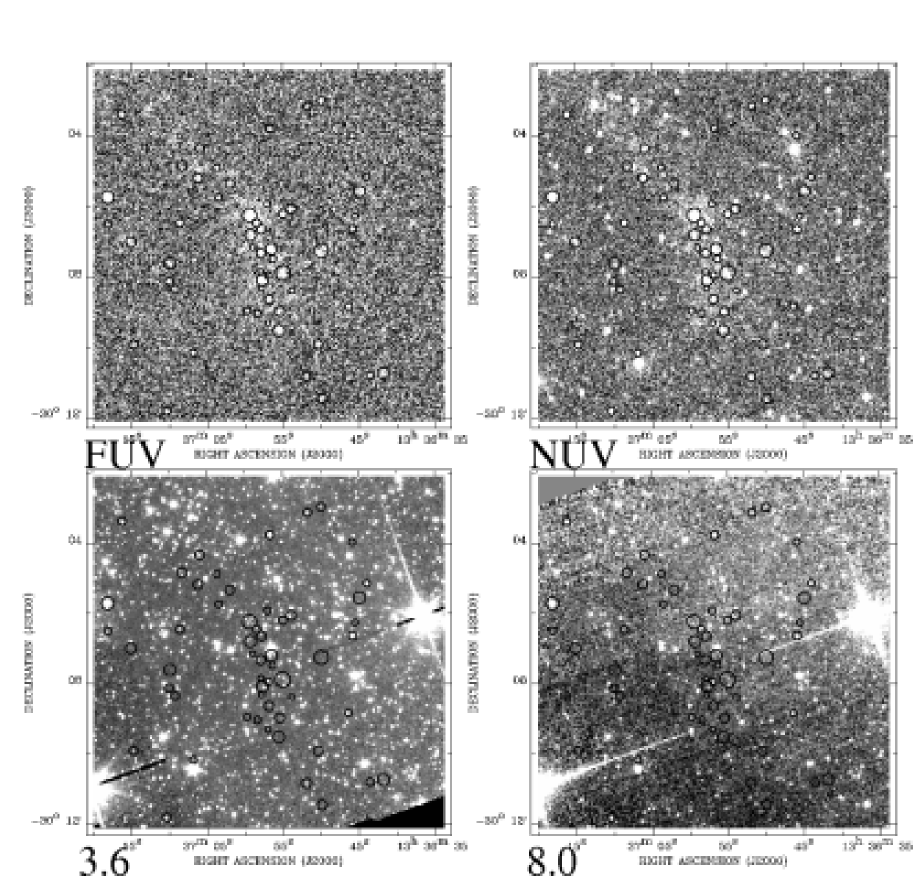
Spitzer images at 3.6, 4.5, 5.8 and 8.0 of two UV bright fields in the outskirts of M83 were obtained during 2005, July using the IRAC instrument (Fazio et al., 2004). The two fields, called OuterI and OuterL, are selected for the combination of both UV-brightness and H deficiency (see Fig. 1) and detailed information of these fields is listed in Table 1. Spitzer IRAC observed each field twice with a time interval of several days to enable removal of asteroids. The two fields were mapped with 47 and 46 grids, for OuterI and OuterL, respectively, with sub-frame steps in order to reach maximum depth in fields of size of 7.5’7.5’ and 7.5’5’. The total observation time per pixel in the center of each map is 480 second, reaching a depth of 0.007 MJy/sr at 3.6 m (1 detection error). The standard Spitzer Infrared Nearby Galaxies Survey (SINGS) IRAC pipeline was employed to create the final mosaics (Kennicutt et al., 2003; Regan et al., 2004).
M83 was observed by GALEX in 2003 in both the far–UV (FUV, 1529 Å) and the near–UV (NUV, 2312 Å), as part of the Nearby Galaxy Survery (NGS; Bianchi et al., 2003; Martin et al., 2005). The total exposure time is 1352 s in each filter and the Point Spread Function has a FWHM=4.6′′. The detailed description of the GALEX observations is provided in Thilker et al. (2005). The GALEX images were aligned, registered, and cropped to match the Field-of-Views (FOVs) of the IRAC images of OuterI and OuterL, respectively, (Fig. 1) and re–sampled to the same pixel size (0.75”/pixel for OuterI and 1”/pixel for OuterL). The GALEX and Spitzer images of OuterI and OuterL are depicted in Fig. 2 and Fig. 3, respectively .
The 21 cm HI image of M83, from THINGS (Walter et al., 2005, 2008), was reduced and calibrated according to standard procedures developed for the THINGS project (e.g. Walter et al., 2005; Kennicutt et al., 2007), with the addition of a careful blanking in the data cube to improve sensitivity in the outer regions of the map. Furthermore, the map has been corrected for the primary beam attenuation, as the two IRAC fields lay at the edges of the half-power point of VLA primary beam (30’ diameter). The final beamsize is 1511′′. The final HI image has also been aligned, registered, and cropped to match both the OuterI and OuterL FOVs.
Images from the 2MASS survey (Skrutskie et al., 2006) at J, H, and Ks were also used in the present analysis to provide a sanity check on our results. The 2MASS images are at least 2 orders of magnitude less deep than our IRAC images, and the resulting uncertainty on the photometry of our sources (which are very faint in the 2MASS fields) prevents the effective use of the 2MASS data in our fitting routines (see below). However, the 2MASS data can still provide consistency checks, and they will be used as such. The 2MASS images corresponding to the locations of our fields where retrieved and aligned to both OuterI and OuterL.
| Target | Field Center Position | Galactocent. | IRAC Map’s | exposure |
|---|---|---|---|---|
| Field | (J2000) | Distance | core size | time(s)aaFor the central map locations, the effective exposure is 480 second |
| M83 OuterI | 13:35:56.02 -29:57:23.0 | 15.06’ (19.71 kpc=2.96 ) | 7.5’7.5’ | 3000 |
| M83 OuterL | 13:36:56.90 -30:06:41.7 | 14.77’ (19.33 kpc=2.91 ) | 7.5’5.0’ | 2573 |
3 Source Identification and Selection
OuterI and OuterL contain a few hundred UV sources, which can be, in addition to star forming regions in M83, background galaxies and foreground stars. Identification of the nature of the sources and of the ”bona fide” IRAC counterparts to their UV emission (rather than chance superpositions) has required extensive investigation. We developed procedures to both exclude distant galaxies and foreground stars (often showing in both the UV and mid-IR, M83 lies at an low ecliptic latitude of ), and flag UV sources that are contaminated in the IRAC bands by chance superposition of physically unrelated mid-IR sources. We applied several steps, as discussed below, to achieve these goals.
We began constructing our sample by selecting FUV– and NUV–emitting regions from the GALEX images in order to include all potential star forming regions. The FUV is sensitive to the young phases of SF (though not effectively instantanenous like H) , while the NUV traces the slightly evolved stellar population (age 100 Myr). Sextractor (version2.4.4, Bertin, E., & Arnouts, S., 1996) was employed to identify all 2 sources, yielding 226 and 133 in OuterI and OuterL, respectively (after manually combining several adjacent and overlapping apertures in the crowded regions). Since the instrument background and sky background of GALEX and Spitzer are much different, we did not use the Sextractor photometry package to measure the flux of these apertures in the IRAC bands. Instead, the IRAF routine ”phot” was used to extract the photometry of the UV–detected sources in all the six GALEXIRAC bands after subtracting the local background from each of them. The radius of each region was selected 5′′ (the GALEX PSF, corresponding to a physical scale 220 pc in diameter). The same position and aperture diameter was used in all six (FUV, NUV, 3.6, 4.5, 5.8 and 8.0 m) bands and aperture corrections are applied to the resulting photometry. All our sources appear point–like at the resolution of both GALEX and Spitzer/IRAC; therefore we apply to each source/bandpass combination the point–source aperture correction appropriate for the chosen region size. For the GALEX measurements, we derived the aperture corrections from photometry with increasing aperture radii of point sources in the M83 field (outside the galaxy); as a sanity check, we compared our results with the aperture corrections published by Morrissey et al. (2007), and found no major discrepancies with our values. For the IRAC measurements, we referred to the point–source aperture corrections published in the IRAC Data Handbook111IRAC Data Handbook, v3.0, Ch. 5; http://ssc.spitzer.caltech.edu/irac/dh/ . Some sources are dim in several bands, and after subtracting the local background, the flux is negative. For these cases, a 1 upper limit has been set.
Uncertainties on the measurements for each source/bandpass combination are a quadratic combination of three contributions: variance of the local background, photometric calibration uncertainties, and variations from potential mis-registration of the multiwavelength images. We find that in all cases the variance of the local background is the predominant source of uncertainty for our measurements, so we only consider this contribution to the uncertainties quoted in Table 2. The local background is derived from fits of the pixel distribution of regions of a few thousands pixels (or about 1/50th of the area of each image) immediately surrounding each aperture, for which we derive the mode and the variance222The routine used for the fits, the IRAF task MSKY written by M. Dickinson (1993, private communication), allows the user to interactively define the interval in the pixel distribution where the mode and variance are calculated. This ensures that robust results are obtained even in the absence of source masking.. Each region was also visually inspected to ensure that no systematic trends in background areas were present. In addition, tests were run on sample apertures to verify that the mode of each local background is not dependent on the size of the area selected for the background measurements: we varied region sizes by up a factor of 2 (both increasing and decreasing) without encountering for the vast majority of cases variations on excess of the measured variances.
Contaminating foreground and background sources are eliminated through several methods. For some nearby stars, we can identify them by their shapes in the 3.6 m images, i.e., by the presence of diffraction spikes. We also exploit HST ACS images of the center parts of the two fields, obtained by one of us (D.T.), to further identify and remove contaminated sources from the sample; the ACS images, thanks to their superior angular resolution, enable a quick recognition of foreground stars and background galaxies. For the most part, we drop from our candidates list any source with strong contamination. In those cases where the contaminating source is physically much smaller than our measurement aperture (e.g., a distant background galaxy) and close to its edge, we shift and resize the measurement aperture to avoid it. In a few instances, a foreground star may lay close to the center of our selected aperture: in these cases, we assume that the FUV and NUV fluxes receive negligible contamination, and we only modify our IRAC photometric measurements, by subtracting the contaminating contribution measured in an inset small radius aperture. In all cases, we apply the point–source aperture correction appropriate for the aperture size selected.
Three especially bright MW stars lie within the FOVs of OuterI (to the right) and OuterL (both right and left), see Fig. 2 and Fig. 3. They have strong wings due to the PSF of the Spitzer IRAC instrument. We reject all apertures that fall within and close to these wings. After all identified contaminating sources are removed from or corrected for in our initial list, there are 166 and 114 regions remaining in the OuterI and OuterL, respectively.
Finally, in order to remove dim foreground low mass stars more completely, we adopt two strong selection criteria: and , where and , in unit of ergs , are the flux of FUV and NUV separately and is the measurement uncertainty. Although the criteria will cause the loss of some clusters with age larger than 1 Gyr (from the prediction of Starburst99, for an instantaneous burst of star formation with 1/5 solar abundance), it is very effective at eliminating low mass stars which emit most of their energy in the optical and near-Infrared band. This ‘loss’ of the oldest clusters will have minimal impact on this analysis, which centers on more recent star formation events (younger than about 1 Gyr).
The final size of our sample is 152 sources: 97 in OuterI and 55 in OuterL. The final source list with their fluxes and 1 uncertainties is listed in table 2. Although we try our best to exclude the possible foreground stars and background galaxies, there are still about 16 sources showing unusual high excess 4.5, 5.8 and 8.0 m flux which cannot be easily explained by stellar population synthesis models (see section 4.4). These sources tend to be among the bright ones in our sample, and we cannot attribute the observed excess to photometric or background subtraction uncertainties. We separate these unusual sources from the other normal sources in table 2. We consider the remaining 136 sources in our final list (although we will carry along the other 16 sources from some of the comparisons, for completeness.)
| RA(J2000) | Dec(J2000) | FUVbbSED fitting results, applying a larger value of the extinction, E(B-V)=0.3, as derived by Gil de Paz et al. (2007) for a few of the HII regions detected in the M83 outskirts. | NUVbbSED fitting results, applying a larger value of the extinction, E(B-V)=0.3, as derived by Gil de Paz et al. (2007) for a few of the HII regions detected in the M83 outskirts. | 3.6bbSED fitting results, applying a larger value of the extinction, E(B-V)=0.3, as derived by Gil de Paz et al. (2007) for a few of the HII regions detected in the M83 outskirts. | 4.5bbSED fitting results, applying a larger value of the extinction, E(B-V)=0.3, as derived by Gil de Paz et al. (2007) for a few of the HII regions detected in the M83 outskirts. | 5.8bbSED fitting results, applying a larger value of the extinction, E(B-V)=0.3, as derived by Gil de Paz et al. (2007) for a few of the HII regions detected in the M83 outskirts. | 8.0bbSED fitting results, applying a larger value of the extinction, E(B-V)=0.3, as derived by Gil de Paz et al. (2007) for a few of the HII regions detected in the M83 outskirts. | |||
|---|---|---|---|---|---|---|---|---|---|---|
| ID | IRAC field | degree | degree | RadiusaaSED fitting results for the 152 sources in the two OuterI and OuterL fields. The values of the color excess used in the fits are E(B)=0.07 for OuterI and E(B)=0.1 for OuterL. These values are derived from the average HI column densities in each region, =3.5 for OuterI and =5 for OuterL, and the extinction–to–HI column density ratio of Bohlin, Savage & Drake (1978). | (1) | (1) | (1) | (1) | (1) | (1) |
| 1 | OuterI | 13 36 22.1 | -29 52 22.1 | 11 | 4048.4( 99.2) | 2700.2(38.5) | 45.6(0.65) | 17.64(0.65) | 7.27(1.96) | 5.2(0.91) |
| 2 | OuterI | 13 36 14.3 | -29 53 05.5 | 11 | 2814.4(106.3) | 1198.2(41.2) | 39.5(0.70) | 19.79(0.70) | 9.85(2.09) | 19.3(0.97) |
| 3 | OuterI | 13 36 19.2 | -29 53 40.8 | 10 | 13617.2( 92.2) | 7391.8(35.8) | 15.1(0.60) | 9.48(0.60) | 11.75(1.81) | 11.3(0.85) |
| 4 | OuterI | 13 36 26.5 | -29 54 10.5 | 8 | 1374.7( 77.9) | 779.7(30.2) | 11.4(0.51) | 7.72(0.51) | 2.75(1.54) | 5.1(0.72) |
| 5 | OuterI | 13 36 17.0 | -29 54 52.1 | 8 | 956.9( 71.0) | 418.5(27.4) | 17.3(0.47) | 8.27(0.47) | 2.67(1.40) | 3.0(0.65) |
| 6 | OuterI | 13 35 56.6 | -29 54 54.1 | 14 | 7945.2(127.5) | 3041.1(49.3) | 31.2(0.84) | 13.60(0.84) | 4.76(2.51) | 6.1(1.17) |
| 7 | OuterI | 13 36 07.5 | -29 55 15.3 | 11 | 3810.2(106.3) | 2926.3(41.2) | 156.6(0.70) | 71.91(0.70) | 24.98(2.09) | 29.4(0.97) |
| 8 | OuterI | 13 36 12.2 | -29 57 06.0 | 8 | 2987.6( 71.0) | 1245.5(27.4) | 57.2(0.47) | 25.08(0.47) | 11.65(1.40) | 2.8(0.65) |
| 9 | OuterI | 13 36 08.9 | -30 01 11.3 | 8 | 1249.1( 71.0) | 887.7(27.4) | 20.0(0.47) | 9.11(0.47) | 6.05(1.40) | 2.7(0.65) |
| 10 | OuterI | 13 35 49.4 | -30 03 32.5 | 8 | 1725.4( 71.0) | 978.8(27.4) | 80.1(0.47) | 40.95(0.47) | 11.70(1.40) | 8.8(0.65) |
| 11 | OuterI | 13 35 51.1 | -30 00 16.3 | 8 | 1095.4( 71.0) | 1015.9(27.4) | 117.8(0.47) | 49.38(0.47) | 22.27(1.40) | 7.6(0.65) |
| 12 | OuterI | 13 35 48.4 | -29 58 48.8 | 8 | 1030.5( 70.8) | 486.0(27.4) | 30.9(0.47) | 15.73(0.47) | 3.88(1.39) | 5.6(0.65) |
| 13 | OuterI | 13 35 25.5 | -29 58 13.0 | 8 | 878.9( 70.8) | 759.4(27.4) | 21.6(0.47) | 7.74(0.47) | 3.68(1.39) | 9.6(0.65) |
| 14 | OuterI | 13 35 40.5 | -29 58 31.4 | 8 | 1195.0( 71.0) | 826.9(27.4) | 41.6(0.47) | 24.10(0.47) | 8.08(1.40) | 14.3(0.65) |
| 15 | OuterI | 13 35 46.5 | -29 53 37.8 | 11 | 2857.7(106.3) | 1765.2(41.2) | 58.4(0.70) | 31.35(0.70) | 11.35(2.09) | 18.2(0.97) |
| 16 | OuterI | 13 35 35.8 | -29 51 24.8 | 6 | 874.6( 56.9) | 489.4(21.9) | 24.4(0.37) | 11.72(0.37) | 4.58(1.12) | 15.4(0.52) |
| 17 | OuterI | 13 36 27.5 | -29 54 30.8 | 8 | 588.9( 71.0) | 968.7(27.4) | 171.6(0.47) | 74.66(0.47) | 28.05(1.40) | 11.2(0.65) |
| 18 | OuterI | 13 36 06.1 | -29 57 55.5 | 6 | 759.9( 56.7) | 803.3(21.9) | 19.1(0.37) | 11.11(0.37) | 3.54(1.11) | 10.0(0.52) |
| 19 | OuterI | 13 36 09.3 | -29 56 38.2 | 9 | 876.8( 85.1) | 1036.2(32.9) | 55.7(0.56) | 31.35(0.56) | 11.40(1.68) | 11.2(0.78) |
| 20 | OuterI | 13 35 45.0 | -30 00 07.9 | 6 | 1026.2( 56.7) | 641.3(21.9) | 27.5(0.37) | 14.54(0.37) | 4.87(1.11) | 9.6(0.52) |
| 21 | OuterI | 13 35 39.5 | -30 01 34.8 | 6 | 617.0( 56.7) | 567.0(21.9) | 14.8(0.37) | 9.19(0.37) | 3.06(1.11) | 7.3(0.52) |
| 22 | OuterI | 13 35 50.5 | -30 02 39.6 | 8 | 326.9( 71.0) | 742.6(27.4) | 12.3(0.47) | 5.04(0.47) | 2.75(1.40) | 1.9(0.65) |
| 23 | OuterI | 13 35 37.2 | -29 51 15.8 | 8 | 439.5( 71.0) | 810.1(27.4) | 243.8(0.47) | 95.82(0.47) | 35.00(1.40) | 11.2(0.65) |
| 24 | OuterI | 13 36 04.5 | -29 53 10.7 | 8 | 1125.7( 70.8) | 637.9(27.4) | 2.8(0.47) | 0.87(0.47) | 2.83(1.39) | 0.6(0.65) |
| 25 | OuterI | 13 36 04.3 | -29 54 32.5 | 11 | 3680.3(106.3) | 1586.4(41.2) | 0.6(0.70) | 0.44(0.70) | 2.69(2.09) | 0.7(0.97) |
| 26 | OuterI | 13 36 16.5 | -29 55 33.7 | 8 | 1309.8( 71.0) | 398.3(27.4) | 12.5(0.47) | 3.68(0.47) | 2.36(1.40) | 0.4(0.65) |
| 27 | OuterI | 13 36 25.6 | -29 57 01.2 | 9 | 1680.0( 85.1) | 418.5(32.9) | 82.0(0.56) | 33.51(0.56) | 14.49(1.68) | 1.5(0.78) |
| 28 | OuterI | 13 36 20.3 | -29 56 46.5 | 8 | 1428.8( 71.0) | 381.4(27.4) | 4.2(0.47) | 3.31(0.47) | 0.68(1.40) | 0.6(0.65) |
| 29 | OuterI | 13 36 02.3 | -29 56 15.3 | 8 | 1980.9( 71.0) | 789.8(27.4) | 0.0(0.47) | 0.32(0.47) | 0.85(1.40) | 0.3(0.65) |
| 30 | OuterI | 13 35 59.1 | -29 56 23.5 | 6 | 2084.8( 56.7) | 594.0(21.9) | 0.2(0.37) | 0.05(0.37) | 0.71(1.11) | 1.3(0.52) |
| 31 | OuterI | 13 35 58.7 | -29 57 10.4 | 6 | 2944.3( 56.9) | 1340.0(21.9) | 0.8(0.37) | 1.14(0.37) | 1.53(1.12) | 0.6(0.52) |
| 32 | OuterI | 13 35 57.7 | -29 56 31.3 | 6 | 1099.8( 56.9) | 489.4(21.9) | 0.3(0.37) | 0.26(0.37) | 0.71(1.12) | 0.5(0.52) |
| 33 | OuterI | 13 35 56.6 | -29 56 37.5 | 11 | 13465.7(106.3) | 6075.4(41.2) | 8.1(0.70) | 5.94(0.70) | 3.33(2.09) | 2.9(0.97) |
| 34 | OuterI | 13 35 55.3 | -29 56 40.3 | 6 | 2294.8( 56.7) | 850.6(21.9) | 1.2(0.32) | 0.73(0.32) | 0.42(0.97) | 0.4(0.45) |
| 35 | OuterI | 13 36 06.5 | -29 59 48.4 | 9 | 2468.0( 85.1) | 718.9(32.9) | 0.3(0.56) | 0.25(0.56) | 0.97(1.68) | 0.6(0.78) |
| 36 | OuterI | 13 35 56.3 | -29 58 10.7 | 8 | 1801.2( 70.8) | 745.9(27.4) | 4.3(0.47) | 1.55(0.47) | 0.33(1.39) | 0.3(0.65) |
| 37 | OuterI | 13 35 54.4 | -29 58 34.3 | 8 | 1127.9( 71.0) | 391.5(27.4) | 2.2(0.47) | 3.06(0.47) | 1.00(1.40) | 0.2(0.65) |
| 38 | OuterI | 13 35 55.0 | -29 59 51.2 | 11 | 4199.9(106.3) | 1518.9(41.2) | 8.3(0.70) | 3.59(0.70) | 1.54(2.09) | 0.1(0.97) |
| 39 | OuterI | 13 36 10.5 | -30 00 38.3 | 8 | 989.4( 71.0) | 739.2(27.4) | 4.7(0.47) | 2.41(0.47) | 1.98(1.40) | 1.0(0.65) |
| 40 | OuterI | 13 36 15.8 | -30 01 54.9 | 8 | 1260.0( 71.0) | 607.5(27.4) | 6.9(0.47) | 4.21(0.47) | 1.93(1.40) | 7.0(0.65) |
| 41 | OuterI | 13 36 04.4 | -30 01 57.0 | 11 | 1569.5( 99.2) | 570.4(38.5) | 10.0(0.65) | 4.66(0.65) | 1.93(1.96) | 0.7(0.91) |
| 42 | OuterI | 13 36 01.0 | -30 01 43.1 | 8 | 1253.5( 71.0) | 546.8(27.4) | 15.3(0.47) | 6.84(0.47) | 1.85(1.40) | 0.4(0.65) |
| 43 | OuterI | 13 35 57.9 | -30 01 50.2 | 11 | 5065.9(106.3) | 2420.0(41.2) | 19.7(0.70) | 8.21(0.70) | 2.90(2.09) | 1.8(0.97) |
| 44 | OuterI | 13 36 00.7 | -30 04 04.5 | 11 | 3290.6(106.3) | 1758.5(41.2) | 0.5(0.70) | 0.95(0.70) | 0.75(2.09) | 0.3(0.97) |
| 45 | OuterI | 13 35 36.0 | -29 59 11.8 | 8 | 840.0( 70.8) | 421.9(27.4) | 9.1(0.47) | 3.35(0.47) | 0.57(1.39) | 2.1(0.65) |
| 46 | OuterI | 13 35 44.9 | -29 58 03.4 | 8 | 1608.5( 71.0) | 567.0(27.4) | 3.6(0.47) | 1.11(0.47) | 0.33(1.40) | 0.1(0.65) |
| 47 | OuterI | 13 36 14.6 | -29 53 56.9 | 8 | 346.4( 71.0) | 749.3(27.4) | 16.0(0.47) | 8.43(0.47) | 2.09(1.40) | 8.6(0.65) |
| 48 | OuterI | 13 36 15.3 | -29 52 48.7 | 8 | 378.9( 71.0) | 843.8(27.4) | 25.6(0.47) | 10.93(0.47) | 0.66(1.40) | 1.7(0.65) |
| 49 | OuterI | 13 36 010. | -29 52 37.4 | 5 | 287.9( 42.4) | 418.5(16.5) | 6.4(0.28) | 2.82(0.28) | 0.27(0.84) | 0.5(0.39) |
| 50 | OuterI | 13 35 58.6 | -29 52 27.5 | 5 | 242.5( 42.4) | 325.4(16.5) | 3.1(0.28) | 0.91(0.28) | 0.36(0.84) | 0.1(0.39) |
| 51 | OuterI | 13 35 40.6 | -29 51 30.9 | 5 | 456.8( 65.2) | 1026.1(24.1) | 23.3(0.41) | 8.37(0.42) | 0.91(1.22) | 0.0(0.59) |
| 52 | OuterI | 13 36 07.6 | -29 58 40.5 | 5 | 257.6( 42.4) | 371.3(16.5) | 32.1(0.28) | 12.66(0.28) | 5.39(0.84) | 0.4(0.39) |
| 53 | OuterI | 13 36 07.9 | -30 00 15.0 | 5 | 521.7( 49.6) | 658.2(19.2) | 4.4(0.33) | 2.33(0.33) | 1.96(0.98) | 0.4(0.45) |
| 54 | OuterI | 13 35 52.1 | -29 59 42.2 | 5 | 519.6( 42.4) | 408.4(16.5) | 1.3(0.28) | 0.28(0.28) | 1.06(0.84) | 0.2(0.39) |
| 55 | OuterI | 13 36 07.1 | -29 51 41.1 | 8 | 592.6( 71.0) | 358.8(27.4) | 0.9(0.47) | 0.89(0.47) | 0.85(1.40) | 0.6(0.65) |
| 56 | OuterI | 13 36 14.6 | -29 54 31.5 | 15 | 3788.6(141.7) | 1066.6(54.8) | 16.2(0.93) | 12.61(0.93) | 3.40(2.79) | 2.3(1.30) |
| 57 | OuterI | 13 36 24.8 | -29 58 00.1 | 8 | 708.8( 71.0) | 315.4(27.4) | 3.8(0.47) | 0.58(0.47) | 3.75(1.40) | 3.4(0.65) |
| 58 | OuterI | 13 35 27.9 | -30 01 36.0 | 8 | 1027.9( 71.0) | 331.6(27.4) | 70.2(0.47) | 27.10(0.47) | 11.14(1.40) | 2.1(0.65) |
| 59 | OuterI | 13 35 42.3 | -29 53 56.5 | 8 | 790.9( 71.0) | 514.1(27.4) | 11.1(0.47) | 6.94(0.47) | 1.66(1.40) | 5.1(0.65) |
| 60 | OuterI | 13 36 20.4 | -29 52 05.9 | 6 | 338.5( 56.7) | 281.9(21.9) | 4.3(0.37) | 3.69(0.37) | 4.58(1.12) | 0.8(0.52) |
| 61 | OuterI | 13 36 22.1 | -29 54 30.7 | 10 | 1530.4( 92.1) | 805.6(35.7) | 8.2(0.61) | 2.85(0.60) | 1.02(1.81) | 0.7(0.84) |
| 62 | OuterI | 13 36 21.1 | -29 56 03.8 | 8 | 1021.1( 71.0) | 291.9(27.4) | 3.0(0.47) | 0.37(0.47) | 1.70(1.40) | 0.8(0.65) |
| 63 | OuterI | 13 36 11.1 | -29 56 10.5 | 8 | 893.4( 71.0) | 521.4(27.4) | 13.3(0.47) | 6.85(0.47) | 1.70(1.40) | 3.8(0.65) |
| 64 | OuterI | 13 36 01.8 | -30 00 04.5 | 8 | 647.3( 71.0) | 333.1(27.4) | 6.2(0.47) | 1.86(0.47) | 0.85(1.40) | 2.1(0.65) |
| 65 | OuterI | 13 35 36.6 | -30 02 28.1 | 8 | 806.8( 71.0) | 211.1(27.4) | 13.7(0.47) | 6.35(0.47) | 1.35(1.40) | 2.8(0.65) |
| 66 | OuterI | 13 35 48.9 | -29 57 45.5 | 8 | 806.8( 71.0) | 325.0(27.4) | 3.0(0.47) | 1.65(0.47) | 3.03(1.40) | 0.2(0.65) |
| 67 | OuterI | 13 35 51.5 | -29 56 42.5 | 8 | 713.4( 57.1) | 672.0(23.3) | 8.1(0.39) | 3.60(0.39) | 5.23(1.19) | 0.5(0.53) |
| 68 | OuterI | 13 35 35.9 | -29 50 53.2 | 8 | 467.2( 57.1) | 350.0(23.3) | 5.1(0.39) | 1.16(0.39) | 1.16(1.19) | 0.9(0.53) |
| 69 | OuterI | 13 35 41.5 | -29 50 50.4 | 8 | 692.9( 71.0) | 251.5(27.4) | 3.9(0.47) | 2.21(0.47) | 0.85(1.40) | 0.6(0.65) |
| 70 | OuterI | 13 35 49.0 | -30 01 16.3 | 8 | 542.4( 71.0) | 22.1(27.4) | 1.8(0.47) | 0.58(0.47) | 0.85(1.40) | 1.5(0.65) |
| 71 | OuterI | 13 35 59.0 | -29 59 56.2 | 7 | 673.5( 63.9) | 518.4(24.7) | 4.3(0.42) | 2.29(0.42) | 5.43(1.26) | 1.7(0.58) |
| 72 | OuterI | 13 36 02.8 | -29 57 38.2 | 6 | 426.0( 56.8) | 455.4(21.9) | 7.7(0.37) | 3.64(0.37) | 2.62(1.12) | 2.0(0.52) |
| 73 | OuterI | 13 36 02.1 | -30 00 55.5 | 5 | 273.1( 49.6) | 358.7(19.2) | 12.2(0.33) | 5.90(0.33) | 2.74(0.98) | 2.5(0.45) |
| 74 | OuterI | 13 35 55.7 | -30 02 52.7 | 5 | 296.2( 49.6) | 311.3(19.2) | 10.6(0.33) | 4.47(0.33) | 5.12(0.98) | 1.3(0.45) |
| 75 | OuterI | 13 35 44.9 | -30 03 36.9 | 5 | 261.5( 49.6) | 557.0(19.2) | 15.4(0.33) | 10.34(0.33) | 5.35(0.98) | 0.4(0.45) |
| 76 | OuterI | 13 35 53.0 | -30 03 06.7 | 7 | 815.6( 63.9) | 436.9(24.7) | 7.8(0.42) | 6.25(0.42) | 3.09(1.26) | 2.0(0.58) |
| 77 | OuterI | 13 35 29.2 | -29 59 08.3 | 7 | 643.7( 63.9) | 403.6(24.7) | 60.7(0.42) | 29.28(0.42) | 8.23(1.26) | 5.0(0.58) |
| 78 | OuterI | 13 35 32.1 | -29 59 14.1 | 7 | 410.1( 63.7) | 599.8(24.7) | 9.5(0.42) | 2.82(0.42) | 0.78(1.26) | 0.5(0.58) |
| 79 | OuterI | 13 35 33.8 | -29 59 37.7 | 7 | 611.7( 63.7) | 388.8(24.7) | 11.8(0.42) | 7.62(0.42) | 0.78(1.26) | 2.1(0.58) |
| 80 | OuterI | 13 35 38.0 | -29 58 37.5 | 6 | 605.6( 56.7) | 316.2(21.9) | 11.3(0.37) | 6.68(0.37) | 4.42(1.12) | 0.6(0.52) |
| 81 | OuterI | 13 35 52.5 | -29 54 35.0 | 6 | 393.7( 56.7) | 360.2(21.9) | 11.7(0.37) | 6.44(0.37) | 4.54(1.12) | 6.4(0.52) |
| 82 | OuterI | 13 35 48.4 | -29 53 10.1 | 6 | 578.0( 56.7) | 466.6(21.9) | 15.9(0.37) | 7.82(0.37) | 3.86(1.12) | 2.5(0.52) |
| 83 | OuterI | 13 35 53.5 | -29 52 07.0 | 6 | 538.8( 56.7) | 392.0(21.9) | 18.0(0.37) | 9.09(0.37) | 3.19(1.12) | 5.1(0.52) |
| 84 | OuterI | 13 35 39.5 | -29 52 43.6 | 5 | 541.6( 49.6) | 250.7(19.2) | 6.2(0.33) | 0.09(0.33) | 14.01(0.98) | 1.7(0.45) |
| 85 | OuterL | 13 36 55.1 | -30 05 48.7 | 7 | 5000.9(118.6) | 2990.5(33.4) | 4.0(0.68) | 1.71(0.66) | 2.39(1.82) | 5.0(1.04) |
| 86 | OuterL | 13 36 59.5 | -30 05 49.7 | 12 | 8464.7(203.5) | 4927.8(57.0) | 41.1(1.16) | 18.92(1.13) | 8.57(3.12) | 4.5(1.78) |
| 87 | OuterL | 13 37 15.2 | -30 06 30.4 | 9 | 2446.3(152.6) | 1036.2(42.9) | 6.6(0.87) | 2.79(0.85) | 3.54(2.34) | 1.6(1.33) |
| 88 | OuterL | 13 37 07.3 | -30 09 42.1 | 6 | 1275.1(101.8) | 594.0(28.6) | 9.8(0.58) | 4.74(0.57) | 5.17(1.56) | 1.6(0.89) |
| 89 | OuterL | 13 36 54.0 | -30 05 40.5 | 8 | 1677.8(135.5) | 1498.6(38.1) | 40.5(0.77) | 17.87(0.75) | 7.44(2.08) | 8.1(1.18) |
| 90 | OuterL | 13 36 58.6 | -30 06 03.4 | 7 | 2251.5(118.6) | 1461.5(33.4) | 5.1(0.68) | 2.78(0.66) | 8.05(1.82) | 10.4(1.04) |
| 91 | OuterL | 13 36 46.7 | -30 08 28.8 | 6 | 2026.3(101.8) | 1407.5(28.6) | 56.0(0.58) | 24.14(0.57) | 12.99(1.56) | 2.4(0.89) |
| 92 | OuterL | 13 37 05.9 | -30 03 54.2 | 8 | 989.4(135.7) | 907.9(38.1) | 40.5(0.77) | 17.18(0.75) | 9.05(2.08) | 3.4(1.18) |
| 93 | OuterL | 13 36 46.0 | -30 06 17.7 | 7 | 779.4(118.6) | 1302.8(33.4) | 70.2(0.68) | 32.64(0.66) | 15.50(1.82) | 4.3(1.04) |
| 94 | OuterL | 13 36 57.3 | -30 05 33.5 | 6 | 1489.4(101.8) | 735.8(28.6) | 2.9(0.58) | 0.44(0.57) | 0.97(1.56) | 1.1(0.89) |
| 95 | OuterL | 13 36 57.9 | -30 06 14.6 | 8 | 2359.7(135.5) | 1073.3(38.1) | 3.6(0.77) | 0.45(0.75) | 2.39(2.08) | 0.9(1.18) |
| 96 | OuterL | 13 36 59.4 | -30 06 23.2 | 10 | 2749.4(169.7) | 1410.8(47.6) | 6.0(0.97) | 6.55(0.94) | 2.54(2.60) | 0.3(1.48) |
| 97 | OuterL | 13 36 56.7 | -30 06 48.2 | 10 | 7707.0(169.7) | 4286.5(47.6) | 27.4(0.58) | 11.29(0.57) | 3.00(1.56) | 1.5(0.89) |
| 98 | OuterL | 13 36 58.1 | -30 06 55.3 | 8 | 2662.8(135.7) | 1363.6(38.1) | 6.4(0.77) | 3.62(0.75) | 1.36(2.08) | 0.3(1.18) |
| 99 | OuterL | 13 36 58.0 | -30 07 40.7 | 10 | 3269.0( 48.5) | 1046.3(13.6) | 17.4(0.26) | 8.01(0.27) | 2.20(0.74) | 1.4(0.43) |
| 100 | OuterL | 13 36 54.2 | -30 08 00.6 | 5 | 1530.6( 84.9) | 931.6(23.9) | 2.8(0.48) | 0.52(0.47) | 1.41(1.30) | 1.1(0.74) |
| 101 | OuterL | 13 36 57.2 | -30 08 14.1 | 8 | 2141.1(135.5) | 1400.7(38.1) | 4.7(0.77) | 1.95(0.75) | 0.53(2.08) | 2.7(1.18) |
| 102 | OuterL | 13 36 50.1 | -30 06 53.2 | 12 | 1946.2(172.1) | 860.7(40.2) | 0.9(1.00) | 0.44(0.95) | 8.05(2.65) | 0.4(1.50) |
| 103 | OuterL | 13 36 55.8 | -30 08 35.0 | 8 | 2048.0(135.7) | 776.3(38.1) | 1.8(0.77) | 2.06(0.75) | 1.93(2.08) | 2.0(1.18) |
| 104 | OuterL | 13 36 50.8 | -30 09 32.5 | 8 | 1182.0(135.5) | 300.4(38.1) | 7.2(0.77) | 2.72(0.75) | 1.50(2.08) | 2.6(1.18) |
| 105 | OuterL | 13 36 56.0 | -30 09 07.3 | 10 | 2468.0(169.7) | 1346.7(47.6) | 1.3(0.97) | 0.30(0.94) | 2.03(2.60) | 0.3(1.48) |
| 106 | OuterL | 13 36 49.8 | -30 02 37.3 | 7 | 1753.6(118.6) | 1515.5(33.4) | 5.5(0.68) | 2.67(0.66) | 3.48(1.82) | 0.4(1.04) |
| 107 | OuterL | 13 37 06.2 | -30 04 44.2 | 8 | 2154.1(135.7) | 2146.6(38.1) | 31.4(0.77) | 12.37(0.75) | 4.23(2.08) | 0.5(1.18) |
| 108 | OuterL | 13 37 08.7 | -30 06 00.2 | 7 | 1872.6(118.6) | 1262.3(33.4) | 10.6(0.68) | 4.56(0.66) | 2.07(1.82) | 2.8(1.04) |
| 109 | OuterL | 13 37 03.5 | -30 05 18.5 | 6 | 956.9(101.8) | 415.2(28.6) | 1.5(0.58) | 0.33(0.57) | 0.30(1.56) | 2.2(0.89) |
| 110 | OuterL | 13 37 03.7 | -30 04 27.1 | 6 | 917.9(101.8) | 266.3(28.6) | 5.4(0.58) | 2.19(0.57) | 1.06(1.56) | 0.4(0.89) |
| 111 | OuterL | 13 36 52.4 | -30 10 26.9 | 8 | 850.8(135.5) | 1107.1(38.1) | 23.2(0.77) | 8.88(0.75) | 0.08(2.08) | 1.8(1.18) |
| 112 | OuterL | 13 36 50.4 | -30 11 04.5 | 8 | 1002.3(135.7) | 384.8(38.1) | 0.9(0.77) | 2.86(0.75) | 1.38(2.08) | 0.5(1.18) |
| 113 | OuterL | 13 36 55.3 | -30 07 29.4 | 13 | 2424.7(220.8) | 1691.0(62.1) | 18.0(1.18) | 10.73(1.15) | 2.72(3.18) | 2.7(1.81) |
| 114 | OuterL | 13 36 45.6 | -30 05 55.4 | 5 | 961.2( 84.9) | 401.7(23.9) | 0.2(0.48) | 0.57(0.47) | 0.46(1.30) | 0.9(0.74) |
| 115 | OuterL | 13 37 10.3 | -30 07 39.4 | 7 | 956.9(118.6) | 344.3(33.4) | 5.9(0.68) | 1.80(0.66) | 0.33(1.82) | 1.5(1.04) |
| 116 | OuterL | 13 36 45.0 | -30 05 13.5 | 10 | 1961.4(169.5) | 982.2(47.6) | 2.6(0.97) | 1.81(0.94) | 1.42(2.60) | 0.2(1.48) |
| 117 | OuterL | 13 36 59.2 | -30 06 45.4 | 5 | 1405.0( 84.9) | 1083.5(23.9) | 0.5(0.19) | 0.30(0.19) | 0.52(0.52) | 0.0(0.30) |
| 118 | OuterL | 13 36 51.6 | -30 02 46.1 | 7 | 459.0(118.6) | 432.0(33.4) | 11.2(0.68) | 6.41(0.66) | 1.67(1.82) | 4.7(1.04) |
| 119 | OuterL | 13 37 10.0 | -30 07 37.7 | 10 | 1355.2(169.6) | 517.7(47.6) | 0.3(0.97) | 0.32(0.94) | 0.99(2.60) | 0.4(1.48) |
| 120 | OuterL | 13 36 41.9 | -30 10 46.1 | 10 | 2231.1(169.6) | 699.8(47.6) | 1.8(0.97) | 3.25(0.94) | 0.99(2.60) | 0.4(1.48) |
| 121 | OuterL | 13 36 43.7 | -30 10 50.0 | 7 | 919.4(118.7) | 568.6(33.4) | 3.3(0.68) | 0.84(0.66) | 0.35(1.82) | 1.3(1.04) |
| 122 | OuterL | 13 36 56.8 | -30 03 49.1 | 7 | 651.8(118.7) | 259.2(33.4) | 60.9(0.68) | 32.67(0.66) | 16.40(1.82) | 5.2(1.04) |
| 123 | OuterL | 13 36 46.0 | -30 04 01.7 | 6 | 651.6(101.8) | 380.8(28.6) | 20.2(0.58) | 0.21(0.56) | 2.21(1.56) | 0.3(0.89) |
| 124 | OuterL | 13 37 02.1 | -30 05 22.4 | 8 | 1183.4(135.6) | 322.8(38.1) | 1.8(0.77) | 0.13(0.75) | 0.62(2.08) | 0.2(1.18) |
| 125 | OuterL | 13 37 08.4 | -30 04 52.4 | 8 | 897.2(135.6) | 434.6(38.1) | 19.5(0.77) | 10.11(0.75) | 4.07(2.08) | 2.7(1.18) |
| 126 | OuterL | 13 37 09.3 | -30 08 22.5 | 7 | 917.1(118.6) | 305.0(33.4) | 2.6(0.68) | 0.53(0.66) | 0.64(1.82) | 0.3(1.04) |
| 127 | OuterL | 13 36 59.8 | -30 08 58.8 | 6 | 660.9(101.8) | 283.3(28.6) | 2.3(0.58) | 1.43(0.57) | 3.04(1.56) | 0.4(0.89) |
| 128 | OuterL | 13 36 58.5 | -30 09 03.7 | 6 | 594.1(101.8) | 216.5(28.6) | 0.2(0.58) | 0.21(0.56) | 0.67(1.56) | 0.3(0.89) |
| 129 | OuterL | 13 37 18.1 | -30 06 30.9 | 6 | 723.0(101.8) | 392.0(28.6) | 10.3(0.58) | 4.33(0.56) | 2.84(1.56) | 0.3(0.89) |
| 130 | OuterL | 13 36 44.1 | -30 05 11.8 | 6 | 582.6(101.8) | 403.2(28.6) | 22.6(0.58) | 14.42(0.57) | 7.12(1.56) | 10.1(0.89) |
| 131 | OuterL | 13 37 14.8 | -30 09 55.7 | 7 | 773.0(118.7) | 546.5(33.4) | 5.1(0.68) | 0.67(0.66) | 0.92(1.82) | 0.3(1.04) |
| 132 | OuterL | 13 36 56.5 | -30 07 31.0 | 6 | 1022.4(101.8) | 630.9(28.6) | 0.4(0.58) | 0.21(0.57) | 0.67(1.56) | 0.3(0.89) |
| 133 | OuterL | 13 36 58.0 | -30 07 52.9 | 5 | 823.0( 84.8) | 509.5(23.9) | 1.2(0.48) | 0.56(0.47) | 0.41(1.30) | 0.5(0.74) |
| 134 | OuterL | 13 36 57.9 | -30 08 20.8 | 5 | 635.2( 84.8) | 486.8(23.9) | 2.8(0.48) | 1.22(0.47) | 1.44(1.30) | 0.4(0.74) |
| 135 | OuterL | 13 36 57.1 | -30 07 59.0 | 6 | 536.5(101.8) | 873.6(28.6) | 65.8(0.58) | 27.69(0.57) | 9.00(1.56) | 2.5(0.89) |
| 136 | OuterL | 13 36 57.1 | -30 09 19.8 | 5 | 665.3( 84.8) | 352.5(23.9) | 3.5(0.48) | 1.81(0.47) | 0.89(1.30) | 0.8(0.74) |
| Sources with unusual high excess 4.5, 5.8 and 8.0 m flux | ||||||||||
| 137 | OuterI | 13 36 03.4 | -29 55 25.7 | 8 | 1420.2( 70.8) | 742.6(27.4) | 57.5(0.47) | 29.98(0.47) | 15.08(1.39) | 39.5(0.65) |
| 138 | OuterI | 13 35 55.1 | -29 56 57.5 | 7 | 3702.0( 63.9) | 1937.4(24.7) | 13.7(0.42) | 7.54(0.42) | 8.18(1.26) | 5.7(0.58) |
| 139 | OuterI | 13 36 13.4 | -29 59 42.1 | 8 | 1474.3( 71.0) | 2028.5(27.4) | 61.2(0.47) | 61.33(0.47) | 51.61(1.40) | 35.7(0.65) |
| 140 | OuterI | 13 35 49.9 | -30 00 40.7 | 8 | 5022.6( 71.0) | 5299.1(27.4) | 56.0(0.47) | 55.45(0.47) | 50.67(1.40) | 40.0(0.65) |
| 141 | OuterI | 13 35 28.4 | -29 58 39.7 | 8 | 1907.3( 71.0) | 1437.9(27.4) | 52.0(0.47) | 21.95(0.47) | 13.67(1.40) | 24.9(0.65) |
| 142 | OuterI | 13 35 39.8 | -29 58 48.3 | 8 | 1405.0( 71.0) | 1066.6(27.4) | 75.6(0.47) | 43.50(0.47) | 19.21(1.40) | 65.1(0.65) |
| 143 | OuterI | 13 36 15.6 | -29 58 00.0 | 8 | 493.6( 71.0) | 864.1(27.4) | 93.3(0.47) | 60.74(0.47) | 41.36(1.40) | 68.2(0.65) |
| 144 | OuterI | 13 35 48.9 | -29 56 40.9 | 8 | 532.6( 71.0) | 617.7(27.4) | 24.3(0.47) | 20.77(0.47) | 15.79(1.40) | 9.4(0.65) |
| 145 | OuterI | 13 35 34.1 | -29 52 25.5 | 8 | 703.6( 71.0) | 621.0(27.4) | 61.5(0.47) | 34.68(0.47) | 18.38(1.40) | 20.5(0.65) |
| 146 | OuterI | 13 36 10.3 | -29 59 12.0 | 5 | 322.6( 42.4) | 388.2(16.5) | 31.5(0.28) | 15.52(0.28) | 9.17(0.84) | 21.6(0.39) |
| 147 | OuterI | 13 36 17.8 | -29 58 57.1 | 8 | 1030.2( 71.0) | 223.6(27.4) | 26.8(0.47) | 14.98(0.47) | 8.94(1.40) | 8.8(0.65) |
| 148 | OuterI | 13 36 08.4 | -29 56 11.9 | 6 | 561.8( 56.7) | 380.8(21.9) | 21.5(0.37) | 12.85(0.37) | 8.66(1.12) | 6.1(0.52) |
| 149 | OuterI | 13 35 30.3 | -30 02 12.1 | 5 | 425.8( 49.6) | 342.5(19.2) | 15.2(0.33) | 8.91(0.33) | 5.46(0.98) | 10.2(0.45) |
| 150 | OuterL | 13 37 16.0 | -30 02 53.2 | 7 | 1340.1(118.9) | 2028.5(33.4) | 31.0(0.68) | 26.34(0.66) | 21.16(1.82) | 16.5(1.04) |
| 151 | OuterL | 13 37 18.1 | -30 05 13.0 | 11 | 8140.0(186.4) | 6986.7(52.3) | 176.2(1.06) | 79.08(1.03) | 74.38(2.87) | 113.5(1.63) |
| 152 | OuterL | 13 37 10.9 | -30 11 20.1 | 7 | 610.5(118.6) | 853.9(33.4) | 25.3(0.68) | 18.88(0.66) | 19.36(1.82) | 5.7(1.04) |
Note. — (a) Radius of the photometric aperture, in units of arc second. (b) Fluxes are in units of ; the 1 error bars are indicated in parenthesis, following the flux value. For FUV and NUV band, the flux has been corrected for the foreground Milky Way extinction, E(B-V)=0.066 [ and (Wyder et al., 2005)] after convolving the GALEX spectral response curve with the Galaxy’s extinction curve, using the relation of Cardelli, Clayton & Mathis (1989) with RV=3.1); the flux in the SpitzerIRAC bands is assumed to be extinction free.
4 Analysis
4.1 Stellar populations’ modelling
The age and mass of each source is constrained by fitting the UVMIR bands with models of the spectral energy distribution (SEDs) of single–age stellar populations. This implicitly assumes that the emission in the IRAC bands is due to photospheric emission from stars. This is a reasonable assumption for the 3.6 and 4.5 m bands (Pahre et al., 2004; Calzetti et al., 2005). The 5.8 and 8 m band potentially contain a significant (or dominant) contribution from dust emission, due to Policyclic Aromatic Hydrocarbons single–photon heated by the stellar populations; to evaluate the impact of dust emission on our stellar population fits, we create a dust–only 8 m image by rescaling and subtracting the 3.6 m image from the 8 m one. The resulting dust–only image shows a number of sources with detected dust emission, in most cases a weak detection, in agreement with the expectation that low–metallicity regions have underluminous 8 m dust emission (Engelbracht et al., 2005; Calzetti et al., 2007). However, to prevent out fitting results from being even mildly contaminated by dust emission contributions, we use only the two IRAC bands at the shortest wavelengths in our fits, together with the two GALEX bands (next section).
The theoretical SEDs are from the Starburst99 stellar population synthesis models (Leitherer et al., 1999; Vzquez et al., 2005). We select instantaneous burst populations, since we are likely to deal with single or small groups of stellar clusters (i.e., same or similar age populations) due to the small physical sizes of the regions sampled (100pc to 300pc). A metallicity value of Z=0.004 is adopted for the models, to match as closely as possible the oxygen abundances of roughly 1/10-1/5 measured in a few of the HII regions in these areas (Gil de Paz et al., 2007). The Kroupa Initial Mass Function ((m), with =1.3 for 0.1, and =2.3 for 0.5, )(Kroupa et al., 2001), the default IMF of Starburst99, is employed. Since we include in the fits the mid-Infrared (MIR) fluxes of each stellar complex, we use the new Padova stellar models with full asymptotic giant branch evolution. In order to balance the accuracy and the speed of the simulations for different age ranges, we select different time steps for the models: 0.05 Myr for 0.1-1 Myr, 0.1 Myr for 1-10 Myr, 0.5 Myr for 10-50 Myr, 1 Myr for 50-200 Myr, 2 Myr for 200-500 Myr, 10 Myr for 500-1000 Myr and 50 Myr for 1-2 Gyr. We convolve the spectral response curve of the GALEX and Spitzer filter bandpasses with the simulated stellar population spectra to obtain the synthetic photometry in the six bands. Finally, the luminosities and the colors from observations are compared with the theoretical model to constrain ages and masses.
4.2 Mass and Age distributions
For the SED fitting procedure, we adopt the –minimization technique to compare the observation and the theoretical SEDs of the sources:
| (1) |
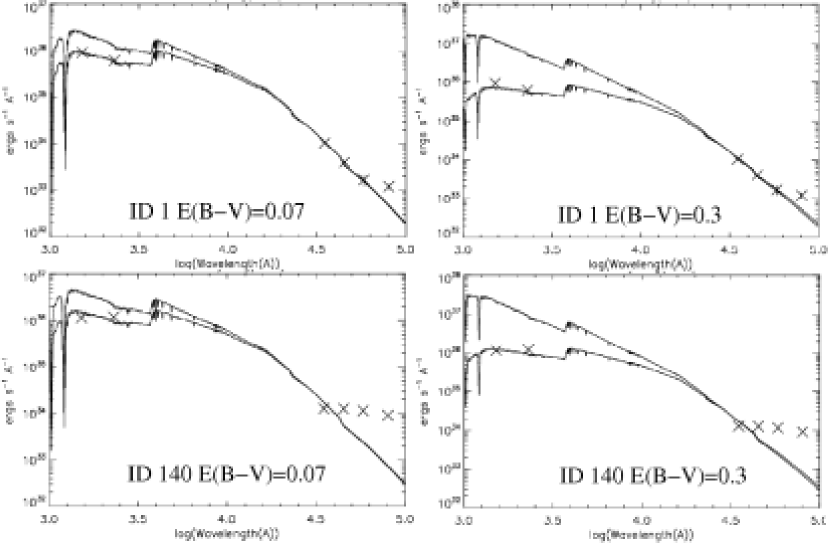
where N is the number of the filters available for each source (due to the potential dust contamination of 5.8 and 8.0 m bands, the other four bands, FUV, NUV, 3.6 and 4.5 m are used, then N=4). and are the luminosity from observation and model. ”A” is the ratio between the actual mass in each aperture and the default value 106 M⊙ provided by the Starburst99 models, . accounts for the photometric calibration and measurement uncertainties. Since we only have four data points available for each source, we fix both the metallicity and the mean dust extinction values. Fixing the latter, in particular, overcomes the age–extinction degeneracy that plagues stellar continuum band fits. We use as a guidance both the HI map and the results on HII regions in the M83 outer regions from Gil de Paz et al. (2007). The HI map gives mean column densities 3.5 and 5 for OuterI and OuterL, respectively, corresponding E(BV)=0.07 and =0.1 (Bohlin, Savage & Drake, 1978). As an extreme case, we also perform fits using E(BV)=0.3, which is at the high–end of the extinction values observed by Gil de Paz et al. (2007) in these outer regions. High extinction values are likely to be applicable to the youngest SF regions, of which the HII regions of Gil de Paz et al. (2007) are part, while the lower extinction values are likely to be applicable to older regions. and for the MW type dust have been used for calculating the extinction. and are assumed to be dust free. The age and mass of each source corresponding to the minimized are listed in table 3, for both the low and high extinction values. The best fit values are listed together with the uncertainty range corresponding to the 90% confidence level for the best fits; this is derived from requiring that, in the age and mass parameter space, = 4.61 (90% confidence level for 2 parameters). Uncertainties are relatively small for our best fit parameters, owing to the leverage provided by the long–wavelength baseline of the data.
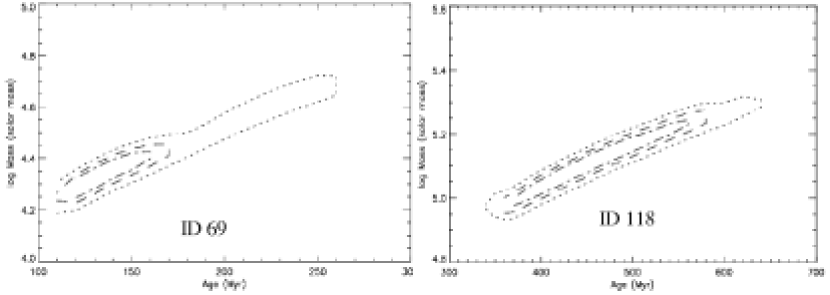
Fig. 4 shows two examples of the fitting results for each extinction value. The two upper panels report the case of a source with a good match between data and models in the four primary bands (where a ‘good match’ is defined as agreement between data and models within the 3 error bar of each data point), while the bottom two panels show the case of a source with unusual high excess 4.5, 5.8 and 8.0 m fluxes (one of the last 16 sources in Table 2). The 68%, 90%, and 99% confidence levels on each best fit (age,mass) values are shown in Fig. 5 for two representative regions in our sample. These are both intermediate–luminosity (at 3.6 m) sources (see Table 2), one in OuterI and the other in OuterL. The covariance between the two parameters is such that higher masses correspond to higher ages. This is readily understood by recalling that the mass is mainly determined by the value of the 3.6 m emission, while the age is constrained by the relative intensity of the UV and infrared data; increasing the mass by moving the normalization of the SED at higher 3.6 m values will then result in a ‘flatter’ (i.e., older age) best fitting SED to the UV data.
| Age (Myr) | log Mass () | |||
|---|---|---|---|---|
| ID | E(B-V)=0.07,0.1aaSED fitting results for the 152 sources in the two OuterI and OuterL fields. The values of the color excess used in the fits are E(B)=0.07 for OuterI and E(B)=0.1 for OuterL. These values are derived from the average HI column densities in each region, =3.5 for OuterI and =5 for OuterL, and the extinction–to–HI column density ratio of Bohlin, Savage & Drake (1978). | E(B-V)=0.3bbSED fitting results, applying a larger value of the extinction, E(B-V)=0.3, as derived by Gil de Paz et al. (2007) for a few of the HII regions detected in the M83 outskirts. | E(B-V)=0.07,0.1aaSED fitting results for the 152 sources in the two OuterI and OuterL fields. The values of the color excess used in the fits are E(B)=0.07 for OuterI and E(B)=0.1 for OuterL. These values are derived from the average HI column densities in each region, =3.5 for OuterI and =5 for OuterL, and the extinction–to–HI column density ratio of Bohlin, Savage & Drake (1978). | E(B-V)=0.3bbSED fitting results, applying a larger value of the extinction, E(B-V)=0.3, as derived by Gil de Paz et al. (2007) for a few of the HII regions detected in the M83 outskirts. |
| 1 | ||||
| 2 | ||||
| 3 | ||||
| 4 | ||||
| 5 | ||||
| 6 | ||||
| 7 | ||||
| 8 | ||||
| 9 | ||||
| 10 | ||||
| 11 | ||||
| 12 | ||||
| 13 | ||||
| 14 | ||||
| 15 | ||||
| 16 | ||||
| 17 | ||||
| 18 | ||||
| 19 | ||||
| 20 | ||||
| 21 | ||||
| 22 | ||||
| 23 | ||||
| 24 | ||||
| 25 | ||||
| 26 | ||||
| 27 | ||||
| 28 | ||||
| 29 | ||||
| 30 | ||||
| 31 | ||||
| 32 | ||||
| 33 | ||||
| 34 | ||||
| 35 | ||||
| 36 | ||||
| 37 | ||||
| 38 | ||||
| 39 | ||||
| 40 | ||||
| 41 | ||||
| 42 | ||||
| 43 | ||||
| 44 | ||||
| 45 | ||||
| 46 | ||||
| 47 | ||||
| 48 | ||||
| 49 | ||||
| 50 | ||||
| 51 | ||||
| 52 | ||||
| 53 | ||||
| 54 | ||||
| 55 | ||||
| 56 | ||||
| 57 | ||||
| 58 | ||||
| 59 | ||||
| 60 | ||||
| 61 | ||||
| 62 | ||||
| 63 | ||||
| 64 | ||||
| 65 | ||||
| 66 | ||||
| 67 | ||||
| 68 | ||||
| 69 | ||||
| 70 | ||||
| 71 | ||||
| 72 | ||||
| 73 | ||||
| 74 | ||||
| 75 | ||||
| 76 | ||||
| 77 | ||||
| 78 | ||||
| 79 | ||||
| 80 | ||||
| 81 | ||||
| 82 | ||||
| 83 | ||||
| 84 | ||||
| 85(XUV1)ccThe IDs with added ‘XUVn’ labels give the cross-identification of the sources in common with those of Gil de Paz et al. (2007). | ||||
| 86(XUV3)ccThe IDs with added ‘XUVn’ labels give the cross-identification of the sources in common with those of Gil de Paz et al. (2007). | ||||
| 87 | ||||
| 88 | ||||
| 89 | ||||
| 90(XUV2)ccThe IDs with added ‘XUVn’ labels give the cross-identification of the sources in common with those of Gil de Paz et al. (2007). | ||||
| 91 | ||||
| 92 | ||||
| 93 | ||||
| 94 | ||||
| 95 | ||||
| 96 | ||||
| 97(XUV4)ccThe IDs with added ‘XUVn’ labels give the cross-identification of the sources in common with those of Gil de Paz et al. (2007). | ||||
| 98 | ||||
| 99 | ||||
| 100 | ||||
| 101 | ||||
| 102 | ||||
| 103 | ||||
| 104 | ||||
| 105 | ||||
| 106 | ||||
| 107 | ||||
| 108 | ||||
| 109 | ||||
| 110 | ||||
| 111 | ||||
| 112 | ||||
| 113 | ||||
| 114 | ||||
| 115 | ||||
| 116 | ||||
| 117 | ||||
| 118 | ||||
| 119 | ||||
| 120 | ||||
| 121 | ||||
| 122 | ||||
| 123 | ||||
| 124 | ||||
| 125 | ||||
| 126 | ||||
| 127 | ||||
| 128 | ||||
| 129 | ||||
| 130 | ||||
| 131 | ||||
| 132 | ||||
| 133 | ||||
| 134 | ||||
| 135 | ||||
| 136 | ||||
| The sources with unusual high excess 4.5, 5.8 and 8.0 m flux | ||||
| 137 | ||||
| 138 | ||||
| 139 | ||||
| 140 | ||||
| 141 | ||||
| 142 | ||||
| 143 | ||||
| 144 | ||||
| 145 | ||||
| 146 | ||||
| 147 | ||||
| 148 | ||||
| 149 | ||||
| 150 | ||||
| 151 | ||||
| 152 | ||||
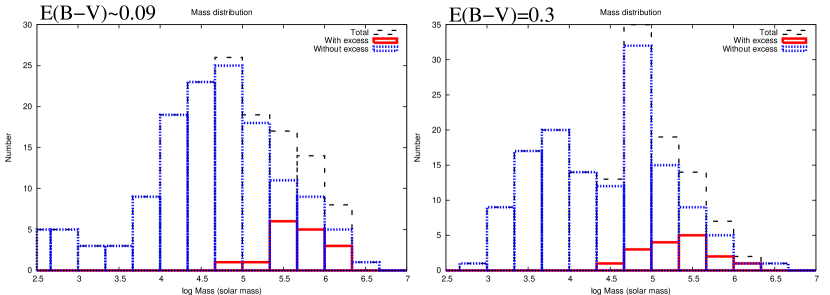
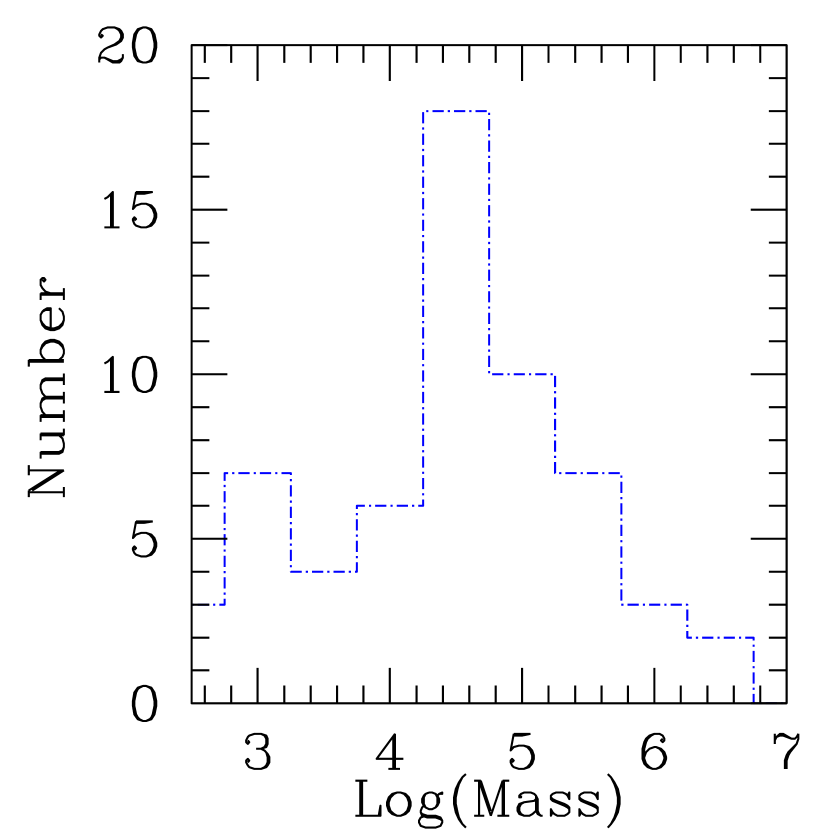
The distributions of the best fit masses and ages for the 152 sources (also separating the 136 without infrared excess from those with infrared excess, see above) are shown in Fig. 6 and Fig. 7, for both the low and high extinction values. As expected from the age–extinction degeneracy, the fits with the higher extinction value produce significantly lower age values, as these are mostly determined by the ratio of UV to IR flux. However, the mean mass, which is determined mainly by the 3.6 m flux value, is relatively well constrained (to better than a factor of 2). For the low extinction values, the mass distribution has a peak around , with a median value around . For high extinction (E(B-V)=0.3), the median value decreases to , i.e. by about 60%. Masses as large as are also found in our sample. In Fig.3 of Thilker et al. (2005), the masses of several UV bright regions are larger than , but their derived masses tend to be on average slightly smaller than the ones we derive here, possibly owing to the better constraint offered by the IRAC measurements.
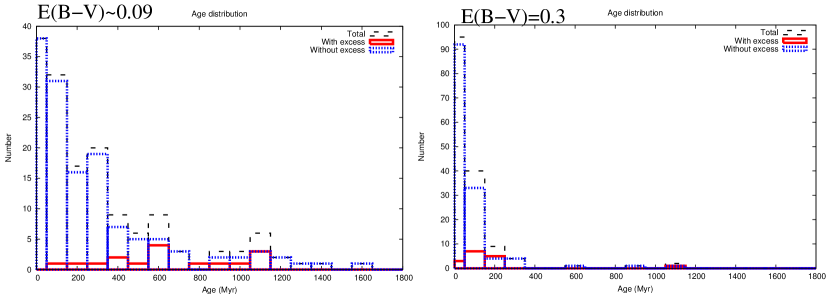
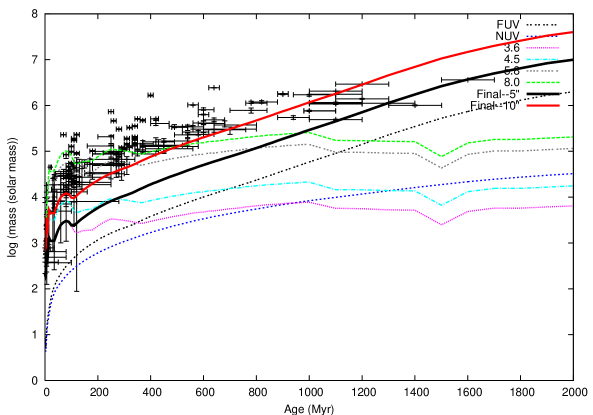
Star formation has been an ongoing process in the outskirts of M83 for at least the past 1 Gyr (Fig. 7). There is a noticeable increase in the number of sources towards younger ages, and the median age for the sample is indeed 180 Myr; however this increase could be due selection effects. Our UV–based source selection method gives preference to young stellar population, and we miss most of the old stellar population due to their faint UV emission. This effect can be seen clearly from Fig. 8. In this Figure, the distribution of age versus mass seems to follow a trend of increasing mean age for increasing mass. While the empty region in the bottom–right corner of the plot (regions of old age and low total mass) is due to instrumental detection limits, the lack of young and massive stellar populations points to possibly another type of selection effect, the so–called ‘size–of–sample’ effect (e.g., Hunter et al., 2003, and references therein). For constant star formation, the relation between the maximum cluster mass observed and the age of the clusters is related by: M(age)1/α-1), where is the exponent of the initial cluster mass function. By fitting a linear relation to the upper envelope of our data in a Log(Mass)–Log(age) plot, we derive 2, a value consistent with results for cluster mass functions (Hunter et al., 2003).
Within our sample of 136 sources, 13 (10.5%) have ages of less than 10 Myr. This is the age range when ionizing radiation is expected to be produced by massive stars. Our observed fraction of 10.5% ionizing sources is similar to the fraction of UV spots with H counterparts reported in Thilker et al. (2005). For the higher extinction value (Fig. 7, right panel), we obtain that 28.3% sources are younger than 10 Myr, which is mildly inconsistent with the dearth of H sources in the outer regions of M83. Thus, we infer that E(B-V)0.1 is a more realistic extinction value for the majority of the sources in our regions.
Not surprisingly, the 16 regions with excess 4.5, 5.8, and 8.0 m fluxes have systematically larger masses and on average older ages than the rest of the sample, reinforcing the possibility that the IR excess is due to contamination from unrecognized foreground or background sources that cannot be separated from the in–situ source of UV emission. Indeed, including the 2MASS J,H, and Ks photometry in the SED fitting for these 16 sources shows that the 4.5, 5.8, and 8.0 m IRAC fluxes are systematically larger (in some cases by more than an order of magnitude) than the best fit through the GALEX, 2MASS and IRAC 3.6 m data. Despite the large uncertainties in the 2MASS datapoints, this result confirms that the last 16 regions of Table 2 are contaminated by (likely) background galaxies at large distances.
The inclusion of the 2MASS datapoints in the SED fitting of the 136 ‘bonafide’ sources supports the results obtained for the GALEXIRAC–only fits: single–age populations are still an acceptable fit to the data. The fits that include the 2MASS data produce median ages only marginally younger than without the 2MASS data (160 Myr versus 180 Myr), and median masses that are a factor 1.6 smaller ( versus ). The 2MASS data, thus, provide a sanity check that support our baseline results.
To further test whether even our bonafide 136 final sources may be contaminated by unrecognized sources unrelated to M83, we have isolated those sources that are located in regions of HI column densities above the median of the regions (N(HI)2.21020 cm-2). The hypothesis behind this selection is that sources located in correspondence of relatively high HI column densities are more likely to be physically associated with M83. There are 60 such sources (44% of the total), and their mass and age distributions are shown in Figure 9. Both distributions are consistent with those of the whole sample of 136 sources, with a median value for the age which is about half that of the whole sample (90 Myr versus 180 Myr), and a factor 2.5 lower median mass (104.5 M⊙ versus 104.9 M⊙).

4.3 Comparison with H observations
Gil de Paz et al. (2007) obtained optical spectra in the Southern parts of the M83 outskirts, and four emission line sources fall within our OuterL field: XUV01-04 (Table 2 of Gil de Paz et al., 2007). The cross-indentifications with our sources are given in Table 3. We note significant spatial off-sets between XUV3 and XUV4 and their counterparts in our sample (86 and 97, see Table 3). However, since regions 86 and 97 are the brightest and closest UV spots around these two H–emitting regions, we believe that they come from the same objects.
From Table 3 and Table 4, all regions in common with the sample of Gil de Paz et al. (2007) have ages around 100 Myr, which would indicate that they should not be line emitting sources, in apparent contradiction with the results of Gil de Paz et al. (2007). However, if we take as examples XUV2 and XUV3, the extinction values measured by those authors for these two regions are 0.23 and 0.29, respectively. If we adopt the larger extinction value E(BV)=0.3 in the SED fitting, we obtain that XUV2 becomes 6 Myr old and XUV3 20 Myr old. All four sources in common with Gil de Paz et al. (2007) have indeed ages equal to or younger than 20 Myr for the higher extinction value (Table 3), which are not incompatible with those sources being line–emitting ones. For XUV3, HST images (Thilker et al, 2007, in preparation) show the presence of an older (red) stellar population within the source. In our IRAC observations, XUV4 is polluted by a nearby foreground star, which may be partially responsible for an artificial increase of the derived age. XUV1 has the largest H flux among the four sources in common with the sample of Gil de Paz et al. (2007) and has a very small extinction as derived from the optical spectra. Gil de Paz et al. (2007) suggests that the H flux of XUV1 could be produced by a single young massive star 3 Myr old and with a mass of 40 . Both the age (80 Myr for the small extinction value, see Table 4) and the total mass (which depends mainly from the IRAC 3.6 m flux and implies that the total mass of stars above 40 is 4300 ) that we derive for XUV1 are again in apparent contradiction with these results. We suggest that, for XUV1 multiple stellar populations, spanning a range of ages, are present within the region enclosed by our apertures, with the older ones carrying most of the mass and responsible for the IRAC flux and the younger ones responsible for the strong H flux. This hypothesis is also in line with the HST observational results for XUV3.
| XUV region Namea | IDb | (ergs )c | distance (arcsecond) | Aged (Myr) | log (Massd (solar mass)) |
|---|---|---|---|---|---|
| XUV1 | 85 | 1.11 | 1.35 | 80. | 4.9 |
| XUV2 | 90 | 2.39 | 4.4 | 90. | 4.7 |
| XUV3 | 86 | 2.07 | 12.4 | 120. | 5.4 |
| XUV4 | 97 | 1.60 | 8.1 | 110. | 5.2 |
Note. — (a) The XUV region naming convention from Table 2 of Gil de Paz et al. (2007), (b) The ID in table. 2, (c) The H flux after the extinction correction from Gil de Paz et al. (2007) and (d) The age and mass calculated from our SED fitting method, for the low extinction value E(BV)=0.1, see Table 3.
4.4 Dust Emission
Observational evidence for extended dust emission around galaxy disks has increased in recent times. Extended (beyond the optical disk) dust emission has been observed in a variety of galaxies using both ISO and Spitzer, from large edge–on spirals like NGC891 (Popescu & Tuffs, 2003) to dwarfs like UGC10445 (Hinz et al., 2006). Non-negligible extinction has been measured up to 2 effective radii in spiral galaxies using the overlapping pair method (e.g., Holwerda, Keel & Bolton, 2007). GALEX observations of the edge-on starburst galaxies M82 and NGC 253 also show unusual high UV luminosity in the halo, which cannot be explained by shock–heated or photoionized gas and could have dust–scattering origin (Hoopes et al., 2005), in agreement with evidence for dust emission in these same areas (Engelbracht et al., 2006). Presence of dust in the outer regions of galaxies can provide crucial insights into the metal pollution of the intergalactic medium.
By calculating the excess infrared flux over the SED best fitting models for our 136 sources, we get that about 146%, 2430% and 6726% of the total flux at 4.5, 5.8 and 8.0 , respectively, results from the contribution of a non-stellar (dust emission) component.
The 8 m dust–only emission can be used to derive an approximate value of the SFR in the two regions, keeping in mind a number of caveats about using the PAH emission for tracing star formation (Calzetti et al., 2007): it is very sensitive to both metallicity (Engelbracht et al., 2005) and the star formation history of the region under consideration. In particular, only when the oxygen abundance is around solar value, there is a relatively tight relation between the 8 m emission and the SFR. Since the abundance in the outer disk of M83 is about 1/5–1/10 the solar value, we derive a relation between the 8 m flux and the SFR using the low oxygen abundance data points in Fig. 3 of Calzetti et al. (2007):
| (2) |
From the 22 sources in both OuterI and OuterL that show an excess at 8 m (and little or no excess in the other bands) we then derive a mean SFR density for the two regions by summing up the dust emission at 8 m and dividing it by the total area. By applying equation 2, we obtain an average SFR density of 0.8.
The excess (over stellar photospheric) emission at 4.5 m has been already observed in other galaxies, both with ISO and with Spitzer (Lu et al., 2003; Helou et al., 2004; Regan et al., 2004). This is the first time such excess is inferred (albeit with large uncertainty) in the outer regions of a galaxy. The origin of this excess, likely due to dust emission, is still unclear. Lu et al. (2003) suggest that the excess could be due to very small grains transiently heated by single photons to high temperatures, 1000 K. . Our result of 14%6% by flux as due to non–stellar emission is intermediate between the value found by Regan et al. (2004) for NGC7331 (6%) and the value found by Helou et al. (2004) for NGC300 (17%) and by Lu et al. (2003) for a sample of galaxies observed with ISO.
4.5 The Laws of Star Formation
As already documented by Boissier et al. (2007), the stellar and gas radial profiles of the galaxies with extended UV emission do obey the scaling laws of star formation (Kennicutt, 1998; Kennicutt et al., 2007). We investigate the proportionality between the localized star formation rate density and gas density in the outer regions of M83, by combining the GALEX FUV data and the 8 m dust–only emission data with the HI map. This analysis thus provides a verification of the local scaling laws of star formation in the outskirts of this galaxy, in contrast with previous results that have analyzed azimuthal averages of both the SFR and gas densities. We will assume that the total SFR in the region is given by the sum of the SFRs derived from the observed FUV (uncorrected for extinction) and from the 8 m–dust emission. The 8 m–emitting dust is heated by non–ionizing UV and optical photons (Li & Draine, 2002), and can thus be adopted as a tracer of the UV photons that have been absorbed by dust and re-emitted in the IR; therefore, the extinction–corrected UV emission will be the sum of the observed FUV and the 8 m–dust emission. We will use this assumption to derive SFRs in the outskirts of M83. We note that the absence of data on the molecular gas content is a limitation of our analysis, which should then be interpreted with care.
At the large distances of OuterI and OuterL from the center of the galaxy, the response of the VLA primary beam pattern is substantially reduced (compared to the galaxy center), the beam size is degraded, and the intrinsic column densities are comparatively low. To control and minimize uncertainties arising from the combination of these characteristics, we perform photometry of regions in apertures of 20′′ diameter, corresponding to a physical scale of about 440 pc, slightly larger than the sizes employed so far in our analysis. We use newly defined regions that are measured in both the GALEX FUV and in the dust–only 8 m images. The larger apertures enable us to include in each measurement multiple stellar clusters, thus justifying the derivation of a SFR density (which would be inappropriate for a single stellar cluster). We will also assume that star formation has proceeded at a quasi-constant level over the past 100 Myr, an assumption justified by the results of the previous sections. This part of the analysis does not aim at completeness in any sense on the selection or measurement of UV– and/or 8 m–emitting regions; it only aims at providing a range of values for the SFRs and HI column densities, to investigate whether star formation at such large distances may suggest deviations from the Schmidt–Kennicutt Law or suggest violations of the star formation threshold (Martin & Kennicutt, 2001). We identify a total of 54 regions (25 in OuterI and 29 in OuterL), and obtain UV and 8 m–dust photometry for each.
To infer the critical density for this face–on galaxy, we use the rotation velocity of 160 km s-1 measured at the distance of 20 kpc (Sofue et al., 1999), assume that the velocity dispersion of the stars is negligible relative to the rotation velocity at this distance from the center, and apply equation 6 of Kennicutt (1989). Figure 10 shows the histogram of the ratio of the HI density to the gas critical density at the average distance of the regions in OuterI and OuterL. As both fields are located at 1519.5 kpc distance from the center of the galaxy, we adopt a single value of the critical density. The scatter is large, as expected for measurements performed at low signal-to-noise ratio, but the peak value is around /=1. This suggests that star formation in these regions happens at roughly the local critical density value. The tail towards negative values in Figure 10 may suggest that the HI gas is clumped over scales that are smaller than our measurement aperture (440 pc); this is not unreasonable, since the typical HII complex has a much smaller characteristics scale than 400 pc. However, we should stress again that the addition of data on the molecular gas density would boost these ratios in the positive sense.

The outer regions also display star formation roughly in agreement with the Schmidt-Kennicutt Law. This is shown in Figure 11, where the star formation rate density, SFRD(UV+8 m), versus HI gas density plot is compared both with the mean trend observed for 500 pc regions in M51 (Kennicutt et al., 2007), and with the average trend for whole galaxies reported in (Kennicutt, 1998). The UV data are converted to SFRs using the formula of (Kennicutt, 1998) modified for the Kroupa IMF. The conversion between the 8 m–dust data and SFR uses equation 2. The dynamical range spanned by the M83’s outskirts data is small, and generally in the low gas density part of the diagram, but there is a general agreement with the trend observed for the M51 regions. Yet there is a significant number of M83 regions that are located above the mean trend marked by the M51 data, implying that these data show higher SFRs for the amount of measured gas density. We should recall that the uncertainties in one of the two components of the SFR, i.e., the faint dust–emission–only data, are large (Figure 9) and the conversion from 8 m dust emission to SFR is highly uncertain, due to the significant dependence of the 8 m emission on metallicity (Engelbracht et al., 2005; Calzetti et al., 2007). In addition, the M83 data lack measurements of molecular gas content, which, if added, would move the data towards higher gas densities. Finally, the observed trend is not dissimilar from what observed in low–metallicity galaxies (Kennicutt, 1998).

5 Discussion and Summary
The new Spitzer IRAC observations presented here, in conjunction with GALEX data and a new HI map from THINGS, have expanded our understanding the star formation processes in the outskirts of M83.
The IRAC photometry has targeted the virtually–extinction–free, mid–infrared emission from the stars (3.6 and 4.5 m), and the dust emission (5.8 and 8.0 m) from stellar clusters in the extreme outer regions of M83, providing constrains on their masses, their ages (together with the UV data), and their star formation properties (together with the HI data).
The Spitzer IRAC observations have targeted two fields, about 9.8 kpc in size at a distance of 19.5 kpc from the center of M83. The two fields are located at about 3 times the H edge in the galaxy, in correspondence of UV–emitting regions that present a dearth of H emission. The cross-identification of UV and IRAC sources has yielded a final sample of 136 ‘bona-fide’ stellar clusters (or multiple stellar clusters) belonging to M83, after purging all potential foreground stellar and background galaxy contaminations with a variety of methods.
Comparison between the multi–wavelength photometry and synthetic SEDs from Starburst99 yields ages for the sources between Myr to more than 1 Gyr, which explains the dearth of H emission in the outer regions of M83 (Thilker et al., 2005). Our sources show a median age around 180 Myr, which however could be a selection effect induced by our UV–based source selection technique. Overall, star formation has been an on–going process in the outer regions of M83 over the past 1 Gyr. The SED fits also give masses in the range to for the sources, with a median value of , comparable to the masses of globular clusters. These results are quantitatively confirmed when the (albeit far more uncertain than our IRAC data) 2MASS J, H, and Ks data are added as constraints to the SED fitting. It should be remarked that our sources (each encompassing a physical region of 220 pc or more in size) could include more than one stellar cluster; this is likely true for one of the sources in common with the sample of HII regions of Gil de Paz et al. (2007), for which those authors obtain, from optical spectroscopy, masses and ages far lower than what we obtain with multi–wavelength SED fitting.
The agreement between expectations and observations for the ionizing gas emission from these regions (i.e., little emission expected overall, due to the broad range of ages shown by the stellar clusters) appears to argue against significant leakage of ionizing photons. This assumes that there is little dust extinction in those regions. For significant values of the extinction, the expected ages of the clusters would decrease, thus introducing a discrepancy between the observed and predicted amounts of H flux, and the possibility of UV photons leakage. However, measurements of the Balmer decrement available for a few of the HII regions (Gil de Paz et al., 2007) support our choice of low values for the dust extinction in these regions. Presence of ionizing photons leakage would have negligible impact on our conclusions on the star formation law in the outer regions, because our measurements of the SFR density rely on the non–ionizing UV stellar continuum, both as a direct measure and as an indirect measure via the 8 m dust emission.
Some of the sources show dust emission at 4.5 m, 5.8 m, and 8 m. We use the 8 m dust emission to derive an average SFR density for the two fields of 0.8 ., although this number should be used with caution, given the many issues related to the use of the 8 m PAH emission for tracing star formation (Calzetti et al., 2007). The dust emission at 4.5 m we observe accounts for 14%6% of the total flux; this number is in between the values reported for other galaxies (Lu et al., 2003; Regan et al., 2004; Helou et al., 2004), although this is the first time this excess is observed in regions so far removed from the center of a galaxy. Lu et al. (2003) suggest that the 4.5 m excess could be emission from very small dust grains transiently heated to 1000 K. The UV photons from the our clusters could provide the heating source for the dust, although this will need confirmation.
Star formation, thus, appears to be an unexceptional event in the outskirts of M83. From the THINGS HI map the location of our sources is in correspondence of local HI enhancements (see also Thilker et al., 2005), and those regions are consistent with the local gas density to be around the critical density value, in agreement with the threshold hypothesis of Martin & Kennicutt (2001), at least when applied locally. Furthermore, the star formation rate densities and gas densities follows a scaling relation similar to that found for the star forming regions in the disk of M51 (Kennicutt et al., 2007). This reinforces the conclusion that the outer regions of M83, albeit sparsely populated with stars and sites of low gas densities on average, still form stars and stellar clusters following relations already established for the higher density regions of disks.
References
- Bertin, E., & Arnouts, S. (1996) Bertin, E., et al., 1996, A&AS, 117, 393
- Bianchi et al. (2003) Bianchi, L., et al., 2003, BAAS, 203, 91.12
- Bohlin, Savage & Drake (1978) Bohlin, R.C., Savage, B.D., & Drake, J.F. 1978, ApJ, 224, 132
- Boissier et al. (2007) Boissier, S., et al, astro-ph/0609071
- Calzetti et al. (2005) Calzetti, D., et al, 2005, ApJ, 633, 871
- Calzetti et al. (2007) Calzetti, D., et al, 2007, 2007, arXiv0705.3377C
- Cardelli, Clayton & Mathis (1989) Cardelli, J.A., Clayton, G.C., & Mathis, J.S. 1989, ApJ, 345, 245
- Crosthwaite et al. (2002) Crosthwaite, L. P., Turner, J. L., Buchholz, L., Ho, P. T. P., & Martin, R. N. 2002, AJ, 123, 1892
- Cuillandre et al. (2001) Cuillandre, J., Lequeux, J., Allen, R. J., Mellier, Y., Bertin, E., 2001, ApJ, 554, 190
- de Blok et al. (2003) de Blok, W. J. G., Walter, F., 2003, MNRAS, 341, L39
- Engelbracht et al. (2005) Engelbracht, C. W. et al., 2005, ApJ, 628, L29
- Engelbracht et al. (2006) Engelbracht, C. W. et al., 2006, ApJ, 642, 127
- Fazio et al. (2004) Fazio, G. G., 2004, ApJS, 154, 10
- Ferguson et al. (1998) Ferguson, A. M. N., Gallagher, J. S., Wyse, R. F. G., 1998, AJ, 116, 673
- Gil de Paz et al. (2005) Gil de Paz, et al., 2005, ApJ, 627, L29
- Gil de Paz et al. (2007) Gil de Paz, et al., 2007, ApJ, 661, 115s
- Helou et al. (2004) Helou, G., Roussel, H., Appleton, P., Frayer, D., Stolovy, S., Storrie-Lombardi, L., Hurt, R., Lowrance, P., Makovoz, D., Masci, F., et al., 2004, ApJS, 154, 253
- Hinz et al. (2006) Hinz, J.L., Misselt, K., Rieke, M.J., Rieke, G.H., Smith, P.S., Blaylock, M., & Gordon, K.D. 2006, ApJ, 651, 874
- Holwerda, Keel & Bolton (2007) Holwerda, B.W., Keel, W.C., & Bolton, A. 2007, AJ, 134, 2385
- Hoopes et al. (2005) Hoopes, C. G., et al., 2005, ApJ, 619, L99
- Hunter et al. (2003) Hunter, D.A., Elmegreen, B.G., Dupuy, T.J., & Mortonson, M. 2003, AJ, 126, 1836
- Karachentsev (2005) Karachentsev, I. D. 2005, AJ, 129, 178
- Karachentseva et al. (1998) Karachentseva, V. E., Karachentsev, I. D. 1998, A&AS, 127, 409
- Kennicutt (1989) Kennicutt, Robert C., Jr., 1989, ApJ, 344, 685
- Kennicutt (1998) Kennicutt, Robert C., Jr., 1998, ApJ, 498, 541
- Kennicutt et al. (2003) Kennicutt, Robert C., Jr., et al., 2003, PASP, 115, 928
- Kennicutt et al. (2007) Kennicutt, Robert C., Calzetti, D., et al., 2007, ApJ, in press.
- Kroupa et al. (2001) Kroupa P., 2001, MNRAS, 322, 231
- Leitherer et al. (1999) Leitherer, C., Schaerer, D., Goldader, J. D., et al., 1999, ApJS, 123, 3
- Lelievre & Roy (2000) Lelievre, M., Roy, J., 2000, AJ, 120, 1306L
- Li & Draine (2002) Li, A., & Draine, B.T. 2002, ApJ, 572, 232
- Lu et al. (2003) Lu, N., Helou, G., Werner, M. W., Dinerstein, H. L., Dale, D. A., Silbermann, N. A., Malhotra, S., Beichman, C. A., Jarrett, T. H. 2003, ApJ, 588, 199L
- Martin & Kennicutt (2001) Martin, C. L., & Kennicutt, R. C., 2001, APJ, 555, 301
- Martin et al. (2005) Martin, D. C., et al., 2005, ApJ, 619, L1
- Morrissey et al. (2007) Morrissey, P., et al. 2007, ApJS, 173, 682
- Mun̈oz-Mateos et al. (2007) Mun̈oz-Mateos, J. C., Gil de Paz, A., Boissier, S., Zamorano, J., Jarrett, T., Gallego, J., Madore, B. F. 2007, ApJ, 658, 1006M
- Pahre et al. (2004) Pahre, M.A., Ashby, M. L. N., Fazio, G. G., Willner, S. P., 2004, ApJS, 154, 229
- Popescu & Tuffs (2003) Popescu, C. C., Tuffs, R. J., 2003, A&A, 410, L21
- Regan et al. (2004) Regan, M. W. et al., 2004, ApJS, 154, 204
- Rogstad et al. (1974) Rogstad, D. H., Lockart, I. A., Wright, M. C. H. 1974, ApJ, 193, 309R
- Skrutskie et al. (2006) Skrutskie, M.F., Cutri, R.M., Stiening, R., Weinberg, M.D., Schneider, S., Carpenter, J.M., Beichman, C., et al. 2006, AJ, 131, 1163
- Sofue et al. (1999) Sofue, Y., Tutui, Y., Honma, M., Tomita, A., Takamiya, T. , Koda, J., & Takeda, Y. 1999, ApJ, 523, 136
- Thilker et al. (2005) Thilker, D. A., et al., 2005, ApJ, 619, L79
- Thim et al. (2003) Thim, F., Tammann, G. A., Saha, A., Dolphin, A., Sandage, A., Tolstoy, E., Labhardt, L., 2003, ApJ, 590, 256T
- Tilanus & Allen (1993) Tilanus, R. P. J., & Allen, R. J., 1993, A&A, 274, 707
- van den Bergh. (1980) van den Bergh. S. 1980, PASP, 92, 122V
- Vzquez et al. (2005) Vzquez, G. A., & Leitherer, C., 2005, ApJ, 621, 695
- Walter et al. (2005) Walter, F., Brinks, E., de Blok, W. J. G., Thornley, M. D., & Kennicutt, R. C. 2005, in ASP Conf. Ser. 331, Extra-Planar Gas, ed. R. Braun (San Francisco: ASP), 269
- Walter et al. (2008) Walter, F., Brinks, E., de Blok, W. J. G., Bigiel, F., Kennicutt, R. C. Thornley, M. D. 2008, AJ, submitted
- Wyder et al. (2005) Wyder, T. K., et al., 2005,
- Zaritsky & Christlein, (2007) Zaritsky D. & Christlein D., 2007, AJ, 134, 135