Pressure-induced commensurate magnetic order in multiferroic HoMn2O5
Abstract
The pressure () – temperature () phase diagram for microscopic magnetism in the multiferroic compound HoMn2O5 was established using neutron diffraction measurements under a hydrostatic pressure up to 1.25 GPa. At ambient pressure, incommensurate–commensurate–incommensurate magnetic phase transitions occur successively with decreasing temperature. Upon applying pressure, the incommensurate phase at the lowest temperature almost decreases and the commensurate phase appears. The – phase diagram established shows excellent agreement with the recently reported – dielectric phase diagram, where ferroelectricity is induced by applying pressure. We also found that the – magnetic phase diagram is quite similar to the previously obtained magnetic field-temperature phase diagram.
pacs:
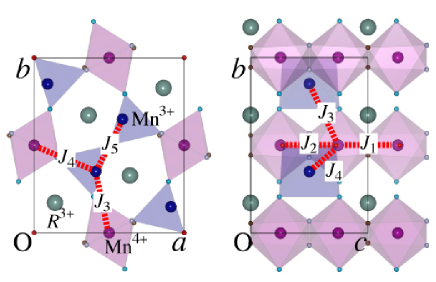
61.12.Ld, 64.70.Rh, 75.47.Lx, 75.80.+qThe coexistence of and spontaneous ordering of (anti) ferromagnetism and ferroelectricity, referred to as multiferroics, has recently been identified in certain materials. Both the scientific and technological aspects of these materials have attracted much attention owing to the possible colossal magnetoelectric (ME) effect, in which the electric polarization can be controlled by a magnetic field, or conversely, the magnetization can be controlled by an electric field. The series of rare-earth manganese compounds Mn2O5 ( rare earth, Bi, and Y) is a prototype multiferroic system that exhibits the colossal ME effectHur2004-1 ; Hur2004-2 . As shown in Fig. 1, this system has two independent Mn sites of Mn3+ and Mn4+ ions, a network of which surrounds the ion. Furthermore, there are at least five different paths ( in Fig. 1) of Mn-Mn exchange interactionsBlake2005 . These geometrical configurations potentially involve magnetic frustration, resulting in a complex phase sequence of multiple
magnetic transitions as a function of temperatureKimura2007-1 . Magnetic frustration has recently received interest in connection with multiferroics because many multiferroic materials, such as MnO3Kimura2003 , Ni3V2O8Lawes2005 , and MnWO4Taniguchi2006 , essentially involve geometrical magnetic frustration. The competition between multiple magnetic ground states within a small energy scale due to the frustration allows various magnetic phase transitions to occur upon the application of an external field. A rich variety of magnetic as well as dielectric responses to the applied magnetic field has been found in Mn2O5 with TbHur2004-1 ; Hur2004-2 , DyHur2004-2 ; Higashiyama2004 ; Ratcliff2005 , HoHur2004-2 ; Higashiyama2005 ; Kimura2006 , and ErHigashiyama2005 ; Kimura2007-2 . Although the origin of these magnetic field responses have been discussed on the basis of the interaction between the applied magnetic field and the induced rare-earth magnetic momentKimura2007-3 , the details are not yet understood.
It was recently found that a hydrostatic pressure of around 1 GPa can have a dramatic effect on the dielectric properties of Ni3V2O8 and Mn2O5: ferroelectricity is suppressed in the former, Chaudhury2007 while in the latter system, ferroelectricity is restoredCruz2007 by applying pressure. In contrast to the case of an external magnetic field, where the magnetic field can directly couple to spins, pressure can tune the magnetic interaction between neighboring spins by decreasing the interatomic distance, and by changing the bond angles. A small change in the arrangement around magnetic ions causes magnetic phase transitions because of the magnetic frustration, which yields dielectric phase transitions in multiferroic systems. However, no microscopic evidence of pressure-induced magnetic phase transitions has yet been found in any multiferroic system. Thus, in the present study, we performed neutron diffraction measurements under hydrostatic pressure in the multiferroic HoMn2O5 system in search for microscopic magnetic responses to pressure and to determine the relationship between the magnetic response and the dielectric response.
We successfully established the pressure () – temperature () phase diagram for microscopic magnetism and found a strong correlation to the – dielectric phase diagram reported previouslyCruz2007 .
A single crystal of HoMn2O5 was grown by the PbO–PbF2 flux methodWanklyn1972 . The crystal, which was almost a cube, mm on a side, was inserted in a pressure cell. A hydrostatic pressure of up to 1.25 GPa was applied using a copper-beryllium (CuBe) based piston-cylinder clamp deviceAso2006 with a (1:1) mixture of Fluorinert FC75/77 as a pressure transmitting medium. The applied pressure was measured by evaluating the pressure change in the superconducting transition temperature of high-purity lead, which was placed in the pressure cell with the HoMn2O5 crystal. Neutron diffraction measurements were performed using the thermal neutron triple-axis spectrometer AKANE owned by the Institute of Material Research of Tohoku University, installed at JRR-3 in the Japan Atomic Energy Agency. The sample was mounted on the () scattering plane. The incident energy of neutrons was fixed at 19.5 meV using a Germanium (311) monochromator.
HoMn2O5 is orthorhombic with symmetry for the paraelectric phase. As shown in Fig.1, edge-sharing Mn4+O6 octahedra align along the -axis and pairs of Mn3+O5 pyramids link the Mn4+O6 chains in the -plane, a network of which surrounds the Ho3+ ionAbrahams1967 . At ambient pressure, HoMn2O5 show successive magnetic phase transitions: below a Nel temperature K, a high-temperature incommensurate magnetic (HT-ICM) phase appears in the absence of electric polarization. At K, the HT-ICM phase disappears and the commensurate magnetic (CM) phase arises, where an electric polarization is concurrently induced along the -axis. As the temperature decreases, a further transition occurs from the CM phase to a low-temperature incommensurate magnetic (LT-ICM) phase at K, at which temperature a dielectric phase transition occurs as well, the electric polarization drops, and the system is converted into an unidentified dielectric phase (X phase). All the magnetic phases are characterized by a magnetic propagation wave vector , where the periodicity of the magnetic order along both the - and -axes is modulated. Details of the magnetic and dielectric properties under ambient pressure have been reported elsewhereKimura2006 .
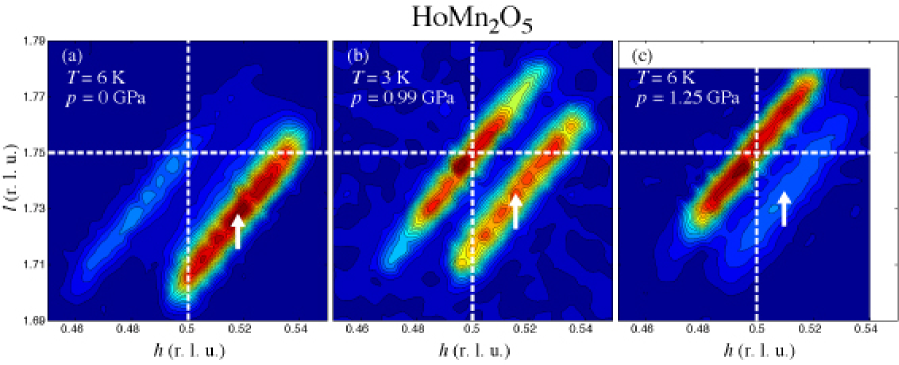
Under hydrostatic pressure, observed by neutron diffraction significantly changes. Figure 2 displays contour maps of the magnetic Bragg reflections around (0.5 0 1.75) sliced in the reciprocal zone as a function of applied pressure, taken below 6 K. All the peak profiles are elongated in the diagonal direction owing to the instrument resolution. Under ambient pressure (see Fig. 1(a)), the pair of incommensurate peaks observed around (0.50.02 0 1.73) are well-defined, which indicates the LT-ICM phase. The imbalance in the intensity of the two peaks results from the domain distribution or magnetic structure factor. As the applied pressure is increased to GPa, the incommensurate peak becomes weak and a commensurate peak appears at (denoted by white dashed lines in the figure), where the LT-ICM and CM phases coexist. At GPa (see Fig. 1(c)), the commensurate peak is dominant, with a minor incommensurate peak, suggesting that the volume fraction of the CM phase increases with increasing pressure.
Figures 3 (a) and (b) show the integrated intensities of the magnetic peak for the HT-ICM, CM, and LT-ICM phases as a function of temperature, taken at three different hydrostatic pressures. Above K, there is a weak pressure dependence
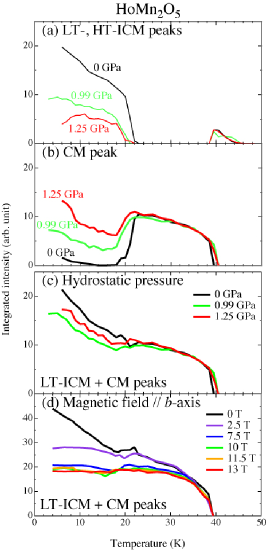
of the intensity variation for both the CM and HT-ICM phases. Below K, the behavior of the order parameter for the CM and LT-ICM phases changes significantly upon applying pressure. With increasing pressure, the signal from the LT-ICM phase decreases, and the temperature at which the LT-ICM phase appears slightly decreases. In contrast, the intensity coming from the CM phase restores with increasing pressure below 20 K. This indicates that the volume fraction of the LT-ICM phase reduces and that of the CM phase builds up as the applied pressure increases. The total amplitude of the magnetic scattering intensity below K, which corresponds to the sum of the magnetic intensities for the LT-ICM and CM phases, is plotted as a function of temperature in Fig. 3(c). The temperature evolution of the magnetic intensity at each pressure is almost consistent, where the intensity rises rapidly below around 22 K. This rapid increase might have to do with the increase of the magnetic polarization of the 4-magnetic moment on the Ho3+ ion. Fig. 3(d) shows a similar plot as a function of temperature obtained under an applied magnetic field, where the CM phase is also induced by applying a magnetic fieldKimura2006 . With increasing magnetic field, the sum of the intensity below K rapidly decreases and the temperature evolution almost saturates above T, while the intensity above K is almost temperature-independent. This means that the sum rule in the total magnetic intensity is broken by applying a magnetic field, which sharply contrasts the behavior under hydrostatic pressure. These results indicate that the magnetic structure of the CM phase induced by a magnetic field is different from that induced by hydrostatic pressure, where the difference in the structure of Ho3+ moments might become dominant.
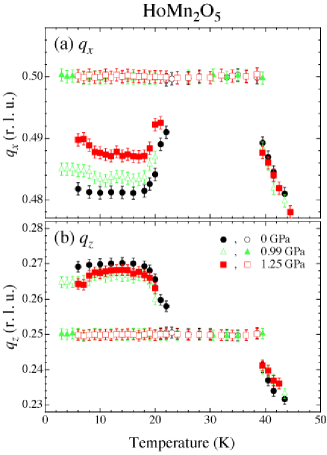
Temperature dependence of the magnetic propagation wave vector at three different pressure values was measured. Figures 4(a) and (b) show the temperature dependences of and , respectively. Above K, the wave vector in both the CM and HT-ICM phase is almost independent of the applied pressure, which is consistent with the behavior of the order parameters shown in Figs. 3(a) and (b). On the other hand, the wave vector of the LT-ICM phase below K strongly depends on the applied pressure. The pressure effect becomes enhanced in the behavior of , which approaches the commensurate value of 1/2 with increasing pressure. This indicates that the instability of the LT-ICM phase increases with increasing pressure. These results are qualitatively consistent with the results obtained under an applied magnetic fieldKimura2006 . Although the two-phase coexistence of the CM and LT-ICM phases persists up to GPa, the critical pressure above which the magnetic phase becomes single-phase CM can be estimated by extrapolation from the pressure dependence of .
The pressure () – temperature () phase diagram for all the magnetic phases is shown in Fig. 5(a). The magnetic field () – temperature () magnetic phase diagram obtained in our previous studyKimura2006 is shown in Fig. 5(b) for comparison.
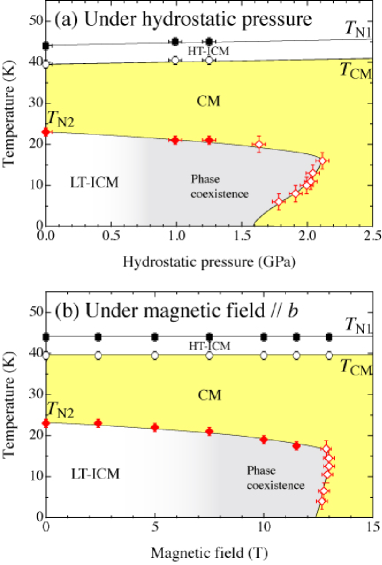
The – phase diagram clearly indicates that the HT-ICM and CM phases at ambient pressure become resistant against pressure, and and slightly increase with increasing pressure. By contrast, the LT-ICM phase at ambient pressure becomes unstable with increasing pressure and finally the system becomes single-phase CM above GPa through phase coexistence. Recent study of dielectric measurements under hydrostatic pressure in HoMn2O5 revealed that the weak electric polarization in the X phase grows upon applying pressureCruz2007 . A comparison of our – magnetic phase diagram with the – dielectric phase diagramCruz2007 reveals that there is a one-to-one correspondence between the pressure-induced commensurate spin state and the pressure-induced electric polarization, which is also seen in the – phase diagramHigashiyama2005 ; Kimura2006 . This suggests that commensurate magnetism leads to bulk electric polarization.
It is interesting to note that, as seen in Figs. 5, the – magnetic phase diagram is quite similar to the – magnetic phase diagram. The magnetic field can directly affect the spins, especially the polarization of Ho moments. In contrast, pressure can change the interatomic distance or bond angles. Both the cases change the magnetic interaction and the valance of the competing multiple ground states, which can cause magnetic phase transition. The present study has demonstrated that the magnetic structure is controlled by not only the magnetic field but also the hydrostatic pressure. However, the reason why the phase diagrams obtained under a magnetic field and under pressure are quite similar remains unclear. The temperature evolution of total magnetic intensity as a function of applied pressure is different from that as a function of applied magnetic field, as shown in Figs. 3(c) and (d). This suggests that the magnetic structure induced by pressure is different from that induced by magnetic field, even though both magnetic structures induced have the same commensurate periodicity. The volume of the unit cell in the LT-ICM phase is larger than that in the CM phase at ambient pressureBlake2005 , showing that the compressed lattice favors the CM phase in the Mn2O5 system. In fact, electric polarization can be induced even in TbMn2O5 and DyMn2O5Cruz2007 despite the difference in rare earth ions, which is indicative of the pressure-induced CM phase. Crystal as well as magnetic structure analyses under hydrostatic pressure are crucial for determining what kind of magnetic exchange interaction plays an essential role in stabilizing the LT-ICM and CM phases.
The authors acknowledge Dr. K. Kohn for providing a high-quality single crystal of HoMn2O5. We also thank K. Ohoyama and H. Hiraka for their technical assistance in the measurements at AKANE. Neutron diffraction measurements were performed under the PACS No. 7736 of Japan Atomic Energy Agency. This work was supported by Grant-In-Aid for Scientific Research (B) (16340096), and Grant-in-Aid for Scientific Research on Priority Areas “Novel States of Matter Induced by Frustration” (19052001), from the Japanese Ministry of Education, Culture, Sports, Science and Technology. This work was performed under the Interuniversity Cooperative Research Program, No. 30, of the Institute for Materials Research, Tohoku University.
Acknowledgements.
References
- (1) H. Hur, S. Park, P. A. Sharma, J. Ahn, S. Guha and S.-W. Cheong: Nature (London) 429 (2004) 392.
- (2) N. Hur, S. Park, P. A. Sharma, S. Guha and S.-W. Cheong: Phys. Rev. Lett. 93 (2004) 107207.
- (3) G. R. Blake, L. C. Chapon, P. G. Radaelli, S. Park, N. Hur, S.-W. Cheong and J. Rodríguez-Carvajal: Phys. Rev. B 71 (2005) 214402.
- (4) H. Kimura, S. Kobayashi, S. Wakimoto, Y. Noda and K. Kohn: 354 (2007) 77, and references therein.
- (5) T. Kimura, T. Goto, H. Shintani, K. Ishizaka, T. Arima and Y. Tokura: Nature (London) 426 (2003) 55.
- (6) G. Lawes, A. B. Harris, T. Kimura, N. Rogado, R. J. Cava, A. Aharony, O. Entin-Wohlman, T. Yildirim, M. Kenzelmann, C. Broholm and A. P. Ramirez: Phys. Rev. Lett. 95 (2005) 087205.
- (7) K. Taniguchi, N. Abe, T. Takenobu, Y. Iwasa and T. Arima: Phys. Rev. Lett. 97 (2006) 097203.
- (8) D. Higashiyama, S. Miyasaka, N. Kida, T. Arima and Y. Tokura: Phys. Rev. B 70, (2004) 174405.
- (9) W. Ratcliff II, V. Kiryukhin, M. Kenzelmann, S.-H. Lee, R. Erwin, J. Schefer, N. Hur, S. Park and S.-W. Cheong: Phys. Rev. B 72, (2005) 060407(R).
- (10) D. Higashiyama, S. Miyasaka and Y. Tokura: Phys. Rev. B 72 (2005) 064421.
- (11) H. Kimura, Y. Kamada, Y. Noda, K. Kaneko, N. Metoki and K. Kohn: J. Phys. Soc. Jpn. 75 (2006) 113701.
- (12) H. Kimura, Y. Kamada, Y. Noda, S. Wakimoto, K. Kaneko, N. Metoki, K. Kakurai and K. Kohn: J. Korean Phys. Soc. 51, (2007) 870.
- (13) H. Kimura, S. Kobayashi, Y. Fukuda, T. Osawa, Y. Kamada, Y. Noda, I. Kagomiya and K. Kohn: J. Phys. Soc. Jpn. 76 (2007) 074706.
- (14) R. P. Chaudhury, F. Yen, C. R. de la Cruz, B. Lorenz, Y. Q. Wang, Y. Y. Sun and C. W. Chu: Phys. Rev. B 75 (2007) 012407.
- (15) C. R. de la Cruz, B. Lorenz, Y. Y. Sun, Y. Wang, S. Park, S.-W. Cheong, M. M. Gospodinov and C. W. Chu: Phys. Rev. B 76 (2007) 174106.
- (16) B. Wanklyn: J. Mater. Sci., 7 (1972) 813.
- (17) N. Aso, Y. Uwatoko, T. Fujiwara, G. Motoyama, S. Ban, Y. Homma, Y. Shiokawa, K. Hirota and N. K. Sato: AIP Conference Proceedings 850 (2006) 705.
- (18) S. C. Abrahams and J. L. Bernstein, J. Chem. Phys. 46, 3776 (1967).