The fluorine abundance in a Galactic Bulge AGB star measured from CRIRES spectra11affiliation: Data taken during CRIRES/ESO-VLT commissioning in June 2006.
Abstract
We present measurements of the fluorine abundance in a Galactic Bulge Asymptotic Giant Branch (AGB) star. The measurements were performed using high resolution K-band spectra obtained with the CRIRES spectrograph, which has been recently installed at ESO’s VLT, together with state-of-the-art model atmospheres and synthetic spectra. This represents the first fluorine abundance measurement in a Galactic Bulge star, and one of few measurements of this kind in a third dredge-up oxygen-rich AGB star. The F abundance is found to be close to the solar value scaled down to the metallicity of the star, and in agreement with Disk giants that are comparable to the Bulge giant studied here. The measurement is of astrophysical interest also because the star’s mass can be estimated rather accurately (). AGB nucleosynthesis models predict only a very mild enrichment of F in such low mass AGB stars. Thus, we suggest that the fluorine abundance found in the studied star is representative for the star’s natal cloud, and that fluorine must have been produced at a similar level in the Bulge and in the Disk.
1 Introduction
Fluorine (F) is probably the element whose nucleosynthetic origin is least known. The reason for the scarcity of knowledge is the fragility of its only stable isotope (19F) and the lack of measurable atomic lines in the optical spectral range of normal stars. Apart from UV measurements of highly ionized F in very hot stars (Werner et al., 2005) and optical measurements of neutral F in extreme helium stars (Pandey, 2006), the only source of information on stellar F abundances are vibration-rotation lines of the hydrofluoric acid (HF). The HF molecule is efficiently formed in cool stellar atmospheres (types K0 and later), and a number of strong lines appear in the near-IR -band. The first identification of stellar HF lines has been reported by Spinrad et al. (1971); lines of this molecule have been used by Jorissen et al. (1992) to measure F abundances outside the solar system for the first time.
Several astrophysical sites for the synthesis of F have been proposed. It has been confirmed by Jorissen et al. (1992) through the correlation with the abundance of carbon that AGB stars are indeed producers of F. This was also supported by a recent study of F abundances in AGB stars of the LMC cluster NGC 1846 (Lebzelter et al., 2008). Whether or not AGB stars are the main producers of F is still a matter of debate. Mowlavi & Meynet (2002) estimate that AGB stars contribute to as much as 25% of the Solar System fluorine, but they emphasize the roughness of their estimate. Cunha et al. (2003) in this respect rather suggest, based on observations of two red giants in the globular cluster Cen, that 19F is created by neutrino nucleosynthesis (-process) during core collapse in supernovae of Type II (SNe II Woosley & Weaver, 1995). However, Federman et al. (2005) did not find a clear indication for enhanced F abundance resulting from the -process in a region shaped by past supernovae. Finally, the Wolf-Rayet phase of massive stars was investigated as a third site of F production by Meynet & Arnould (2000).
The AGB phase is the final phase of nuclear processing for a broad initial mass range between 0.8 and 8 M☉. In this phase, the interior of the star is structured in the following way: The inert carbon-oxygen core is surrounded by a He-burning shell, on top of which is a He-rich shell, in turn surrounded by a H-burning shell. The outer H-rich envelope is fully convective and fills most of the star’s volume. The He-burning shell ignites only temporarily during so-called He-shell flashes or thermal pulses (TPs) to release large amounts of energy. During a TP the He-rich shell gets thoroughly mixed and is the site of rich nucleosynthesis (e.g. the s-process). For a comprehensive review of AGB evolution see e.g. Habing & Olofsson (2004). Among many others, 19F is produced via complex reaction chains under these conditions, or destroyed via captures forming 22Ne. At very high neutron densities, also n captures lead to a destruction of F. For a discussion of the relevant reactions see Forestini et al. (1992). The processed matter is brought to the stellar surface via third dredge-up (TDU) mixing events, which may operate after each TP.
Only few stellar systems have been investigated with respect to the abundance of F: Besides Galactic field red giants (Jorissen et al., 1992), similar stars have been observed in the globular cluster M4 (Smith et al., 2005), as well as in Cen and the LMC (Cunha et al., 2003; Lebzelter et al., 2008). Smith et al. (2005) add F to the list of elements known to vary in globular cluster stars and draw conclusions on the early-cluster chemical pollution. Schuler et al. (2007) recently presented the measurement of F in a very metal-poor star and found a considerable overabundance of this rare element.
In this paper we report the measurement of the F abundance in a MS spectral type Bulge AGB variable, i.e. an AGB star with an O-rich chemistry enriched in s-process elements. It is the first measurement of this kind in a star of the Galactic Bulge, and one of few F abundance determinations from a TDU-AGB star. The observations have been carried out with the CRIRES infra-red spectrograph.
2 CRIRES Observations
CRIRES is the CRyogenic Infra-Red Echelle Spectrograph mounted to the Nasmyth focus A at the 8.2 m Unit Telescope #1 (Antu) of ESO’s VLT on Cerro Paranal, Chile. It has been installed at the telescope in 2006 followed by several commissioning and science verification runs. CRIRES is designed for high spectral resolution ( up to ) and operates in the spectral range 0.95 5.3 . A curvature sensing adaptive optics system feed is used to minimize slit losses and to provide diffraction limited spatial resolution along the slit. More details about the CRIRES instrument can be found in Käufl et al. (2004) and on-line at www.eso.org/instruments/crires/.
One star observed during the first CRIRES commissioning run in June 2006 was the Bulge Mira variable M1347 (catalog Plaut 3-1347) (Wesselink, 1987), also known as Plaut 3-1347 or V2017 Sgr (J2000 coordinates: 18h 38m 457 34∘ 33′ 28′′). With a Galactic latitude of about 126 it belongs to the outer Bulge. The observations of M1347 were carried out on June 07, 2006. A large part of the near-IR K-band was observed, although the analysis presented here is limited to two wavelength settings covering the range 2.253 2.310 . The slit-width was set to 02; thus, the maximum resolution of 100 000 (3 km s-1 equivalent) was achieved. The integration time was 60 s for each of the four nodding positions per setting. A hot standard star at similar airmass was observed immediately afterwards. The raw frames were reduced with the CRIRES pipeline (version 0.2.3), and the 1D science and standard star spectra were wavelength-calibrated separately using the numerous telluric absorption lines present on all of the four detector arrays. The wavelength-calibration was done separately for the science and telluric standard star spectrum because of the limited reproducibility of the Echelle grating position. Finally, the science spectrum was divided by the standard star spectrum to correct for the telluric lines and the illumination pattern as well as possible. Note that the telluric lines are strong enough to use them as wavelength calibrator, but they are weak enough to be corrected for by standard star division; thus they have no influence on the abundance measurements presented here. The signal-to-noise ratio was estimated from an overlapping region on chip #3 that was observed in both settings to be close to 100.
3 Stellar parameters
M1347 has previously been observed together with a larger sample of Bulge AGB stars with the UV and Visual Echelle Spectrograph (UVES) at the VLT on July 08, 2000 (= JD 2451733.6) in the blue arm (377 490 nm) and in the red arm (667 – 1000 nm). It was found to show absorption lines of technetium (Uttenthaler et al., 2007a) and lithium (Uttenthaler et al., 2007b). Tc is an indicator of recent or ongoing s-process and TDU in an AGB star. As probably all genuine Bulge AGB variables this star is O-rich. Strong absorption bands of metal oxides such as TiO, VO, and ZrO are evidence that M1347’s C/O ratio is below unity. Because of the O-rich chemistry and signs of s-process enrichment (Tc, enhanced ZrO bands) it is classified as type MS (Stephenson, 1984). The (moderate) Li content of 111The abundance of element X on this scale is given by . in this star probably results from a different mixing phenomenon called cool bottom processing (CBP, e.g. Wasserburg et al., 1995), although other enrichment scenarios can not be completely excluded (Uttenthaler et al., 2007b).
The mass and luminosity of M1347 are rather well constrained, thus its abundances can be easily compared with expectations from models of stellar evolution and nucleosynthesis. From Fig. 3 of Straniero et al. (2003) the mass can be limited to the range over a wide range in metallicity (). In the Bulge, due to its age, no high-mass stars () reaching C/O1 because of dredge-up of carbon on the TP-AGB are present anymore. Below roughly 1.4 M☉ no dredge-up occurs at all, preventing a star to become s-process enriched. Note that the former constraint would not hold for a Disk star, since it then could be a higher mass star on its way to C/O1 experiencing one of its first TDU events on the TP-AGB. Additional constraints come from the diagram. Using linear pulsation models (Wood & Sebo, 1996) M1347 is placed slightly above 1.5 M☉ (see Fig. 5 in Uttenthaler et al., 2007a). The luminosity at a distance of 8.0 kpc is measured to be (), and the period is 426.26 d (Uttenthaler et al., 2007a, b).
The CRIRES observations on JD 2453895.9 were carried out 5.07 light cycles after the UVES observations. We thus assume that, despite the star’s variability, M1347’s atmosphere was in a very similar state at the time of CRIRES observations compared to the UVES observations. We estimate atmospheric parameters from the UVES spectra by comparing them to a grid of synthetic spectra based on COMARCS atmospheric models. COMARCS is a revised version of MARCS (Jørgensen et al., 1992) with spherical radiative transfer routines from Nordlund (1984) and new opacity data from the COMA program (Aringer, 2000). Similar to the analysis of García-Hernández et al. (2007) a minimization method was used to find the parameters of the model best fitting the TiO (0,0)Ra (705.6 nm) and (0,0)Rb (709.0 nm) band heads in the UVES spectra (Uttenthaler et al., 2007b). The parameters found for M1347 are K, , [M/H] = 0.0. Furthermore, the parameters , , C/O = 0.48, and [Ti/H] = have been adopted for the calculation of the model grid. This model atmosphere was used to refine the metallicity of the star M1347 as explained in the next section. (Note here that the stellar mass assumed for the model atmosphere has a negligible effect on the spectrum and therefore is no indication of the real mass of the star.) The error on the effective temperature, the parameter on which abundance analysis is most sensitive, was estimated from the analysis to be K. The spectral type of M1347 was determined from the UVES spectrum using the relations of Fluks et al. (1994) as M7S. On the effective temperature scale of Ridgway et al. (1980), this corresponds to K, well inside the estimated error range. Assuming 1.5 M☉ for the mass and and applying the Stefan-Boltzmann law to the measured luminosity results in a surface temperature of 3158 K.
4 Analysis
4.1 Spectral synthesis
The lines R12 to R28 of the vibrational 10 band of the HF molecule fall in the observed spectral range. The lines R12 and R13 are, despite the high resolution, hopelessly lost in the 12CO 20 band (head at 2293.5 nm) and cannot be used for abundance analysis. Lines above R23 are very weak and could not be identified. The lines blue-ward of the 12CO 20 band head however are well suited for the analysis. We want to note here that all previous abundance analyses based on HF, except that of Jorissen et al. (1992), rely on a single line of that molecule!
A calculated line list of the HF molecule was kindly provided by R. H. Tipping (priv. comm.). This list is unpublished, and has been used previously by Jorissen et al. (1992) for the measurement of F abundances in Disk giants. The values of the lines could be derived from the Einstein values provided in the Tipping list with the corresponding standard transformation (as described in Bernath, 2005) assuming a rotational degeneracy of 2J. Together with the as well provided excitation potential, the data can be used for spectral synthesis calculations. Additionally, a measured line list by Webb & Rao (1968) is available which is also incorporated into the HITRAN data base (Rothman et al., 2005). For the 10 band of HF, this list contains only lines up to R14. We performed a comparison based on synthetic spectra between these lists for the lines of the 10 band in common and found very good agreement, both in wavelength and line strength. We thus assume that the error in the abundance analysis (section 4.2) resulting from uncertainties in line data is negligible. The calculated list of Tipping can be regarded as quite accurate. Since the Tipping data reaches to higher rotation quantum numbers, we only used the data from that list for the abundance analysis.
| Line | (nm) | ) | EW (mnm) | best-fit [F/H] | |
|---|---|---|---|---|---|
| R14 | 2289.305 | 11.41 | 6.276 | 43.5 | aaLine is observed in both spectrograph wavelength settings, and the mean of the EW and abundance determination is given. |
| R15 | 2283.316 | 11.18 | 6.865 | 41.2 | aaLine is observed in both spectrograph wavelength settings, and the mean of the EW and abundance determination is given. |
| R16 | 2278.453 | 10.87 | 7.489 | 35.9 | |
| R17 | 2274.711 | 10.47 | 8.148 | 47.3 | aaLine is observed in both spectrograph wavelength settings, and the mean of the EW and abundance determination is given. |
| R18 | 2272.085 | 9.993 | 8.841 | 55.7 | |
| R19 | 2270.575 | 9.449 | 9.566 | 30.1 | aaLine is observed in both spectrograph wavelength settings, and the mean of the EW and abundance determination is given. |
| R20 | 2270.180 | 8.843 | 10.32 | 26.3 | aaLine is observed in both spectrograph wavelength settings, and the mean of the EW and abundance determination is given. |
| R21 | 2270.903 | 8.185 | 11.11 | 30.5 | |
| R22 | 2272.749 | 7.483 | 11.93 | 9.8 | |
| R23 | 2275.724 | 6.748 | 12.78 | 11.5 | aaLine is observed in both spectrograph wavelength settings, and the mean of the EW and abundance determination is given. |
The TiO band heads used for the temperature determination are also somewhat sensitive to the metallicity [M/H] of the star, leading to a temperature metallicity degeneracy. We thus attempted to check the metallicity that was found by the minimization using atomic lines situated in the range observed with CRIRES. The reliability of values of atomic lines in the relevant wavelength range contained in the VALD database (Kupka et al., 1999) was checked by comparing an observed Arcturus (catalog ) spectrum (Hinkle et al., 1995) with a corresponding synthetic COMARCS spectrum. Four lines turned out to be well suited for the metallicity determination: a Na line at 2208.969 nm, a Ca line at 2282.718 nm, and two Fe lines at 2274.514 and 2283.870 nm, respectively. From these lines we determine a metallicity of [M/H] = , where the error comes from the scatter among the values from the individual lines (partly covered by two spectrograph settings). In principle, one could iterate the procedure to find the temperature of the star assuming a metallicity of [M/H] = , and with that temperature iterate again on the metallicity, etc. However, we find from our models that a change of dex in [M/H] has the same effect on the TiO band strength as a change of about K in , which is the accuracy of our temperature estimate. Thus, the impact on the F abundance measurement should be well within the estimated error bars (section 4.2). Nevertheless, the found metallicity agrees well with the peak metallicity of Bulge stars ([M/H] = ; Zoccali et al., 2003), and is just slightly below solar metallicity. We calculated a COMARCS atmosphere with the metallicity of [M/H] = and used it for the following spectral synthesis calculations.
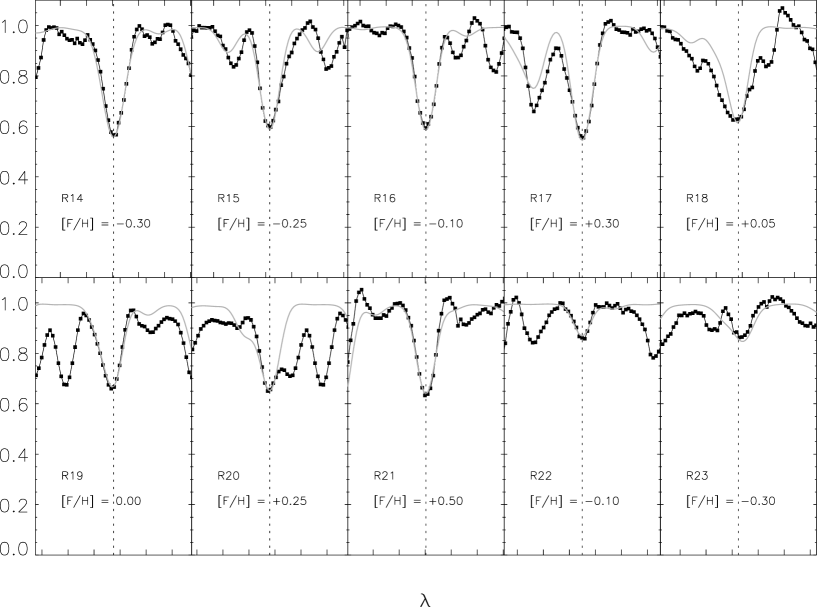
The best-fit F abundance was determined individually for the ten identified and measurable HF lines in the observed spectral range. Spectral synthesis was done in steps of 0.05 dex in F abundance. A solar reference value was adopted (Grevesse & Sauval, 1998). Table 1 lists the identified lines with their calculated wavelength, value, excitation potential , measured equivalent width (EW), and the best-fit [F/H] value derived from the respective line. In the spectral synthesis calculations, all atomic species and molecular lines from CO, CH, C2, SiO, CN, TiO, H2O, OH, VO, CO2, SO2, HCl, CH4, FeH, CrH, and ZrO were included to account for blending lines as well as possible. The line data references are summarized in Table 1 of Cristallo et al. (2007). An additional macroturbulence of has been added in the spectral synthesis. For best-fit model spectra see Fig. 1.
From Table 1 it becomes obvious that the F abundances required to fit the different HF lines have a large spread. This is most probably because some of the observed lines are blended, and the respective blending line is not adequately represented in any of the used line lists. There exists a general problem of uncertain or simply incomplete (molecular) line data in terms of wavelength and/or value which becomes particularly apparent at the high resolution of the present spectra. This difficulty is known, but detailed comparison to observed data is scarce (Aringer, 2005, is one of few examples). In the wavelength region analysed here, line data are uncertain especially for the CN list (see below). Also, dynamic and mass loss effects may lead to the formation of spectral lines which are not formed in hydrostatic atmosphere models used here (Nowotny et al., 2005).
The rotational lines inside a certain vibrational band of di-atomic molecules reach a maximum strength at a certain rotation quantum number, depending on the gas temperature. For the HF 10 band, this maximum is reached at the R5 line for the temperatures of the HF line forming layers. For higher and lower rotation quantum numbers the line strengths (opacities) will decrease monotonically. Some lines in our observed spectrum clearly deviate from this trend; these are the R17, R18, R20, and R21 lines. Although at least the R17 and R21 lines do not appear asymmetric, which would definitely hint at their blended nature, a blend of unknown origin and strength is assumed for these lines. The R18 and R20 lines have a rather asymmetric profile and are thus certainly blended. The R19 line is blended with a CN line in the synthetic as well as in the observed spectrum, but the contribution by CN seems to be well modelled. CN has been discarded from the list of molecules used for the spectral synthesis of the R22 line because a CN feature appeared in the red wing which is not present in the observed spectrum. Also R23, the highest-lying detected line, is problematic. It is blended with a CN line, too, with only a minor contribution by HF. We thus decided to exclude the lines R17, R18, R20, R21, and R23 from the determination of the average F abundance. The average F abundance from the remaining five lines in this “cleaned” list (R14, R15, R16, R19, and R22), calculated by converting the individual F abundances to a linear scale before averaging them and converting the average back to the logarithmic scale, is [F/H]= . The differences between observed and synthetic EWs of these lines, weighted with the inverse of their EW, reach least squares at [F/H] = .
We note that there is perhaps a trend of increasing [F/H] with increasing rotation quantum number even in the cleaned list of lines. Due to the very good agreement in terms of wavelength and gf values between the HITRAN and the Tipping line data for the lines up to R14 we regard incorrect line data as the source of this trend as unlikely. We performed abundance measurements with a model atmosphere with an effective temperature increased by 200 K (i.e. 3400 K); however, the trend remained. Thus, the trend is obviously not connected to a wrong temperature estimate. The only solution we can offer at the moment is that the trend might be related to a deviation of the temperature structure of the model atmosphere from that of the real atmopshere, but this has to be regarded as tentative. Whatever the reason for the trend is, we again want to stress that our study is only the second which employs more than one line to derive F abundances from HF lines.
4.2 Error analysis
Determining abundances in a Bulge Mira star is a tricky task. Unlike for globular cluster stars (e.g. Smith et al., 2005), no a priori value of the metallicity is known, and the temperatures of cool, pulsating Mira variables are difficult to measure precisely, not to mention other stellar parameters. The uncertainty on the F abundance derived here, as shown below, is higher than found in other studies (e.g. Smith et al., 2005).
A large source of error, due to its effects on molecule dissociation and level population, is the uncertainty in the effective temperature. By varying the temperature of the model atmosphere by K, which is a good measure of the temperature uncertainty, we find a variation of [F/H] of dex from all lines in the cleaned list.
The metallicity [M/H] has an impact on the measured F abundance comparable to that of the effective temperature because of its influence on the atmospheric structure. We therefore calculated spectra at the metallicities of the upper and lower limits of the metallicity range of M1347 (steps of to the adopted value of [M/H] = ). In fact, we found that the F abundance changes in lockstep with changes in the metallicity, which translates into an uncertainty of the F abundance of the same magnitude as the uncertainty in [M/H]. The HF lines become stronger upon decreasing the overall metallicity while keeping the F abundance constant, thus a lower metallicity of the model atmosphere results in an F abundance lowered by the same amount.
The surface gravity has only a minor effect on the derived F abundance. Increasing from to , a range generally occupied by red giant stars, leads to an F abundance reduced by 0.04 dex.
The values of the macro- and micro-turbulent velocities, and , could be checked for from the profiles of the HF lines in the cleaned list. A value of for both of them was found to very satisfyingly reproduce the profiles. A deviation of the sum of by more than leads to line profiles noticeably different from the observed profiles. This maximum deviation leads to an uncertainty of [F/H] of dex.
The specific value of the C/O ratio, which may differ from the solar value due to first and third dredge-up processes, may have an influence on the F abundance measurement in three different ways. First, it influences the strength of the TiO bands used for the temperature determination. Second, the atmospheric structure depends on the C/O ratio. Third, the C/O ratio influences the strength of lines blended with the HF lines, in particular of the very C/O-sensitive CN lines.
From a number of CN lines falling in the wavelength range observed with CRIRES which are identified in the Arcturus spectral atlas of Hinkle et al. (1995), we estimate that the C/O ratio in the atmosphere of M1347 is around 0.7. Since with the present data we cannot have an independent check on the O and N abundance, solar O and N abundances were assumed in this estimate. The occurrence of lithium in M1347 has been ascribed to CBP acting in this star (Uttenthaler et al., 2007b). If this interpretation is correct, the N abundance could be possibly enhanced because some 12C will be converted to 14N by CN cycling. We expect that the effect of this shift on the CN lines is a minor one.
Because the CN lines in the observed spectrum can by far be not as well fitted as the HF lines, our estimate of the C/O ratio is quite rough. For this reason, we decided to not change the C/O ratio of the model atmosphere that was used for the abundance analysis from its adopted value of 0.48. We rather estimate from the difference to C/O = 0.7 what the effect on the measurement of the F abundance is. We found from our model atmospheres that an increased C/O ratio increases the strength of TiO bands (which were used for the temperature determination). A naive expectation would be a decrease in TiO band strength because less O is available to form TiO as C/O is increased. The prime effect of an increased C/O ratio however is the same as an increased metallicity, namely that the atmospheric structure is changed such that the TiO bands become stronger. Only at a C/O ratio of 0.9 or higher, the effect of a decreasing number of oxygen atoms available to form TiO takes over, and the TiO bands finally decrease in strength. We find from our models that a C/O ratio of 0.7 implies a temperature of M1347 increased by about 30 K (compared to C/O = 0.48 , which in turn implies a F abundance increased by dex (see above). The effect on the atmosphere structure implies an F abundance decreased by dex. In our cleaned list of HF lines, only the R19 line is blended with a weak CN line, but its effect on the F abundance measured from the R19 line is negligible. Thus, the effects on the F abundance measurement of an increased C/O ratio (via the temperature determination on the one hand and the changed atmosphere structure on the other hand) effectively cancel out.
The error due to the (insecure) continuum placement can be estimated from lines observed in both wavelength settings; it amounts to dex. Finally, we include the statistical standard deviation of the F abundance derived from the individual lines of the cleaned list, which is dex, again calculated on a linear scale.
Converting the individual error items to a linear scale before summing in quadrature gives a total error of dex. The use of a hydrostatic model atmosphere for a variable star may induce an additional systematic error which we cannot estimate here. Table 2 summarizes the sources of error and their magnitudes.
| Source | [F/H] |
|---|---|
| (Parameter) | (dex) |
| C/O | |
| continuum | |
| stat. standard dev. | |
| Total |
5 Conclusions and Outlook
We measure a fluorine abundance in the Galactic Bulge AGB star M1347 of [F/H] = . With respect to the metal abundance we find [F/M] = (the error bar is smaller because [F/H] changes in step with changes in [M/H], thus the uncertainty in [M/H] does not enter the errorbudget of [F/M]). The F abundance in M1347 is thus in agreement with the scaled solar abundance. Note, however, that the solar system meteoritic F abundance is somewhat insecure, and reduced with respect to the F abundance in normal K-M giants of the solar neighbourhood (cf. Jorissen et al., 1992).
The F abundance measured in M1347 can be compared to Disk stars analysed by Jorissen et al. (1992). Of their list, the stars Y Lyn and RS Cnc are particularly comparable to M1347: Both have oxygen-rich atmospheres with positive detections of Tc, are of late spectral type (for Y Lyn the classifications M5Ib-II and M6S are found in the literature, for RS Cnc the classification is M6IIIS), and the effective temperature is quoted with 3200 K by Jorissen et al. (1992). Note, however, that Y Lyn and RS Cnc are semi-regular variables with a pulsation period of only 110 and 120 d, respectively, compared to the Mira-like variability of M1347 with a period of 426.6 d. This may hint towards a somewhat higher mass of Y Lyn and RS Cnc compared to that of M1347 (Lebzelter & Hron, 1999). Jorissen et al. (1992) determined F abundances of [F/H] = +0.15 for Y Lyn, and [F/H] = +0.13 for RS Cnc, respectively, and quote error-bars of the order of 0.2 – 0.3 dex. The F abundance of these two disk stars and the Bulge star analysed here thus overlap within the error bars.
The mass of the Bulge giant M1347 is estimated to be in the range , probably close to 1.5 M☉. The measured F abundance can thus be compared to theoretical predictions of AGB evolutionary and nucleosynthesis calculations. Predictions of the F surface abundance for a wide range of stellar masses and metallicities is presented e.g. by the calculations of Karakas (2003). Their lowest mass models experiencing TDU have for and for . Figures C7 and C18 of Karakas (2003) include the evolution of the surface abundance of 19F of these models. For the mentioned combinations of mass and metallicity, the surface abundance of F is enhanced only by dex on the TP-AGB due to internal nucleosynthesis and third dredge-up. A considerable increase is predicted only at higher masses (, see also Lugaro et al., 2004). Trusting in these model predictions, we may assume that the F we see in M1347 increased at most by dex from its initial abundance, i.e. the F abundance of M1347’s natal cloud.
It is interesting to compare this inferred Bulge fluorine abundance to predictions of Galactic chemical evolution models. A semi-analytic multizone chemical evolution model of fluorine in the Milky Way has been presented by Renda et al. (2004). The authors find satisfactory agreement between their model and the F abundance in solar neighborhood stars only if the contributions by Wolf-Rayet and AGB stars are taken into account. The F abundance in Cen giants however is well fit by F production in SNe II alone. In a similar manner, our measurement of the F abundance in the Bulge giant M1347, which is in agreement with the solar abundance, suggests that Wolf-Rayet and AGB stars also played a significant role in the chemical evolution of the Galactic Bulge. The formation of the Bulge then must have lasted long enough that its chemical evolution could have been influenced by these stellar types. We thus conclude that Wolf-Rayet and AGB stars contributed to the chemical evolution of the Galactic Bulge and Disk on a very similar level.
Lugaro et al. (2004) speculate that extra mixing processes (CBP) that connect the convective envelope to the H-burning shell might be the key to understand the high F abundances at a given C/O ratio as observed by Jorissen et al. (1992). The occurrence of Li in the Bulge star analysed in the present study has been ascribed to the operation of CBP, too (Uttenthaler et al., 2007b). However, the effect on CBP is rather that of decreasing the C/O ratio (because of the transformation of C into N, see also section 4.2) than influencing the F abundance. If layers with temperatures exceeding some 30 million K, also some F would be destroyed via 19F(p,)16O. It is not clear from current theoretical and observational studies if such high temperatures are involved in CBP an if destruction of F could indeed happen. Also from our observations no clear conclusion in this respect can be drawn. For further details on the connection between CBP and the fluorine abundance we refer to Lugaro et al. (2004).
It would be of interest to compare the F abundance in Bulge objects without signatures of internal nucleosynthesis (e.g. stars on the first giant branch) to the F abundance derived in the present study. If the F abundance in such stars is found to be close to our result, a confirmation of the predictions of detailed nucleosynthesis calculations such as those of Karakas (2003) for low mass stars is suggested. With the advent of high-resolution IR spectrographs like CRIRES such measurements have become readily feasible.
A deeper investigation of the nucleosynthetic origin of F is desired. We are currently devising a CRIRES observing program aimed at determining the F abundance in high-mass AGB stars of the Magellanic Clouds. In this respect the somewhat elaborate error analysis in section 4.2 is a useful and important exercise. The goal of these CRIRES observation will be to observe the predicted up-turn of F production at masses , and the F destruction at masses around 5 M☉ and higher. Important constraints on high-mass AGB evolution and reaction rates involved in the synthesis of 19F can be expected from these measurements.
References
- Aringer (2000) Aringer, B. 2000: “The SiO Molecule in the Atmospheres and Circumstellar Shells of AGB Stars”, Ph.D. thesis, Univ. of Vienna, Austria
- Aringer (2005) Aringer, B. 2005, in “High Resolution Infrared Spectroscopy in Astronomy”, Proc. of an ESO workshop, H. U. Käufl, R. Siebenmorgen, & A. F. M. Moorwood (eds.), Springer Berlin/Heidelberg, 303
- Bernath (2005) Bernath, P. F. 2005, “Spectra of Molecules and Atoms”, 2nd ed., Oxford University Press, New York
- Cristallo et al. (2007) Cristallo, S., Straniero, O., Lederer, M. T., Aringer, B., 2007, ApJ, 667, 489
- Cunha et al. (2003) Cunha, C., Smith, V. V., Lambert, D. L., & Hinkle, K. H. 2003, AJ, 126, 1305
- Federman et al. (2005) Federman, S. R., Sheffer, Y., Lambert, D. L., & Smith, V. V. 2005, ApJ, 619, 884
- Fluks et al. (1994) Fluks, M. A., Plez, B., The, P. S., de Winter, D., Westerlund, B. E., & Steenman, H. C. 1994, A&AS, 105, 311
- Forestini et al. (1992) Forestini, M., Goriely, S., Jorissen, A., & Arnould, M. 1992, A&A, 261, 157
- García-Hernández et al. (2007) García-Hernández, D. A., García-Lario, P., Plez, B., Manchado, A., D’Antona, F., Lub, J., & Habing, H. 2007, A&A, 462, 711
- Grevesse & Sauval (1998) Grevesse, N., & Sauval, A. J. 1998, Space Science Reviews, 85, 161
- Habing & Olofsson (2004) Habing, H., & Olofsson, H. 2004, “Asymptotic Giant Branch Stars”, A&A Library, Springer, New York
- Hinkle et al. (1995) Hinkle, K., Wallace, L., & Livingston, W. 1995, “Infrared Atlas of the Arcturus Spectrum, 0.9 - 5.3 microns”, PASP, 107, 1042
- Jørgensen et al. (1992) Jørgensen, U. G., Johnson, H. R., & Nordlund, Å. 1992, ASPC, 26, 540
- Jorissen et al. (1992) Jorissen, A., Smith, V. V., & Lambert, D. L. 1992, A&A, 261, 164
- Karakas (2003) Karakas, A. 2003, Ph.D. thesis, Monash University, Australia
- Käufl et al. (2004) Käufl, H. U., Ballester, P., Biereichel, P., et al. 2004, SPIE, 5492, 1218
- Kupka et al. (1999) Kupka, F., Piskunov, N., Ryabchikova, T. A., Stempels, H. C., & Weiss, W. W. 1999, A&AS, 138, 119
- Lebzelter & Hron (1999) Lebzelter, T., & Hron, J. 1999, A&A, 351, 533
- Lebzelter et al. (2008) Lebzelter, T., Lederer, M. T., Cristallo, S., Hinkle, K. H., Straniero, O., & Aringer, B. 2008, A&A accepted
- Lugaro et al. (2004) Lugaro, M., Ugalde, C., Karakas A. I., Görres, J., Wiescher, M., Lattanzio, J. C., & Cannon, R. C. 2004, ApJ, 615, 934
- Meynet & Arnould (2000) Meynet, G., & Arnould, M. 2000, A&A, 355, 176
- Mowlavi & Meynet (2002) Mowlavi, N., & Meynet, G. 2002, IAUS 187, 71
- Nordlund (1984) Nordlund, Å. 1984, in “Methods in Radiative Transfer”, W. Kalkofen (ed.), Cambridge University Press, Cambridge, 211
- Nowotny et al. (2005) Nowotny, W., Lebzelter, T., Hron, J., & Höfner, S. 2005, A&A, 437, 285
- Pandey (2006) Pandey, G. 2006, ApJ, 648, L143
- Renda et al. (2004) Renda, A., Fenner, Y., Gibson, B. K., Karakas, A. I., Lattanzio, J. C., Campbell, S., Chieffi, A., Cunha, K., & Smith, V. V. 2004, MNRAS, 354, 575
- Ridgway et al. (1980) Ridgway, S. T., Joyce, R. R., White, N. M., & Wing, R. F. 1980, ApJ, 235, 126
- Rothman et al. (2005) Rothman, L. S., Jacquemart, D., Barbe, A., et al. 2005, J. Quant. Spectrosc. & Rad. Tran., 96, 139
- Schuler et al. (2007) Schuler, S. C., Cunha, K., Smith, V. V., Sivarani, T., Beers, T. C.; Lee, Y. S. 2007, ApJ, 667, L81
- Smith et al. (2005) Smith, V. V., Cunha, C., Ivans, I. I., Lattanzio, J. C., Campbell, S., & Hinkle, K. H. 2005, ApJ, 633, 392
- Spinrad et al. (1971) Spinrad, H., Kaplan, L. D., Connes, P., Connes, J., Kunde, V. G., Maillard, J.-P. 1971, in: Lockwood G. W., Dyck H. M. (eds.), Proc. Conf. on Late-type Stars, Contrib. Kitt Peak National Obs., 554, 59
- Stephenson (1984) Stephenson, C. B. 1984, “A General Catalogue of Galactic S-Stars - Ed. 2”, Publ. of the Warner & Swasey Obs., v. 3:1, p. 1
- Straniero et al. (2003) Straniero, O., Domínguez, I., Cristallo, S., & Gallino, R. 2003, PASA, 20, 389
- Uttenthaler et al. (2007a) Uttenthaler, S., Hron, J., Lebzelter, T., Busso, M., Schultheis, M., & Käufl, H. U. 2007a, A&A, 463, 251
- Uttenthaler et al. (2007b) Uttenthaler, S., Lebzelter, T., Palmerini, S., Busso, M., Aringer, B., & Lederer, M. T. 2007b, A&A, 471, L41
- Wasserburg et al. (1995) Wasserburg, G. J., Boothroyd, A. I., & Sackmann, I.-J. 1995, ApJ, 447, L37
- Webb & Rao (1968) Webb, D. U., & Rao, K. N. 1968, J. Mol. Spectrosc., 28, 121
- Werner et al. (2005) Werner, K., Rauch, T., & Kruk, J. W. 2005, A&A, 433, 641
- Wesselink (1987) Wesselink, Th. J. H. 1987, Ph.D. thesis, Catholic University of Nijmegen, the Netherlands
- Wood & Sebo (1996) Wood, P. R., Sebo, K. M. 1996, MNRAS, 282, 958
- Woosley & Weaver (1995) Woosley, S. E., & Weaver, T. A. 1995, ApJS, 101, 181
- Zoccali et al. (2003) Zoccali, M., Renzini, A., Ortolani, S., et al. 2003, A&A, 399, 931