A phase-resolved spectroscopic study of the X-ray binary system 4U0115+63 based on Beppo-Sax observations.
Abstract
We present a phase resolved spectral analysis of the X-ray binary 4U0115+63 based upon Beppo-Sax satellite observations. Three strong absorption lines have been detected at all phases. We interpreted them as a cyclotron resonant scattering. Existence of the fourth cyclotron line has been confirmed at some phases. The cyclotron feature is found to be strongly dependent on the phase of the source, while the continuum part of the spectrum depends on the phase relatively weakly. The cyclotron lines turned out to be very nonequidistant. The second line is almost always deeper then the first one. We discussed physical conditions in the active regions of the source, under which a cyclotron feature similar to the observed one can appear.
1 Introduction.


4U0115+63 is a well-known transient massive X-ray binary source. The orbital period of the binary system is days, the eccentricity of the orbit is [1]. The optical companion of the source is Cassiopeiae, an star [2]. X-ray outburst from 4U0115+63 has been observed first with UHURU [3], and later with HEAO-1 [4], CGRO/BATSE [5], RXTE [6], Ginga [7], Beppo-SAX [8]. The source shows pulsations with the period 3.6 s [4].
A cyclotron resonant feature in the spectrum of 4U0115+63 has been found out in 1979 [9]. In 1983 the second cyclotron harmonic was discovered [10]. Later the third and the forth cyclotron absorption lines have been detected in the spectrum of the source [11, 8]. Mihara et al. fulfilled a phase-resolved spectroscopy of 4U0115+63 based on Ginga observations [7]. They have found a clear dependence of the parameters of the cyclotron feature on the phase of the source and its luminosity.
By now 4U0115+63 is the only X-ray binary having four cyclotron lines observed in its spectrum. This unique property make the source 4U0115+63 a touchstone for theories of the gyromagnetic emission of X-ray pulsars. If only one weak line is visible in the spectrum of a pulsar, usually it can be fitted well enough by a very wide group of theoretical models. A big number of feature’s parameters in the case of 4U0115+63 could give as an opportunity to choose from this abundance of models the appropriate one.
Here we report on the phase-resolved spectral analysis of 4U0115+63 based on Beppo-Sax satellite observations of the source’s outburst in 1999 March. We concentrated particulary on the cyclotron feature and its evolution with the phase. Obtained results allowed us to analyze the conditions in the active region of the source and physical processes leading to the formation of the cyclotron lines.
2 Observations and spectral analysis.
2.1 Time analysis.
This work is based upon the observations performed by Beppo-Sax satellite on 1999 March, 26 (OP6714). Observation time was equal . Since the first cyclotron harmonic in the spectrum of 4U0115+63 is near 12 keV [10, 8] we used the data from the spectral interval from 2 keV to 75 keV. This energy range is covered by three Beppo-Sax instruments: MECS2(2-11 keV), HPGSPC (7-30 keV), PDS(15-75 keV). More detail information about these instruments can be found in [12, 13, 14, 8].


| Phase | ||||
|---|---|---|---|---|
| 0,45 | -0,673 | 0,074 | 5,48 | 0,14 |
| 0,55 | -0,718 | 0,17 | 5,25 | 0,28 |
| 0,65 | -0,253 | 0,18 | 6,15 | 0,40 |
| 0,75 | -0,110 | 0,14 | 7,28 | 0,38 |
| Phase | ||||||||
|---|---|---|---|---|---|---|---|---|
| 0,85 | -0,164 | 0,16 | -2,65 | 0,38 | 12,0 | 0,38 | 25,0 | 5,5 |
| 0,95 | 0,0525 | 0,027 | -0,349 | 0,043 | 6,78 | 0,10 | 10,8 | 0,24 |
| 1,05 | 0,539 | 0,20 | -0,966 | 0,85 | 9,00 | 0,19 | 12,9 | 4,1 |
| 1,15 | 0,256 | 0,023 | -1,33 | 0,052 | 8,69 | 0,10 | 17,7 | 0,61 |
| 1,25 | -0,0926 | 0,033 | -1,53 | 0,10 | 8,40 | 0,21 | 18,2 | 1,1 |
| 1,35 | -0,219 | 0,065 | -1,68 | 0,18 | 7,91 | 0,33 | 16,0 | 1,6 |
| Phase | |||||||
|---|---|---|---|---|---|---|---|
| 0,45 | 0,43 | 0,031 | 0,57 | 0,049 | 0,52 | 0,041 | — |
| 0,55 | 0,46 | 0,091 | 0,53 | 0,055 | 0,58 | 0,063 | — |
| 0,65 | 0,28 | 0,25 | 0,32 | 0,10 | 0,51 | 0,070 | — |
| 0,75 | 0,28 | 0,095 | 0,35 | 0,042 | 0,55 | 0,045 | — |
| 0,85 | 0,61 | 0,083 | 0,46 | 0,061 | 0,21 | 0,050 | — |
| 0,95 | 0,048 | 0,0090 | 0,44 | 0,017 | 0,27 | 0,041 | 0,320,025 |
| 1,05 | 0,47 | 0,14 | 0,59 | 0,087 | 0,35 | 0,043 | 0,430,25 |
| 1,15 | 0,23 | 0,0095 | 0,50 | 0,0071 | 0,48 | 0,37 | 0,260,033 |
| 1,25 | 0,21 | 0,020 | 0,46 | 0,010 | 1.0 | 3,6 | — |
| 1,35 | 0,23 | 0,026 | 0,37 | 0,016 | 0,55 | 0,37 | — |
| Phase | |||||||
|---|---|---|---|---|---|---|---|
| 0,45 | 2,77 | 0,21 | 4,41 | 2,1 | 6,41 | 5,8 | — |
| 0,55 | 3,96 | 1,1 | 4,41 | 3,0 | 6,41 | 6,9 | — |
| 0,65 | 3,50 | 1,4 | 4,41 | 8,6 | 6,41 | 7,4 | — |
| 0,75 | 3,16 | 0,58 | 4,41 | 3,4 | 6,41 | 4,8 | — |
| 0,85 | 3,72 | 0,66 | 3,97 | 0,51 | 4,23 | 1,4 | — |
| 0,95 | 0,749 | 0,22 | 3,21 | 0,14 | 1,86 | 0,60 | 8,981,9 |
| 1,05 | 4,41 | 4,04 | 3,69 | 0,68 | 2,12 | 0,58 | 12,75,1 |
| 1,15 | 1,77 | 0,13 | 2,02 | 0,065 | 1,09 | 0,97 | 7,691,9 |
| 1,25 | 1,88 | 0,20 | 2,19 | 0,099 | 0,429 | 0,77 | — |
| 1,35 | 1,62 | 0,11 | 2,68 | 0,19 | 0,805 | 0,64 | — |
| Phase | |||||||
|---|---|---|---|---|---|---|---|
| 0,45 | 12,2 | 0,10 | 1,72 | 0,038 | 2,55 | 0,092 | — |
| 0,55 | 12,56 | 0,28 | 1,69 | 0,052 | 2,55 | 0,11 | — |
| 0,65 | 12,39 | 1,2 | 1,51 | 0,056 | 2,52 | 0,30 | — |
| 0,75 | 12,19 | 0,44 | 1,62 | 0,034 | 2,84 | 0,12 | — |
| 0,85 | 11,15 | 0,17 | 1,77 | 0,020 | 3,08 | 0,089 | — |
| 0,95 | 11,19 | 0,15 | 1,9 | 0,027 | 2,76 | 0,046 | 3,770,11 |
| 1,05 | 12,23 | 0,76 | 1,84 | 0,12 | 2,69 | 0,17 | 3,790,34 |
| 1,15 | 12,8 | 0,73 | 1,86 | 0,0099 | 2,83 | 0,035 | 4,160,10 |
| 1,25 | 12,11 | 0,13 | 1,99 | 0,020 | 3,04 | 0,053 | — |
| 1,35 | 11,37 | 0,088 | 2,04 | 0,015 | 2,77 | 0,034 | — |
In order to obtain the energy-resolved pulse-profiles and phase-resolved energy spectra the photon arrival times were first corrected to the Solar System barycenter. By using period folding [15], we have found the period of the pulsar to be equal s. No variations of the period of the source have been detected. Obtained pulse profiles for different energy ranges are represented on Fig.1-3. A main soft peak (in the phase interval 0,2-0,75) with maximum at 0,4 and a hard peak (in the phase interval 0,75-1,2) with maximum at 1,05 are plainly distinguishable. Hard peak is relatively narrow, and its shape remains almost constant over a wide range of energies (above 4 keV). On the contrary, the form of the main soft peak depends highly from energy; over 30 keV it almost disappears.
To examine the situation in more details we plotted the softest part of the emission with higher energy resolution (Fig.4) .On this figure a new feature appears: a secondary soft peak with maximum at the phase 0,85, while the hard peak disappears. Moreover, the shape of the main soft peak changes drastically. On the energies above 3 keV it has a clear maximum at the phase 0,4. and descending region between 0,4 and 0,7. But over the energies 2-3 keV it becomes quite flat without any clear maximum. It might be accounted for the influence of the above-mentioned secondary soft peak, but if we consider phase profile evolution from 5 to 2 keV, it turns out, that intensity difference between the maximum value at the phase 0,85 and the minimum value at 0,75 remains almost the same, while intensity difference between the minimum value at 0,75 and the value at 0,7 rises steeply. It means that the appearance of the secondary soft peak and the change of the shape of the main soft peak at low energies are two different phenomena.
2.2 Spectral analysis.
In order to perform a phase-resolved analysis of the spectrum of the pulsar, all phase interval has been divided on ten equal phase regions. The phase region selection is represented on Fig.5.
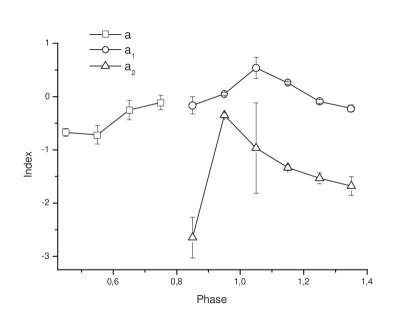
The source 4U0115+63 has a power-law spectrum with high-energy cutoff; this continuum is strongly distorted by cyclotron absorption [10, 8]. It turned out necessary during our analysis to divide the whole phase interval on two regions and to use different continuum models for them. First region covers phase interval from 0,4 up to 0,8 and approximately corresponds to the descending edge of a lower peak of the pulse-profile; second region covers all other phases. For the first region it was enough to use a simple power-law with exponential cutoff model
| (1) |
For the second region it turned out to be insufficient. The continuum spectra within the main peak have been fitted by the following model:
| (2) |
Numerical coefficients and have been chosen so that to make the function continuous. A fracture on the energy has been smoothed by a polynomial function.
In order to represent the cyclotron feature these continuum models have been multiplied on the so-called Gaussian filters, one for each line.
| (3) |
Here is the number of harmonic, is an energy of the first harmonic. Parameters define positions of the other harmonics. Initially they were taken equal to , but they were considered as free parameters in order to represent unequidistant cyclotron lines. Three cyclotron lines have been detected at all phases. The fourth harmonic turned out to be necessary only at the phases 0,9-1,2. No iron line at 5-7 keV has been detected.
3 Results and discussion.
3.1 Energy-resolved analysis of the phase profiles.
As it has been described in the previous section, pulse profile of the source contains two main features: the hard peak and the main soft peak. This brings up a question: Are these features produced by different magnetic poles of the neutron star, or they are a pencil and a fan beam from the same pole. Let us discuss both these hypotheses. But at first we remark, that if the emission has a fan directional diagram, an observer should cross its plane twice a period. Therefore we can expect a fan beam should produce two features on a pulse profile. And so the hard peak is the most probably a pencil beam (there is only one hard peak in the pulse profile), while the two peaks could either be produced by the same fan beam (the phase distance between them is almost equal 0,5), or be two independent components, produced by different magnetic poles.
If the hard peak and the main soft peak are formed in the same active region (this supposition is called hereafter hypothesis 1), then the main soft peak is, of cause, a fan beam (the phase interval between it and the hard peak is big enough), and the secondary soft peak is almost indubitably the second impulse of this fan. The hard and the main soft peaks together cover nearly the whole period of the pulsar. It means that one active zone of the neutron star is visible all the period, while an emission of the other does not reach an observer at all. This situation is possible only if the angle between our line of sight and the axis of rotation of the neutron star is small enough.
The hard peak is situated strongly asymmetrically with respect to the two soft peaks, which is to say that the pencil beam is inclined noticeably with respect to the axis of the fan beam. Moreover, the spectral properties of the main and the secondary soft peaks are quite different, i.e spectral characteristics of the fan beam depend highly from azimuth. Surely, it is possible only in the accretion occurs non-axis-symmetrically. It means, that the magnetic field of the pulsar is greatly non-dipole.
Let us now consider the situation, when the hard peak and the main soft peak are formed in different active regions (hereafter hypothesis 2). Then the main soft peak and the secondary soft peak could be components of a fan beam forming on the second magnetic pole of the neutron star (hypothesis 2a). In conclusion, the situation is possible when the main soft peak is formed by a pencil beam from the second magnetic pole, while the secondary soft peak is only a softer and wider component of the hard peak (hypothesis 2b). But in any case there are strong arguments that the field of the pulsar differs drastically from the dipole one. The hard peak is situated strongly asymmetrically with respect to the two soft peaks (this argument is valid if we assume hypothesis 2a) and the phase interval between the hard peak and the main soft peak is well below (if we assume hypothesis 2b).
Under consideration of the hypothesis 2 a question appears: why we can not see the hard component from the second magnetic pole? There are two probable explanations of this fact. As the hard component is more concentrated, it is possible that the geometry of the source is so that a hard component from the second hot spot on the neutron star’s surface (corresponding to the soft peak) exists but is invisible for us. But it is also possible, that emission of this hot spot doesn’t contain a hard component at all. As it has been already mentioned, magnetic field of the pulsar differs strongly from the dipole one. Under such conditions the physical parameters of the accreting streams and, consequently, of the emitting zones are absolutely different for the magnetic poles of the neutron star. It can led to the absence of a hard component from one of the poles.
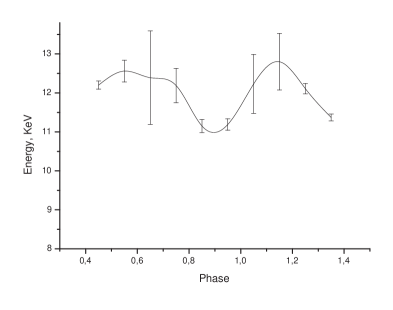
Both hypotheses (hypothesis 1 and hypothesis 2) have arguments for and against. If we assume that the hard peak and the main soft peak are formed on different active regions, then (considering the above-mentioned departure of the magnetic field from the dipole one) we might expect that the cyclotron features in the spectra of the hard and the main soft peaks have different fundamental energies. As seen from Fig.10, this is not the case. Changes of the first cyclotron line’s energy doesn’t correlate with the peaks of emission. This testifies in favour of formation of all the emission in the same region (hypothesis 1). But the hypothesis 1 faces with an another trouble. As it will be discussed below, the emission of the pulsar likely appears as a result of comptonization of the emission by hot plasma. Spectral properties of the obtained emission depends upon the temperature of the plasma [16]. The secondary peak disappears already at 3-4 keV, the main soft peak – at 25-30 keV; The hard peak is visible up to the highest energies. If we assume the hypothesis 1, it means that in a single active zone there are tree regions of plasma with absolutely different temperatures, which on the one hand have an optical depths great enough to produce remarkable features on the pulse profile (and each feature has their own directional characteristic), but on the other hand each region does not influence at all on the emission of the others. This situation is, of cause, possible, but it seems a bit artificial. It would be more natural to suppose, that the emission is formed in two different zones with different physical conditions.
3.2 Spectral analysis.
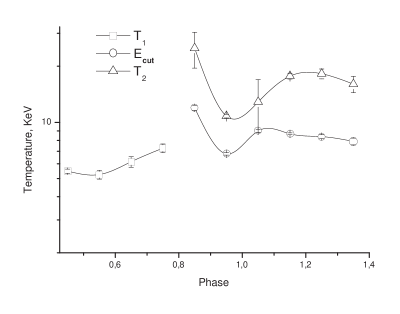
The source 4U0115+63 has a power-law spectrum with high-energy cutoff . This shape of spectrum as a whole is typical for the X-ray binaries and likely appears as a result of comptonization of the emission by the hot plasma of the accretion column. We tried to fit the continuum by the spectra suggested in [16]. These spectra represent results of comptonization by a simple-geometry plasma slab. Our attempts failed. It means that the geometry and the temperature distribution in the active region of the source are rather complicate and they probably consist of several layers of plasma with various temperatures and optical depths.
The cyclotron lines exist definitely at all the phases of the pulsar, but parameters of the spectrum are very phase-dependable. The parameters are represented on tables 1-2. First, second and third harmonics have been detected at all the phases of the source; fourth harmonic was visible only in the hard peak.
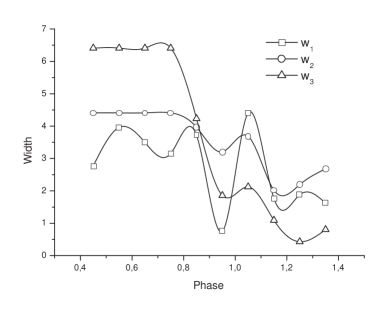
The cyclotron feature is the most pronounced not on the maxima of luminosity but on the descending edges. Moreover, the fundamental cyclotron energy also has a maximum on these edges. One of the possible ways of explanation of this effect is the following: an emission propagating exactly along the accretion column interacts with plasma on a very large interval of heights. The main energy of a cyclotron line is formed well above the surface of the neutron star in a region with respectively weak magnetic field. On the contrary an emission propagating aslant with reference to the column leaves the column respectively deep, but its path in these deeper layers is longer. Consequently, we can expect that in this case that cyclotron line would be deeper but narrower and its main energy higher. One can see that it is really so: the widths of the lines have local maxima correlating with the maximum of luminosity instead of the descending edge. But then a question appears: why this effect acts only on the descending edge and not valid on the ascending one? The cause of this could be the above-mentioned asymmetry of the accretion column appearing as a result of out-of-dipole magnetic field of the pulsar. The difference between the spectra of descending and ascending edges can be considered in its turn as an addition evidence of a departure of the field from a dipole.
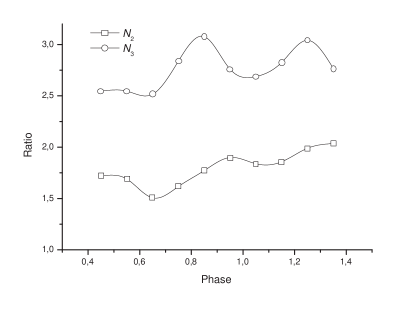
The fundamental cyclotron energy is not stable: its variations are of the order of 10% and they are near correlating with the variations of luminosity. Harmonics are very unequidistant. This effect is the most distinct on the second harmonic. The ratio between energies of the second and the first harmonics is as small as 1.6 at some phases.
The situation with the theoretical interpretation of these effects is not so simple. The effects are usually interpreted as a result of complex geometry of the emission forming region and magnetic field variations in it. Let as analyze this possibility.
The neutron star is considered to have a radius 10 km and a dipole magnetic field (for the estimating consideration this supposition is quite acceptable). The luminosity of the source 4U0115+63 is . When determined from the cyclotron energy by the usual nonrelativistic formula
| (4) |
the magnetic field of the source appears to be . There is a well-known formula for the angular size of the hot spot on the X-ray pulsar’s surface if its magnetic field is a dipole.
| (5) |
In the considering case we obtain . Relative variation of the magnetic field (and hence of the cyclotron energy) within the boundaries of such small a spot is of the order of . Of course it is enough to explain neither widths of lines nor their arranging. Consequently all these effects should be considered as a result of variations of the magnetic field along the height of the accretion column.
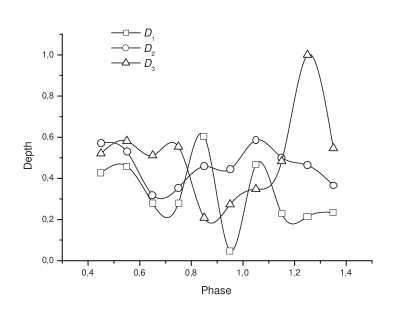
In the average the second harmonic is the strongest. The first harmonic is the most pronounced only in the region out of the major peak (phases 0,45-0,85). At the phase 1,15 where the cyclotron feature is the most distinct the second and the third harmonics have almost the same depths which is significantly higher then the depths of the first and the fourth one. These ratios between depths of different harmonics looks strangely. As it was shown in [18], cyclotron cross sections averaged over directions and polarizations under considering physical conditions are related as
| (6) |
Even for the direction perpendicular to the magnetic field this ratio is
| (7) |
One can see that in any case the first harmonic should be significantly stronger then the others. Meanwhile at the main peak the second and the third harmonics are stronger then the first one. The most believable explanation of this fact was given in the series of articles (see [19], [20], [21], [22], [23]). The authors explain the contradiction by the influence of the Raman scattering. Under the physical conditions existing in the accretion column the probability of the transition of an electron from the second Landau level through the branch () is approximately seven times higher [24] then through the branch (). An influence of the true absorption is negligible [25]. As a result a photon of the second harmonic being absorbed decays on two photons of the first one. This spawning leads to the significant decreasing of the first harmonic’s depth.
But this mechanism could be acceptable only for the second harmonic: for the ratio between third and second harmonics it fails. In fact, the integrated probability of the branches () and () is only 29%, and only one photon of the second harmonic appears instead of two photons in the previously described case. Furthermore even this rare photon has no chance to reach the distant observer. As it was shown in [21], Raman scattering of photons of the third harmonic can influence effectively on the spectra of previous harmonics only if an optical depth of the scattering electrons on the third harmonic is at least comparable with 1. But in this case their optical depth on the second harmonic should be 6. The spawned photon of the second harmonic is sure to experience the second scattering and decay on two photons of the first harmonic. So the efficiency of the spawning of photons of harmonics of the orders higher then first is negligible. But ratios of their depths in the observing spectrum are also very far from the theoretical relations between cyclotron cross-sections.
The nonequidistancy of the harmonics is also very difficult for the theoretical explanation. Owing to the above-mentioned relations between the cyclotron cross-sections the magnetized substance is much more transparent on the energy of the second harmonic then on the energy of the first one. Consequently the second harmonic should appear in the deeper regions of the accretion column with the stronger magnetic field. We might expect the distance between first and second harmonics to be bigger then the harmonic one. Meantime the distance is smaller than the harmonic: the ratio between energies of the second and the first harmonics sometimes is as small as . The same result have been already reported in [11].
The third harmonic is grotesquely deep at the phase 1,35. Moreover the confidence intervals of the at phases 1,25-1,45 are too big. The reasons of this effect is that the real line shapes differ distinctly from the Gaussian. The same result has been already reported [7]. Unfortunately there is now no universally accepted view of what shape should have a cyclotron line in a spectrum of an X-ray pulsar. A Gaussian model is one of the most commonly-using, mainly because of its simplicity. We tried different kinds of models for the lines and the Gaussian turned out to be the best. Moreover, the emission at the phase 1,25 is a mixture of emissions of the hard peak and the main soft peak and it makes its spectrum very complex. One of the possible ways to avoid this difficulties is to suppose that the cyclotron feature is formed by cyclotron radiation of ultrarelativistic, anisotropic electrons [17].
4 Conclusion.
To summarize: We studied the 4-75 keV pulse phase resolved spectrum of 4U0115+63 observed by Beppo-Sax. Analysis of it suggests that the magnetic field of the neutron star differs drastically from the dipole one. We confirm the strong dependence of the parameters of the cyclotron feature in the spectrum on the phase, while the continuum part changes rather weakly. We also confirm the existence of the fourth cyclotron line near keV. Gaussian shape is not quite good to fit the lines; further investigations are needed to propose some better model.
Consideration of the physical processes of the cyclotron feature formation points to some serious difficulties of the absorption model. In particular, it is unclear how to explain the observing ratios between depths and central energies of cyclotron lines in the context of it. Thus the generally used absorption model of the cyclotron feature in the spectrum of the source can not be considered as an indisputable.
5 Acknowledgments
We acknowledge with deep gratitude the assistance we have received from our colleagues from IASF, especially from A. La Barbera, A. Santangelo, and A. Segreto.
References
- [1] Rappaport, S., Clark, G.W., Cominsky, L. et al., Astrophys.J. Lett. 224, 1 (1978).
- [2] Unger, S., Roche, P., Negueruela, I., et al. 1998, A&A 336, 960 (1998).
- [3] Forman, W., Jones, C. and Tananbaum, H., Astrophys.J. Lett. 206, 29 (1976).
- [4] Rose, L., Pravdo, S., Kaluzienski, L. et al., Astrophys.J. 231, 919 (1979).
- [5] Bildsten, L. et al., Astrophys.J.Supp. 113, 367 (1997).
- [6] Coburn, W., Heindl, W.A., Rothschild, R.E. et al. 2002, Astrophys.J. 580, 394 (2002).
- [7] Mihara, T., Makishima, K., Nagase, F., Astrophys.J. 610, 390 (2004).
- [8] Santangelo, A., Segreto, A., Giarrusso, S. et al., Astrophys.J. Lett. 523, 85 (1999).
- [9] Wheaton, W.A. et al., Nature 282, 240 (1979).
- [10] White, N. E., Swank, J. H. and Holt, S. S., Astrophys.J. 270, 711 (1983).
- [11] Heindl, W.A., Coburn, W., Gruber, D. E. et al., Astrophys.J. Lett. 521, 49 (1999).
- [12] Boella, G., et. al., A&A 122, 327 (1997).
- [13] Manzo, G., Giarrusso, S., Santangelo, A., et al., A&A 122, 341 (1997).
- [14] Frontera, F., et al., A&A 122, 357 (1997).
- [15] Leahy, D.A., Elsner, R.F., Weisskopf, M.C. Astrophys.J. Lett. 272, 256 (1983).
- [16] Sunyaev, R.A., Titarchuk, L.G. 1980, A&A 86, 121.
- [17] Baushev, A.N. 2002, Astronomy Reports, 46, 830; arXiv:0804.1592
- [18] Harding, A.K., Daugherty, J.K., Astrophys.J. 374, 687 (1991).
- [19] Wang, J.C.L., et al. Phys. Rev. Lett. 63, 1550 (1989).
- [20] Wang, J.C.L., Wasserman, I.M. and Salpeter, E.E., Astrophys.J. 338, 343 (1989).
- [21] Lamb, D.Q., Wang, J.C.L. and Wasserman, I.M., Astrophys.J. 363, 670 (1990).
- [22] Wang, J.C.L., Wasserman, I.M. and Lamb, D.Q., Astrophys.J. 414, 815 (1993).
- [23] Isenberg, M., Lamb, D.Q. and Wang, J.C.L., Astrophys.J. 505, 688 (1998).
- [24] Daugherty, J.K., Ventura, J., A&A 61, 723 (1977).
- [25] Bonazzola, S., Heyvaerts, J. and Puget, J.L., A&A 78, 53 (1979).