CP 15051, RS, Porto Alegre 91501-970, Brazil
11email: charles@if.ufrgs.br, bica@if.ufrgs.br
Exploring FSR open cluster candidates within of the Galactic anticentre
Abstract
Context. We investigate the nature of a sample of star cluster candidates detected as stellar overdensities towards the Galactic anticentre.
Aims. Taken from the catalogue of Froebrich, Scholz, and Raftery (FSR), the sample contains 28 star cluster candidates located within of the anticentre. These are all the candidates in that sector classified by FSR with a high probability of being star clusters. Our main goals are to determine the fraction of such candidates that are unknown star clusters, to derive their astrophysical parameters, and to investigate the relationship of cluster parameters with position in the Galaxy.
Methods. Properties of the star cluster candidates are investigated with field-star decontaminated 2MASS colour-magnitude diagrams and stellar radial density profiles.
Results. All candidates present significant excesses in the radial density profiles, consistent with the method from which they were originally selected. Of the 28 candidates, 7 are previously known open clusters, 2 have been recently identified, and 6 are new ones with ages from 30 Myr to 1 Gyr. Among the remaining 13 candidates, 6 are uncertain cases that require deeper observations, while 7 appear to be important field fluctuations. The structure of part of the newly identified open clusters appears to be affected by interaction with giant molecular clouds in the Local and Perseus arms.
Conclusions. When photometric and radial distribution properties are considered together, an important fraction of the stellar overdensities with a fluctuation level are shown to be star clusters. Thus, catalogues of star cluster candidates, coupled to the present kind of study, are an important source for identifying unknown open clusters. Such efforts affect the understanding of the star-formation rate, cluster dynamical evolution, and Galactic structure, among others.
Key Words.:
(Galaxy:) open clusters and associations:general; Galaxy: structure1 Introduction
The open clusters (OCs) dwell and evolve in the Galactic disk. Dynamical processes such as mass segregation and evaporation, tidal interactions with the disk and bulge, and collisions with giant molecular clouds, as well as mass loss from the stellar evolution, accelerate the dynamical evolution, which affects the cluster structure in varying degrees. Given these circumstances, most OCs end up completely dissolved in the Galactic stellar field (e.g. Lamers et al. 2005) or as remnants (Pavani & Bica 2007 and references therein).
Evidence on different grounds, such as theoretical (e.g. Spitzer 1958; Lamers & Gieles 2006), N-body (e.g. Baumgardt & Makino 2003; Goodwin & Bastian 2006; Khalisi, Amaro-Seoane & Spurzem 2007), and observational (e.g. van den Bergh 1957; Oort 1958; von Hoerner 1958; Piskunov et al. 2007), consistently point to a disruption-time () scale that increases with Galactocentric distance. While in the inner Galaxy massive clusters are dissolved in Myr (Portegies Zwart et al. 2002), near the Solar circle the disruption-time scale is shorter than Gyr (e.g. Bergond, Leon & Guilbert 2001; Lamers et al. 2005). Reflecting this dependence, OCs older than Gyr are preferentially found near the Solar circle and in the outer Galaxy (e.g. van den Bergh & McClure 1980; Friel 1995; Bonatto et al. 2006a).
According to the WEBDA111obswww.univie.ac.at/webda - Mermilliod & Paunzen (2003) database, the current census provides OCs with known parameters. The statistics, however, are far from complete, especially at the faint end of the luminosity distribution and large distances (e.g. Kharchenko et al. 2005; Piskunov et al. 2007; Bonatto et al. 2006a). Besides dynamical disruption, observational limitations due to low cluster/background contrast, restrict the detectability to a very small fraction of the OCs in the Galaxy (Bonatto et al. 2006a). Thus, the derivation of astrophysical parameters of unknown star clusters is an important step in defining their statistical properties better.
A catalogue of 1021 star cluster candidates for and all Galactic longitudes was published by Froebrich, Scholz & Raftery (2007). Based essentially on stellar number-densities, they identified small-scale regions in the 2MASS222The Two Micron All Sky Survey — www.ipac.caltech.edu/2mass/releases/allsky/ database as overdensities with respect to the surroundings. The overdensities were classified according to a quality flag, ’0’ and ’1’ representing the most probable star clusters. Some brighter star cluster candidates in the FSR catalogue have so far been explored in detail. FSR 1735 (Froebrich, Meusinger & Scholz 2007) and FSR 1767 (Bonatto et al. 2007) are new globular clusters in the Galaxy. Available evidence indicates that FSR 584 is a also a new globular cluster (Bica et al. 2007). FSR 190 (Froebrich, Meusinger & Davis 2007) is either a globular cluster or a very old open cluster. FSR 1744, FSR 89 and FSR 31 are old OCs in the inner Galaxy (Bonatto & Bica 2007a). Ruprecht 101 (FSR 1603) resulted to be an old OC, and FSR 1755 an embedded cluster in the HII region Sh2-3 (Bica & Bonatto 2008).
Another interesting approach is to explore complete samples of candidates within limited regions along the disk. Recently, Bica, Bonatto & Camargo (2007) carried out a systematic colour-magnitude (CMD) and structural (with stellar radial density profiles - RDPs) analysis of FSR cluster candidates in bulge/disc directions, at . With quality flags Q=0 and 1, the complete sample contained 20 star cluster candidates. The results indicated 4 new and 2 previously known OCs with ages in the range 0.6 Gyr to Gyr and distances from the Sun , 5 uncertain cases (that require deeper observations), and 9 probable field fluctuations.
In the present paper, 28 anticentre FSR cluster candidates are explored. Our approach is based on 2MASS photometry, on which we apply a field-star decontamination algorithm (Bonatto & Bica 2007b) that is essential to disentangle physical from field CMD sequences. We also take into account properties of the stellar RDPs. A fundamental question to be addressed with this work is what fraction of the candidates will turn out to be clusters, uncertain cases that require deeper observations, and field fluctuations, as compared to a similar study of the disk in the opposite (bulge) direction (Bica, Bonatto & Camargo 2007). In principle, more clusters are expected owing to the lower level of crowding, field contamination, and absorption, and because optical OCs appear to intrinsically populate more the anticentre regions (Bonatto et al. 2006a, and references therein).
As will be seen in Sect. 2, several of the present sample candidates have a counterpart in optical studies, as e.g. in the WEBDA database. Recently, Glushkova et al. (2007) analysed a region around the anticentre and, likewise Froebrich, Scholz & Raftery (2007), they searched for new clusters or candidates. They determined cluster astrophysical parameters for part of the sample. In the present study we point out the clusters in common between Froebrich, Scholz & Raftery (2007) and Glushkova et al. (2007), which are part of the present sample. Thus, we will have available astrophysical parameters of optical clusters to compare with presently derived ones via 2MASS. It is very important to compare parameter determinations for clusters studied with different datasets, or the same data with different techniques. The anticentre provides this opportunity. We also point out that the availability of automated searches has provided elusive candidates that can hardly or cannot be recognised at all by eye inspection like classical optical OCs, owing to field contamination or absorption. Only decontamination methods can show their cluster nature or not (e.g. Bica, Bonatto & Camargo 2007).
This paper is structured as follows. In Sect. 2 we provide fundamental data of the sample candidates and present relevant data of the previously known OCs. In Sect. 3 we present the 2MASS photometry and discuss the methods employed in the CMD analyses, especially the field-star decontamination. In Sect. 4 we analyse the stellar radial density profiles and derive structural parameters of the confirmed star clusters. In Sect. 5 we discuss the star cluster parameters as a function of the position in the Galaxy. Concluding remarks are given in Sect. 6.
2 The anti-centre FSR star cluster candidates
For this study we selected all cluster candidates with quality flags ’0’ and ’1’ projected within and , taken from both classes of probable and possible candidates (Froebrich, Scholz & Raftery 2007). Observational data on the sample targets are given in Table 1. Also included are the core and tidal radii measured by Froebrich, Scholz & Raftery (2007) on the 2MASS images by means of a King (1962) profile fit, and the quality flag. Table 1 separates the candidates according to the FSR classification as probable or possible star cluster.
| Target | Q | ||||||
|---|---|---|---|---|---|---|---|
| (hms) | () | (∘) | (∘) | (′) | (′) | ||
| (1) | (2) | (3) | (4) | (5) | (6) | (7) | (8) |
| Probable Star Clusters | |||||||
| FSR 744 | 04:59:30 | 38:00:42 | 167.1 | 0.8 | 42.7 | 1 | |
| FSR 793 | 05:24:21 | 32:36:13 | 174.4 | 1.2 | 8.2 | 0 | |
| FSR 810 | 05:40:57 | 32:16:16 | 176.6 | 1.7 | 5.2 | 1 | |
| FSR 814 | 05:36:49 | 31:12:42 | 177.1 | 1.2 | 33.2 | 0 | |
| FSR 834 | 05:50:07 | 28:53:28 | 180.5 | 0.8 | 4.2 | 1 | |
| FSR 855 | 05:42:22 | 22:49:34 | 184.8 | 0.9 | 11.1 | 0 | |
| FSR 869 | 06:10:05 | 24:33:31 | 186.6 | 0.8 | 11.7 | 1 | |
| FSR 894 | 06:04:05 | 20:16:51 | 189.6 | 1.0 | 25.3 | 0 | |
| FSR 911 | 06:25:00 | 19:52:03 | 192.3 | 0.8 | 7.1 | 0 | |
| FSR 923 | 06:10:36 | 16:58:16 | 193.2 | 0.8 | 7.3 | 1 | |
| FSR 927 | 06:24:10 | 18:01:30 | 193.8 | 1.2 | 16.4 | 1 | |
| FSR 932 | 06:04:24 | 14:33:43 | 194.6 | 0.7 | 25.9 | 1 | |
| FSR 942 | 06:05:58 | 13:40:06 | 195.6 | 0.9 | 43.9 | 1 | |
| FSR 948 | 06:25:59 | 15:51:08 | 196.0 | 0.8 | 18.7 | 1 | |
| FSR 956 | 06:12:25 | 13:00:26 | 196.9 | 0.8 | 5.9 | 1 | |
| FSR 974 | 06:32:38 | 12:33:19 | 199.6 | 1.1 | 7.8 | 1 | |
| Possible Star Clusters | |||||||
| FSR 705 | 05:11:43 | 47:41:42 | 160.7 | 1.3 | 8.0 | 0 | |
| FSR 729 | 05:25:55 | 46:29:46 | 163.1 | 1.0 | 5.2 | 1 | |
| FSR 730 | 06:02:33 | 49:52:24 | 163.2 | 0.8 | 37.0 | 1 | |
| FSR 756 | 04:24:16 | 29:43:31 | 168.6 | 0.8 | 17.0 | 1 | |
| FSR 773 | 04:29:40 | 26:01:04 | 172.3 | 1.0 | 6.2 | 1 | |
| FSR 776 | 06:07:28 | 39:50:23 | 172.7 | 1.3 | 7.9 | 1 | |
| FSR 801 | 04:46:57 | 24:53:16 | 175.8 | 1.9 | 7.6 | 1 | |
| FSR 841 | 05:06:18 | 21:31:00 | 181.3 | 0.8 | 43.5 | 1 | |
| FSR 851 | 05:14:39 | 19:48:01 | 183.8 | 1.2 | 31.7 | 0 | |
| FSR 882 | 05:27:54 | 16:54:32 | 188.1 | 0.7 | 9.5 | 0 | |
| FSR 884 | 05:32:21 | 17:11:02 | 188.4 | 0.8 | 5.2 | 1 | |
| FSR 917 | 06:33:17 | 20:31:08 | 192.6 | 0.8 | 38.5 | 1 | |
Seven open clusters in the present FSR subsample have previous literature identifications (WEBDA), while 2 have been subsequently identified by Glushkova et al. (2007). Table 2 shows the cross-identifications and relevant references. We will adopt the first designation throughout this paper. Finally, we note that FSR 911 is located to the northwest of the young stellar system Bochum 1 (Moffat & Vogt 1975; Yadav & Sagar 2003). Indeed, a deeper analysis of the region of FSR 911 suggested that it is not Bochum 1, as discussed in Bica, Bonatto & Dutra (2008).
| Desig#1 | Desig#2 | Desig#3 | Desig#4 | References |
|---|---|---|---|---|
| (1) | (2) | (3) | (4) | (5) |
| Berkeley 23 | FSR 917 | — | — | 1,2 |
| Berkeley 69 | FSR 793 | — | — | 1,2 |
| Berkeley 71 | FSR 810 | — | — | 1,2 |
| Czernik 23 | FSR 834 | — | — | 1,2 |
| NGC 1798 | Berkeley 16 | FSR 705 | — | 1,1,2 |
| NGC 1883 | Collinder 64 | FSR 729 | — | 1,1,2 |
| NGC 2126 | Melotte 39 | Collinder 78 | FSR 730 | 1,1,1,2 |
| FSR 814 | Koposov 36 | — | — | 2,3 |
| FSR 869 | Koposov 63 | — | — | 2,3 |
Previous studies with results relevant to the present paper are summarised below.
NGC 1798: This object is an IAC. Park & Lee (1999) derived the age Gyr, distance from the Sun kpc, reddening , and limiting radius pc. Lata et al. (2002) found Gyr and . Maciejewski & Niedzielski (2007) found Gyr, , kpc, , core radius , and mass .
NGC 1883: Tadross et al. (2002) found , , and . Carraro, Baume & Villanova (2003) derived Gyr, , kpc, and . Villanova, Baume & Carraro (2007) derived the age Myr.
NGC 2126: Gaspar et al. (2003) derived Gyr, , and kpc. Maciejewski & Niedzielski (2007) found Gyr, , kpc, , , and .
Berkeley 69: Durgapal & Pandey (2001) found , , and .
Berkeley 71: Lata, Mohan & Sagar (2004) found Myr, , and pc. Maciejewski & Niedzielski (2007) derived Gyr, , kpc, pc, pc, and .
FSR 814: Glushkova et al. (2007) derived Myr, , and kpc.
Czernik 23: Glushkova et al. (2007) derived Myr, , and kpc.
FSR 869: Glushkova et al. (2007) derived Gyr, , and kpc.
Recently, Cz 23 has been studied in detail by Bonatto & Bica (2008), who have derived the parameters Gyr, , kpc, pc, pc, and a total mass of .
3 Photometry and analytical tools
In this section we briefly describe the photometry and outline the methods we apply in the CMD analyses.
3.1 2MASS photometry
2MASS photometry in the , and bands was extracted in all cases in a relatively wide circular field of 30′ in radius, centred on the coordinates provided by Froebrich, Scholz & Raftery (2007) (cols. 2 and 3 of Table 1). Photometry extraction was performed with the VizieR333vizier.u-strasbg.fr/viz-bin/VizieR?-source=II/246 tool. Wide extraction areas are necessary for statistical representativity of magnitude and colours, for a consistent field star decontamination (Sect. 3.3). They are important as well for stellar radial density profiles with a high contrast with respect to the background (Sect. 4). Properties and limitations of wide 2MASS-extraction areas are discussed in detail in, e.g. Bonatto & Bica (2007b). In some cases the RDP built with the original FSR coordinates presented a dip at the centre. Consequently, new central coordinates were searched to maximise the star-counts in the innermost RDP bin. The optimised central coordinates are given in cols. 2 and 3 of Table 5.
As a photometric quality constraint, the 2MASS extractions were restricted to stars with errors in , and smaller than 0.25 mag. About of the stars in all extractions considered here have errors smaller than 0.06 mag. A typical distribution of 2MASS uncertainties as a function of magnitude, for objects projected towards the central parts of the Galaxy, can be found in Bonatto & Bica (2007b).
| FSR 942 () | FSR 855 () | FSR 801 () | |||||||||||||
| (mag) | (stars) | (stars) | (stars) | (stars) | (stars) | (stars) | (stars) | (stars) | (stars) | ||||||
| 7–8 | — | — | — | — | — | 1 | 1.0 | 0.42 | 1.07 | — | — | — | — | — | |
| 8–9 | — | — | — | — | — | — | — | — | — | — | — | — | — | — | — |
| 9–10 | — | — | — | — | — | 1 | 1.0 | 0.99 | 1.42 | — | — | — | — | — | |
| 10–11 | 3 | 1.7 | 0.57 | 0.51 | 1 | 0.4 | 1.12 | 1.02 | — | — | — | — | — | ||
| 11–12 | 4 | 2.0 | 0.38 | 0.18 | 2 | 1.0 | 1.70 | 0.49 | 1 | 0.7 | 0.18 | 0.23 | |||
| 12–13 | 1 | 0.4 | 0.50 | 0.12 | 1 | 0.4 | 3.09 | 0.43 | 2 | 1.0 | 0.30 | 0.20 | |||
| 13–14 | 17 | 3.5 | 0.75 | 0.08 | 3 | 0.7 | 2.47 | 0.19 | 2 | 1.0 | 0.36 | 0.10 | |||
| 14–15 | 21 | 3.4 | 1.61 | 0.09 | 6 | 1.0 | 6.27 | 0.26 | 3 | 1.0 | 0.72 | 0.11 | |||
| 15–16 | 27 | 3.4 | 2.87 | 0.08 | 12 | 1.6 | 5.31 | 0.11 | 9 | 1.8 | 1.60 | 0.12 | |||
| 16–17 | 21 | 3.1 | 4.91 | 0.14 | 29 | 3.4 | 6.14 | 0.12 | 8 | 1.7 | 1.78 | 0.09 | |||
| All | 94 | 6.8 | 3.2 | 0.03 | 56 | 3.6 | 11.1 | 0.07 | 25 | 2.9 | 2.8 | 0.06 | |||
-
The table provides, for each magnitude bin (), the number of observed stars () within the spatial region sampled in the CMDs shown in the top panels of Figs. 3 and 4, the respective number of probable member stars () computed by the decontamination algorithm, the parameter, the Poisson fluctuation () around the mean, with respect to the star counts measured in the 8 sectors of the comparison field, and the field-star uniformity parameter (). The statistical significance of is reflected in its ratio with the Poisson fluctuation of () and with . The bottom line corresponds to the full magnitude range.

| Object | ||||||
| (′) | (stars) | (stars) | (stars) | |||
| Confirmed OCs | ||||||
| Be 23 | 4 | 67 | 4.5 | 10.9 | 0.06 | |
| Be 69 | 4 | 134 | 7.6 | 9.6 | 0.05 | |
| Be 71 | 3 | 104 | 7.1 | 6.0 | 0.05 | |
| Cz 23 | 4 | 66 | 4.4 | 15.6 | 0.07 | |
| NGC 1798 | 4 | 156 | 8.1 | 13.3 | 0.06 | |
| NGC 1883 | 4 | 115 | 6.7 | 7.5 | 0.04 | |
| NGC 2126 | 5 | 76 | 5.0 | 6.8 | 0.04 | |
| FSR 756 | 4 | 44 | 3.7 | 5.2 | 0.05 | |
| FSR 814 | 3 | 89 | 6.5 | 5.4 | 0.04 | |
| FSR 869 | 4 | 96 | 4.9 | 23.1 | 0.08 | |
| FSR 923 | 4 | 69 | 4.3 | 14.1 | 0.06 | |
| FSR 932 | 5 | 81 | 4.2 | 7.1 | 0.02 | |
| FSR 942 | 3 | 94 | 6.8 | 3.2 | 0.03 | |
| FSR 948 | 4 | 66 | 3.9 | 9.3 | 0.04 | |
| FSR 974 | 3 | 67 | 5.0 | 6.5 | 0.05 | |
| Uncertain cases | ||||||
| FSR 773 | 2 | 16 | 2.8 | 2.0 | 0.09 | |
| FSR 851 | 4 | 49 | 3.9 | 7.5 | 0.06 | |
| FSR 855 | 3 | 56 | 3.6 | 11.1 | 0.07 | |
| FSR 882 | 3 | 31 | 3.2 | 2.6 | 0.04 | |
| FSR 884 | 2 | 18 | 2.7 | 1.9 | 0.06 | |
| FSR 911 | 4 | 59 | 3.3 | 17.8 | 0.07 | |
| Possible field fluctuations | ||||||
| FSR 744 | 3 | 37 | 3.1 | 3.3 | 0.03 | |
| FSR 776 | 3 | 39 | 3.8 | 2.7 | 0.04 | |
| FSR 801 | 3 | 25 | 2.9 | 2.8 | 0.06 | |
| FSR 841 | 3 | 25 | 2.9 | 3.5 | 0.07 | |
| FSR 894 | 3 | 42 | 3.2 | 8.0 | 0.06 | |
| FSR 927 | 2 | 32 | 3.5 | 4.8 | 0.08 | |
| FSR 956 | 2 | 13 | 1.6 | 2.0 | 0.04 | |
-
Same as Table 5 for the statistics of the full magnitude range covered by the respective CMD. CMDs extracted from .
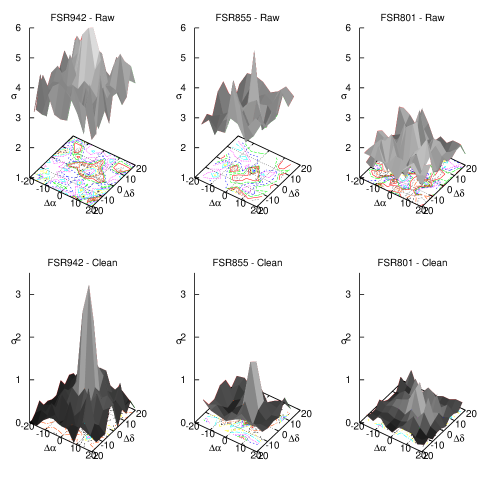
In Fig. 1 we show the spatial distribution of the stellar surface-density, as measured with the 2MASS photometry, for representative cases of the three different types of objects dealt with in this work. Surface-densities computed with the observed (top panels) and field-star decontaminated (Sect. 3.3) photometries (bottom) are included. A confirmed open cluster (FSR 942), an uncertain case (FSR 855), and a possible field fluctuation (FSR 801) are illustrated in Fig. 1. This figure shows the surface density (, in units of ) for a rectangular mesh with cells of dimensions . The mesh extends up to with respect to the centre, in right ascension and declination. Most of the cluster structure is contained in the central cell, especially for FSR 942 and FSR 855. The rather irregular surface-density distribution produced with the observed photometry, especially for FSR 801, occurs because of the important contamination by disk stars. Even so, a central excess can be seen, which corresponds to the overdensity detected by Froebrich, Scholz & Raftery (2007). FSR 942, on the other hand, clearly detaches in the central cells (top-left panel) against a less irregular field.
3.2 Colour-magnitude diagrams
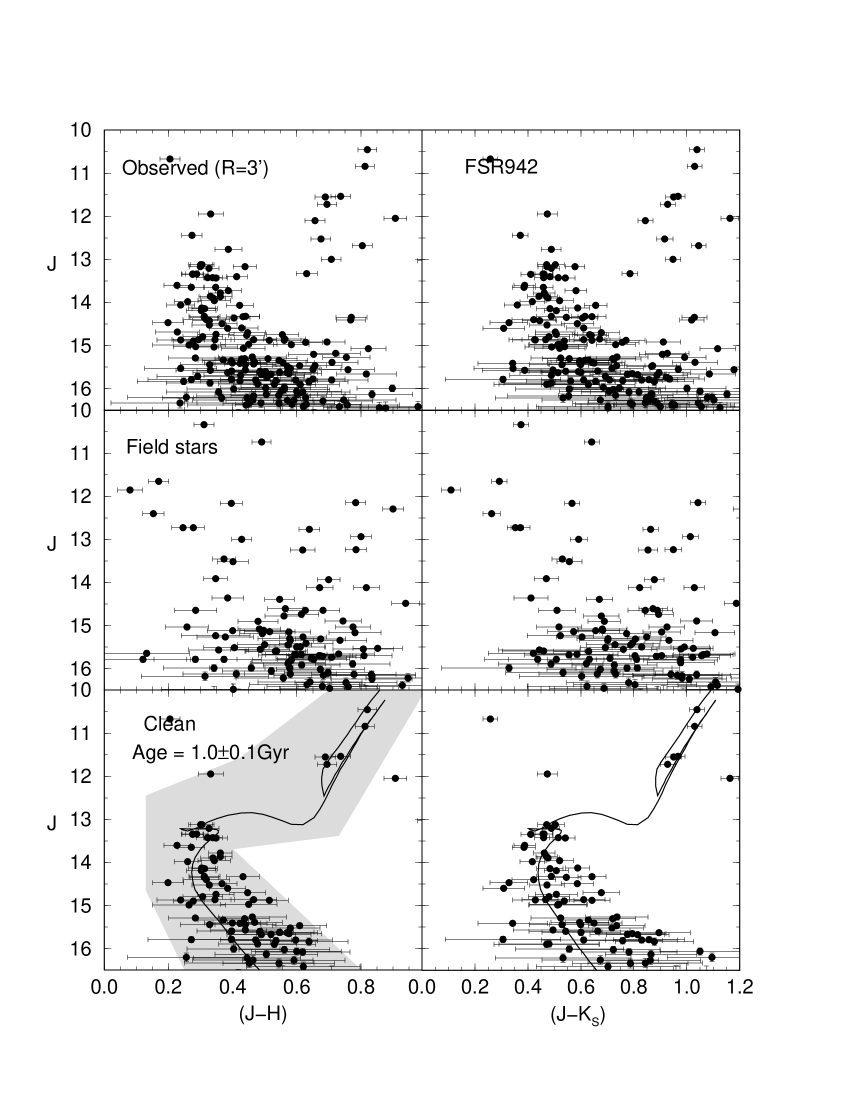
CMDs are fundamental for establishing the nature of the candidates in the present analysis. To illustrate this procedure we show in Fig. 2 the 2MASS and CMDs extracted from a central () region of FSR 942. This CMD, which corresponds to of the radial density profile radius (Sect. 4), shows a cluster-like population (the MS and a giant clump) mixed with a component of disk stars. A first assessment on the relative fraction of the contamination is provided by the equal-area comparison field (middle panels), extracted from the ring located at . Differences in densities between the observed and comparison field CMDs further suggest the presence of a main sequence and a giant clump of an intermediate-age OC. Similar features are present in the CMD (top-right panel).
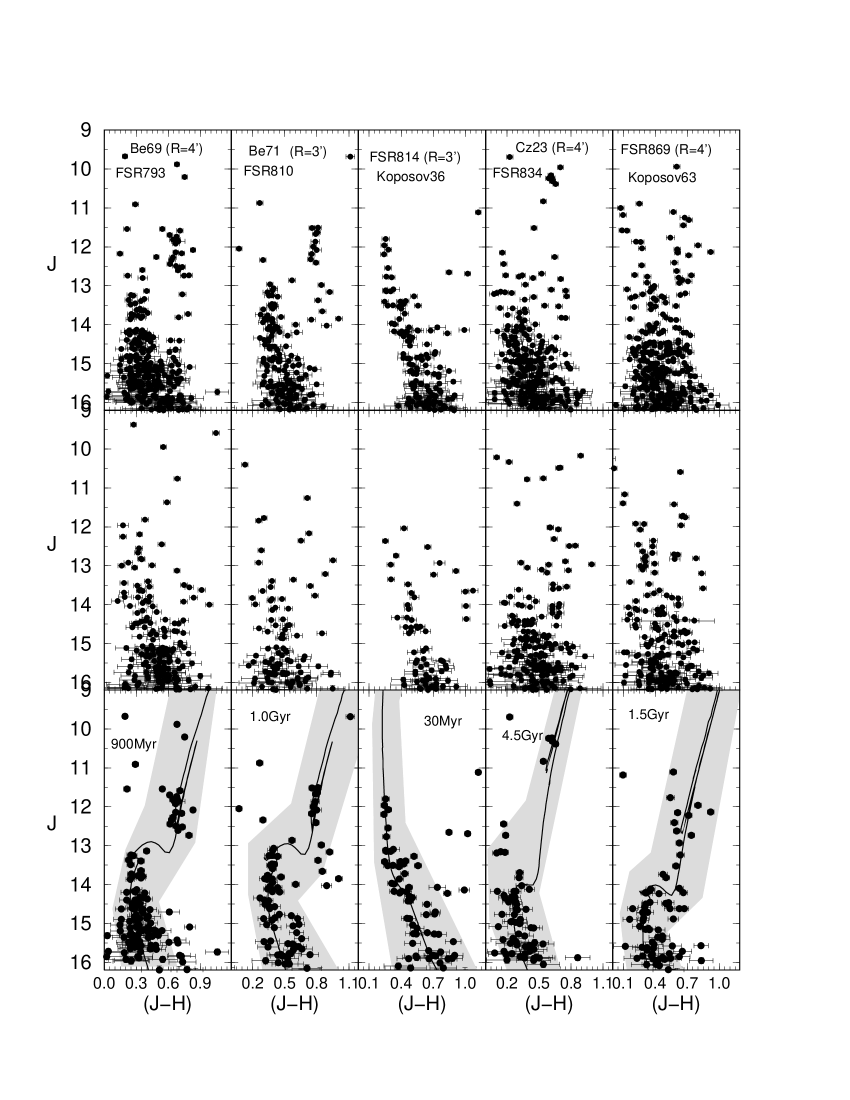
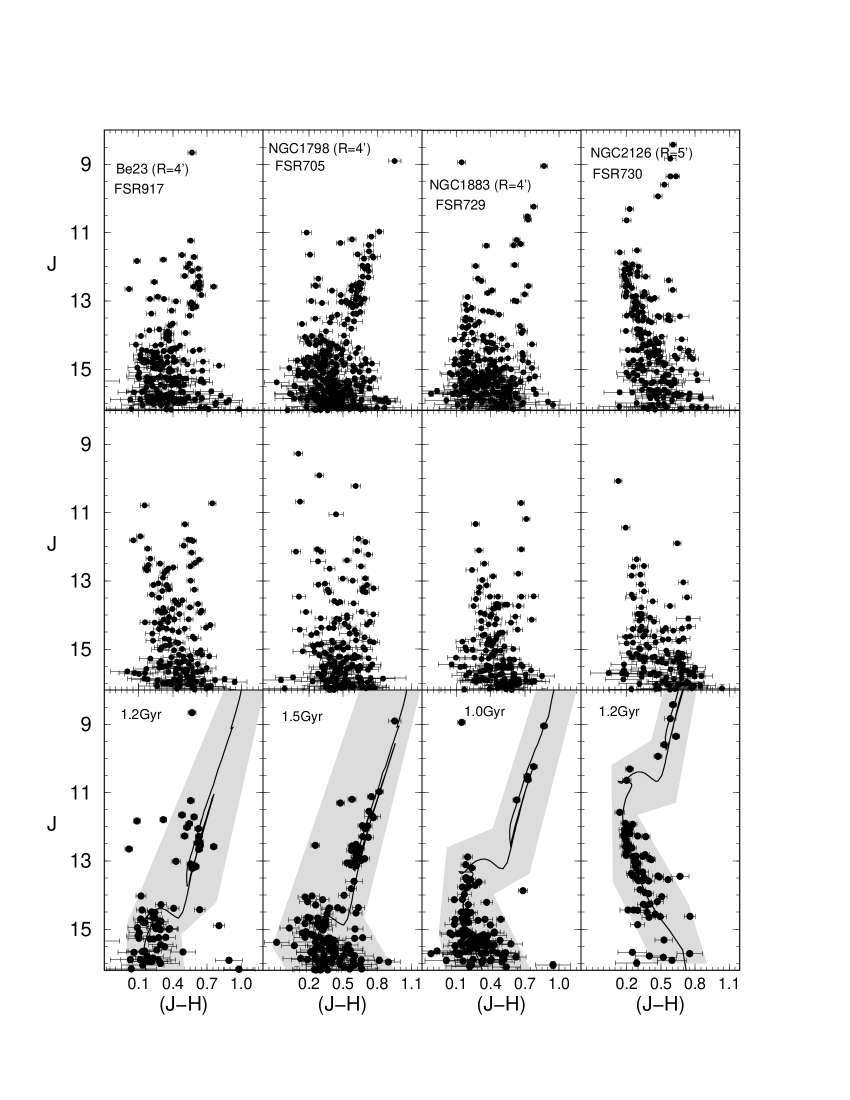
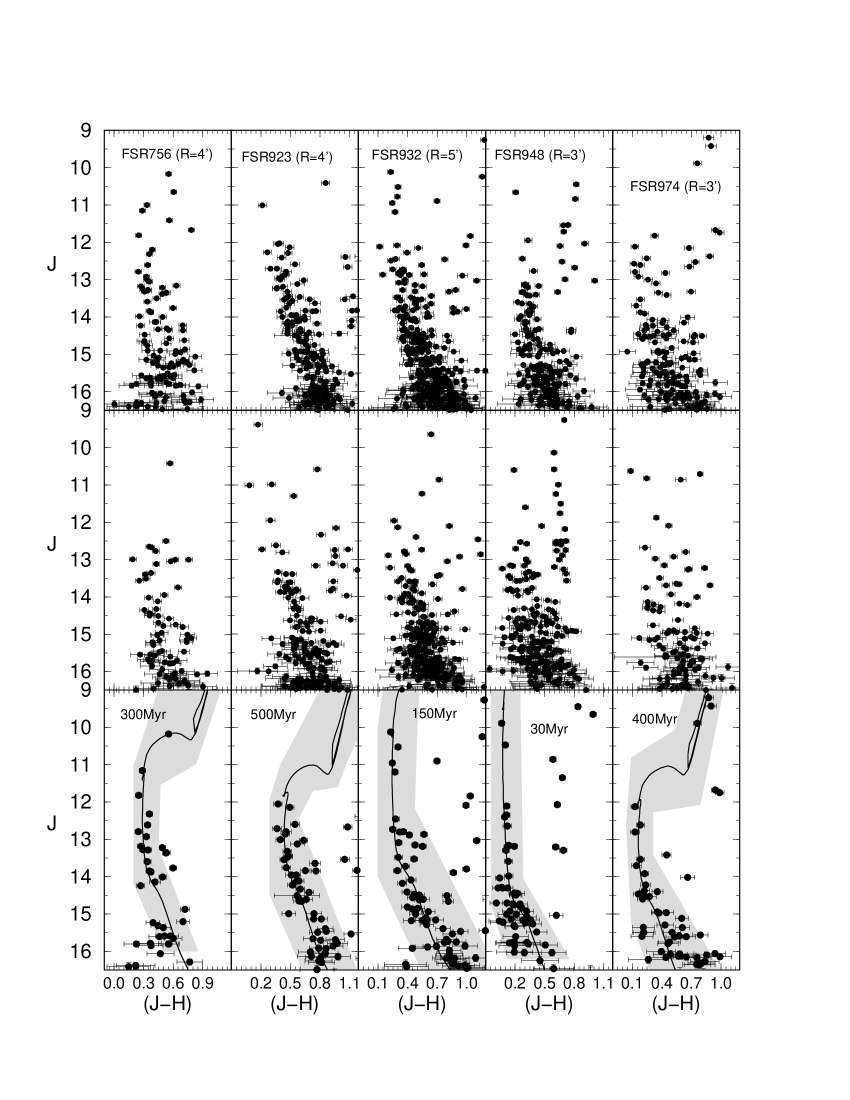
The observed CMDs of the remaining objects, extracted from central regions, are shown in the top panels of Figs. 3 to 5, with the corresponding comparison-field CMDs at the middle panels. For the sake of space, only the CMDs are shown. Similarly to the case of FSR 942, essentially the same CMD features are present in both colours.
3.3 Field-star decontamination
Field stars, mostly from the disk, contribute in varying proportions to the CMDs of the present objects (Figs. 2 - 5). In some cases, it appears to be the dominant component. Thus, it is essential to quantify the relative densities of field stars and potential cluster sequences to settle the nature of the cluster candidates, whether they are physical systems or field fluctuations.
We tackle this issue with the statistical algorithm described in detail in Bonatto & Bica (2007b) and Bica, Bonatto & Camargo (2007). We present here only a brief description of the algorithm. It computes the relative number-densities of probable field and cluster stars in cubic cells with axes along the magnitude and the and colours. Stars are subtracted from each cell in a number that corresponds to the number-density of field stars measured within the same cell in the comparison field. Typical cell dimensions are , and , which are a compromise between cell width and CMD resolution. They are wide enough to allow sufficient star-count statistics in individual cells and small enough to preserve the morphology of different CMD sequences. A wide ring beyond the RDP radius (Sect. 4) is used as comparison field, to provide a representative field star-count statistics. Note that the equal-area extractions shown in the middle panels of Figs. 2 to 5 serve only for visual comparisons between central and offset field CMDs. The actual decontamination process is carried out with the wide surrounding ring as described above. Further details on the algorithm, including discussions on subtraction efficiency and limitations, are given in Bonatto & Bica (2007b).
As output of the algorithm we have the number of probable (i.e. decontaminated) member stars, and the parameter which, for a given spatial extraction, corresponds to the ratio of with respect to the corresponding Poisson fluctuation of the number of observed stars. For instance, the number (and uncertainty) of observed stars in the CMD of FSR 942 (Fig. 2 and Table 4) is , while the corresponding number of decontaminated stars is . Thus, we derive for this extraction . In this sense, gives a measure of the statistical significance of the decontaminated number of stars. Both parameters, and , can be computed for the full range of magnitude covered by the CMD, or in individual magnitude ranges (see below). CMDs of star clusters have significantly higher than 1 (Bica, Bonatto & Camargo 2007). The algorithm also computes , which corresponds to the Poisson fluctuation around the mean of the star counts measured in the 8 equal-area sectors of the comparison field. Thus, measures the spatial uniformity of the star counts in the comparison field. Low values of are expected in a uniform comparison field. Ideally, star clusters should have higher than . It also computes , which measures the star-count uniformity of the comparison field, defined as , where and are the average and standard deviation of the number of stars over all sectors. Non uniformities such as heavy differential reddening should result in high values of .
Since we usually work with larger comparison fields than the cluster extractions, the correction for the different spatial areas between field and cluster is expected to produce a fractional number of probable field stars () in some cells. Before the cell-by-cell subtraction, the fractional numbers are rounded off to the nearest integer, but limited to the number of observed stars in each cell (, where NI represents rounding off to the nearest integer). The global effect is quantified by means of the difference between the expected number of field stars in each cell () and the actual number of subtracted stars (). Summed over all cells, this quantity provides an estimate of the total subtraction efficiency of the process,
Ideally, the best results would be obtained for an efficiency . The adopted grid settings produced subtraction efficiencies higher than 93% in all cases.
Table 3 presents the full statistics of the decontamination of FSR 942, FSR 855, and FSR 801. The parameters discussed above are presented in magnitude bins and for the full CMD magnitude range, which allows verification of dependences with magnitude. For the remaining cases only the integrated statistics is given in Table 4. The decontaminated CMDs are shown in the bottom panels of Figs. 2 - 5, and in Fig. 6.
Based on the decontaminated CMDs and the RDP properties (Sect. 4), the objects can be grouped into three different classes, (i) confirmed OCs (with 15 objects), (ii) uncertain cases (6), and (iii) possible field fluctuations (7). Table 4 is arranged according to these classes. As expected, the integrated parameter of the confirmed OCs is higher than 3.0, in some cases reaching . The uncertain cases and the possible field fluctuations have lower values, around 3.
Besides the 7 previously known and the 2 recently identified OCs (Table 2), 6 new ones show up in this work: FSR 756, FSR 923, FSR 932, FSR 942, FSR 948, and FSR 974.
3.4 Fundamental parameters
Fundamental parameters are derived for the cases where a significant probability of a star cluster occurs. To this purpose we fit the decontaminated CMDs with solar-metallicity Padova isochrones (Girardi et al. 2002) computed with the 2MASS , and filters444stev.oapd.inaf.it/lgirardi/cgi-bin/cmd . The 2MASS transmission filters produced isochrones very similar to the Johnson-Kron-Cousins (e.g. Bessel & Brett 1988) ones, with differences of at most 0.01 in (Bonatto, Bica & Girardi 2004).
The isochrone fit gives the age and the reddening , which converts to and through the transformations , , , and (Dutra, Santiago & Bica 2002), for a constant total-to-selective absorption ratio . These ratios were derived from the extinction curve of Cardelli, Clayton & Mathis (1989). We also compute the distance from the Sun () and the Galactocentric distance (), based on the recently derived value of the Sun’s distance to the Galactic centre kpc derived with updated parameters of Globular clusters (Bica et al. 2006). Age, , and are given in cols. 4 to 7 of Table 5, respectively. The isochrone fits to the probable star clusters are shown in the bottom panels of Figs. 2 to 5.
| Target | Age | ||||||||
|---|---|---|---|---|---|---|---|---|---|
| (hms) | () | (Myr) | (mag) | (kpc) | (kpc) | (kpc) | (kpc) | (kpc) | |
| (1) | (2) | (3) | (4) | (5) | (6) | (7) | (8) | (9) | (10) |
| Confirmed star clusters | |||||||||
| Be 23 | 06:33:16.2 | 20:31:08.0 | |||||||
| Be 69 | 05:24:21.6 | 32:36:3.2 | |||||||
| Be 71 | () | () | |||||||
| Cz 23 | () | () | |||||||
| NGC 1798 | () | () | |||||||
| NGC 1883 | () | () | |||||||
| NGC 2126 | 06:02:34.6 | 49:51:36.0 | |||||||
| FSR 756 | 04:24:13.4 | 29:42:14.4 | |||||||
| FSR 814 | 05:36:46.1 | 31:11:45.6 | |||||||
| FSR 869 | 06:10:01.9 | 24:32:54.6 | |||||||
| FSR 923 | () | () | |||||||
| FSR 932 | 06:04:26.4 | 14:33:20.2 | |||||||
| FSR 942 | () | () | |||||||
| FSR 948 | 06:25:52.8 | 15:50:15.0 | |||||||
| FSR 974 | 06:32:41.3 | 12:31:55.2 | |||||||
| Uncertain cases: deeper photometry necessary | |||||||||
| FSR 773 | 04:29:37.0 | 26:00:14.0 | |||||||
| FSR 851 | 05:14:44.9 | 19:47:31.2 | |||||||
| FSR 855 | 05:42:21.6 | 22:49:48.0 | |||||||
| FSR 882 | 05:27:51.1 | 16:53:49.2 | |||||||
| FSR 884 | () | () | |||||||
| Possible field fluctuations | |||||||||
| FSR 744 | () | () | |||||||
| FSR 776 | 06:07:24.0 | 39:49:33.6 | |||||||
| FSR 801 | 04:47:04.8 | 24:54:00.0 | |||||||
| FSR 841 | 05:06:13.4 | 21:33:27.0 | |||||||
| FSR 894 | () | () | |||||||
| FSR 927 | () | () | |||||||
| FSR 956 | () | () | |||||||
-
Cols. 2 and 3: Optimised central coordinates (Sect. 3.1); indicates same central coordinates as in Froebrich, Scholz & Raftery (2007). Col. 4: Age, from 2MASS data. Col. 5: . Col. 6: Distance from the Sun. Col. 7: calculated with kpc (Bica et al. 2006) as the distance of the Sun to the Galactic centre. Cols. 8-10: Positional components with respect to the Galactic plane.
4 Stellar radial density profiles
Before building the RDPs, we isolate the most probable cluster sequences with the colour-magnitude filters, which exclude the stars with colours different from those of the assumed cluster sequence. Colour-magnitude filter widths are wide enough to include MS and evolved star distributions, and the respective photometric uncertainties. They should also account for formation or dynamical evolution-related effects, such as enhanced fractions of binaries (and other multiple systems) towards the central parts of clusters, since such systems tend to widen the MS (e.g. Hurley & Tout 1998; Kerber et al. 2002; Bonatto & Bica 2007b; Bonatto, Bica & Santos Jr. 2005). The filters for the present OCs are shown in the bottom panels of Figs. 2 to 5. The contribution of residual field stars, with similar colours to those of the cluster, to the RDPs is statistically quantified by means of comparison with the field. In practical terms, the use of colour-magnitude filters in cluster sequences enhances the contrast of the RDP with respect to the background (e.g. Bonatto & Bica 2007b). The corresponding radial profiles of the 16 open clusters are given in Figs. 7 and 8.
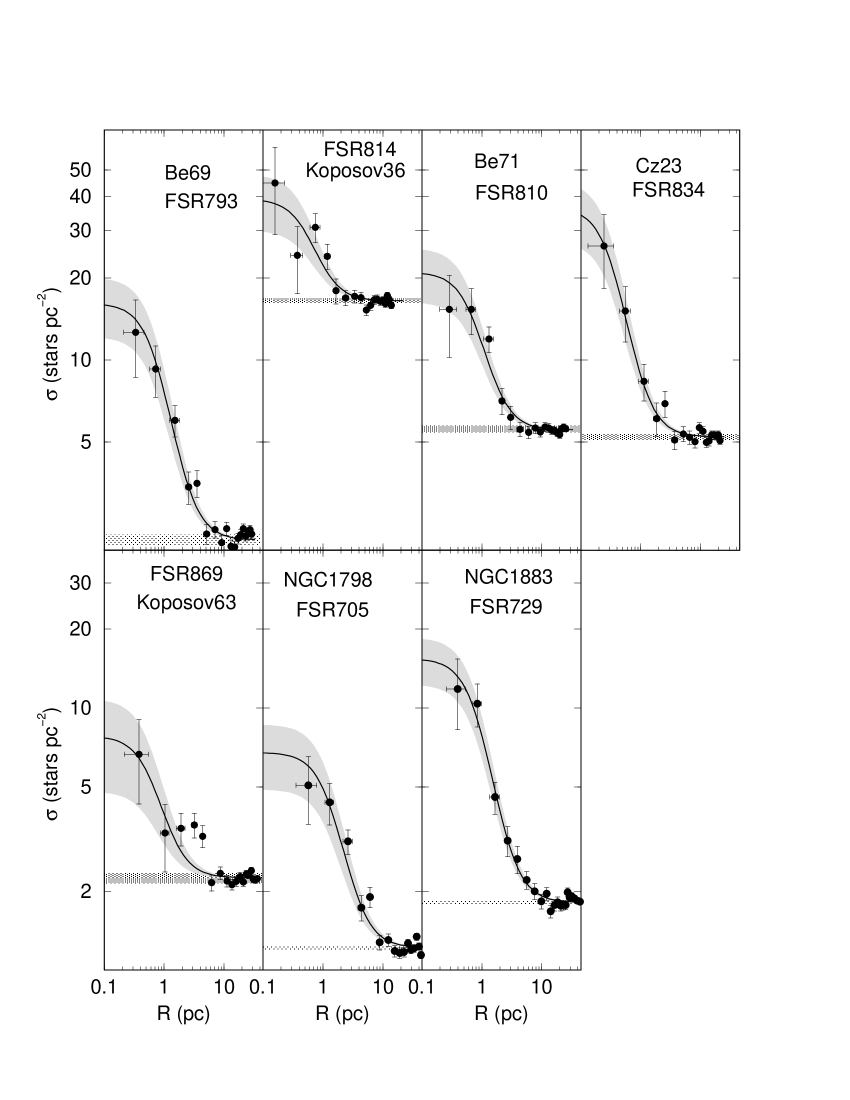
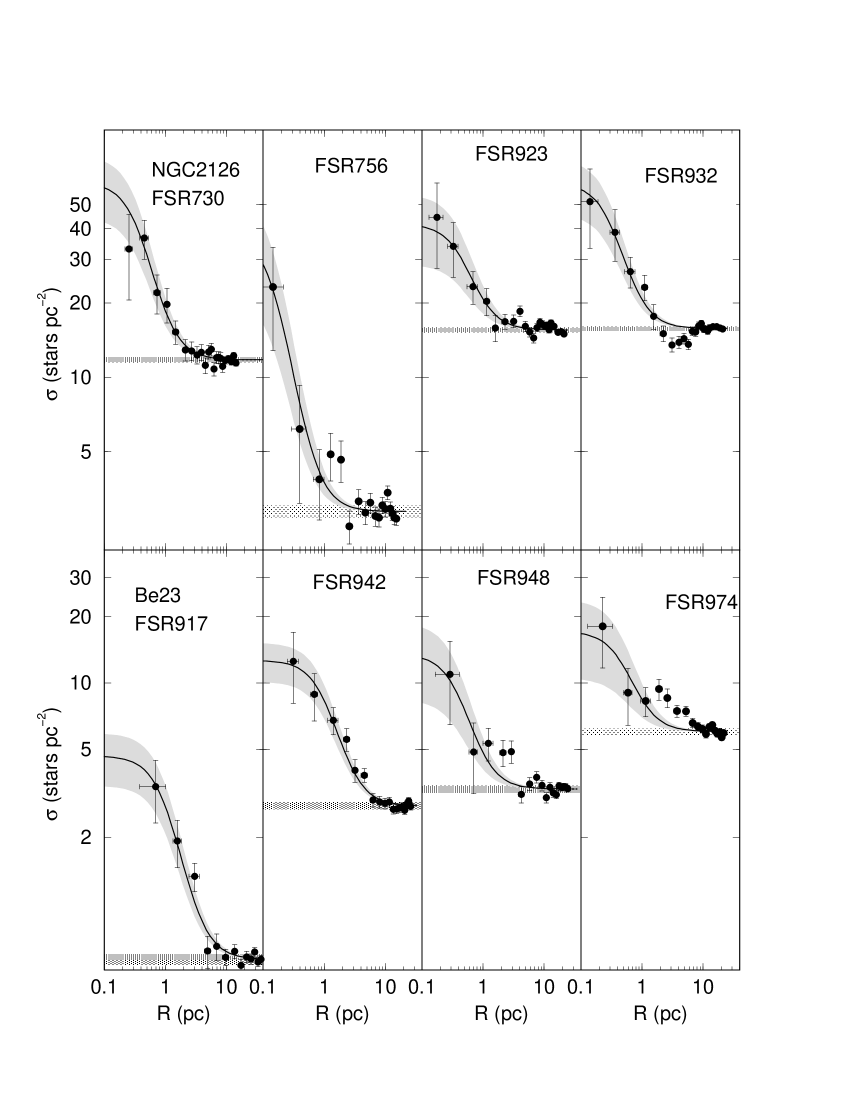

Star clusters, in general, have RDPs that can be described by a well-defined analytical profile, characterised by parameters that are related to cluster structure. The most often used are the single-mass, modified isothermal sphere of King (1966), the modified isothermal sphere of Wilson (1975), and the power-law with a core of Elson, Fall & Freeman (1987). Because of the significant error bars (Figs. 7 and 8), we use the analytical profile , where is the residual background density, is the central density of stars, and is the core radius. This function is similar to that by King (1962) to describe the surface brightness profiles in the central parts of globular clusters. and the core radius () are derived from the RDP fit, while is measured in the respective comparison field. Because of the 2MASS photometric depth, which in most cases corresponds to a cutoff for stars brighter than , should be taken as a lower limit to the actual central number-density.
Fit parameters are given in Table 6, and the best-fit solutions are superimposed on the colour-magnitude filtered RDPs (Figs. 7 and 8). As expected, the adopted King-like function describes well the above RDPs over the full radial range, within uncertainties. Table 6 also gives the density contrast parameter , which is related to the difficulty of cluster detection against the background, and the RDP radius , which corresponds to the distance from the cluster centre where RDP and background become statistically indistinguishable. Although most of the cluster stars are contained within , it is smaller than the tidal radius. For instance, in populous and relatively high Galactic latitude OCs such as M 67, NGC 188, and NGC 2477, the RDP radii are a factor of the respective tidal radii (Bonatto & Bica 2005).
| RDP | ||||||||
| Cluster | ||||||||
| (pc) | (pc) | (pc) | (′) | (′) | ||||
| (1) | (2) | (3) | (4) | (5) | (6) | (7) | (8) | (9) |
| Be 23 | 1.931 | |||||||
| Be 69 | 1.000 | |||||||
| Be 71 | 0.862 | |||||||
| Cz 23 | 0.728 | |||||||
| NGC 1798 | 1.731 | |||||||
| NGC 1883 | 1.083 | |||||||
| NGC 2126 | 0.298 | |||||||
| FSR 756 | 0.521 | |||||||
| FSR 814 | 0.475 | |||||||
| FSR 869 | 1.232 | |||||||
| FSR 923 | 0.447 | |||||||
| FSR 932 | 0.444 | |||||||
| FSR 942 | 0.900 | |||||||
| FSR 948 | 0.831 | |||||||
| FSR 974 | 0.748 | |||||||
-
: FSR 1644; : FSR 1723. Col. 2: arcmin to parsec scale. To minimise degrees of freedom in RDP fits with the King-like profile (see text), was kept fixed (measured in the respective comparison fields) while and were allowed to vary. Col. 5: cluster/background density contrast (), measured in colour-magnitude filtered RDPs.
The empirical determination of a cluster RDP radius depends on the relative levels of RDP and background (and respective fluctuations). Thus, dynamical evolution may indirectly affect the measurement of the RDP radius. This occurs because mass segregation drives preferentially low-mass stars to the outer parts of clusters, which tends to lower the cluster/background contrast in these regions as clusters age. As an observational consequence, lower values of the RDP radii are expected to be measured, especially for clusters projected against dense fields. However, simulations (Bonatto & Bica 2007b) of OCs with the structure described by a King-like profile, and projected against different backgrounds, show that, provided not exceedingly high, background levels may produce RDP radii underestimated by about 10–20% with respect to the intrinsic values. The core radius, on the other hand, is almost insensitive to background levels (Bonatto & Bica 2007b). This occurs because is derived from fitting the King-like profile to a distribution of RDP points, which minimises background effects.
The RDPs of the cases with uncertain CMD morphology and the possible field fluctuations are shown in Fig. 9. A narrow excess in the stellar RDPs near the centre is present in all cases, but they are quite different from a King-like profile, especially for the possible field fluctuations.
5 Discussion
Evidence gathered from the photometric (Sect. 3.2) and stellar radial distribution (Sect. 4) analyses indicate that, besides the 9 previously known OCs, 6 are newly identified ones, 6 are uncertain cases, while 7 are possible field fluctuations.
5.1 Open clusters
This group contains Be 69, Be 71, FSR 814, Cz 23, FSR 869, NGC 1798, NGC 1883, NGC 2126, Be 23, FSR 756, FSR 923, FSR 932, FSR 942, FSR 948, and FSR 974. They have well-defined decontaminated CMD sequences (Figs. 2 - 5), relatively high values of the parameter (both in magnitude bins - Table 3, and the integrated one - Table 4), as well as King-like RDPs (Figs. 7 and 8). Astrophysical parameters (age, distance, reddening, core and RDP radii) could be measured for these clusters. The average value of is .
5.2 Uncertain cases
In general, objects of the second group have less-defined decontaminated CMD sequences (Fig. 6) than those in the first group, which is consistent with the lower-level of the integrated , whose average is . The objects are FSR 773, FSR 851, FSR 855, FSR 882, FSR 884, and FSR 911. The 2MASS CMD sequences of this group cannot be used to unambiguously classify them as star clusters. However, the relatively broad RDPs, with a high central surface density (Fig. 9), are rather similar to the RDPs of typical star clusters (e.g. Figs. 7 and 8).
Although the decontaminated CMDs and RDPs taken together might suggest star clusters of different ages, deeper observations are required to probe the existence of the TO and MS. Deeper photometry is essential in most cases, especially for old and/or distant OCs for which the TO is close to the 2MASS limiting magnitude.
With respect to FSR 911, in Bica, Bonatto & Dutra (2008) we concluded that it is not the same objects as Bochum 1, but rather an uncertain object, since there are other small-scale stellar concentrations in the area.
5.3 Possible field fluctuations
Decontaminated CMDs of this group (Fig. 6) have -values significantly lower than those of the star clusters (Sect. 5.1) but of the same order as the uncertain cases (Sect. 5.2), with . The fact that they have is consistent with the method employed by Froebrich, Scholz & Raftery (2007) to detect overdensities. However, in most cases the RDP excess is very narrow and irregular, restricted to the first bins, quite different from a King-like profile (e.g. Fig. 6). In this group are FSR 744, FSR 776, FSR 801, FSR 841, FSR 894, FSR 927, and FSR 956.
Objects in this group have essentially featureless CMDs, and RDPs with important deviations from cluster-like profiles. They appear to be fluctuations of the stellar field over which they are projected. Deep observations are also important to further probe the nature of these overdensities.
5.4 Comparison with previous studies
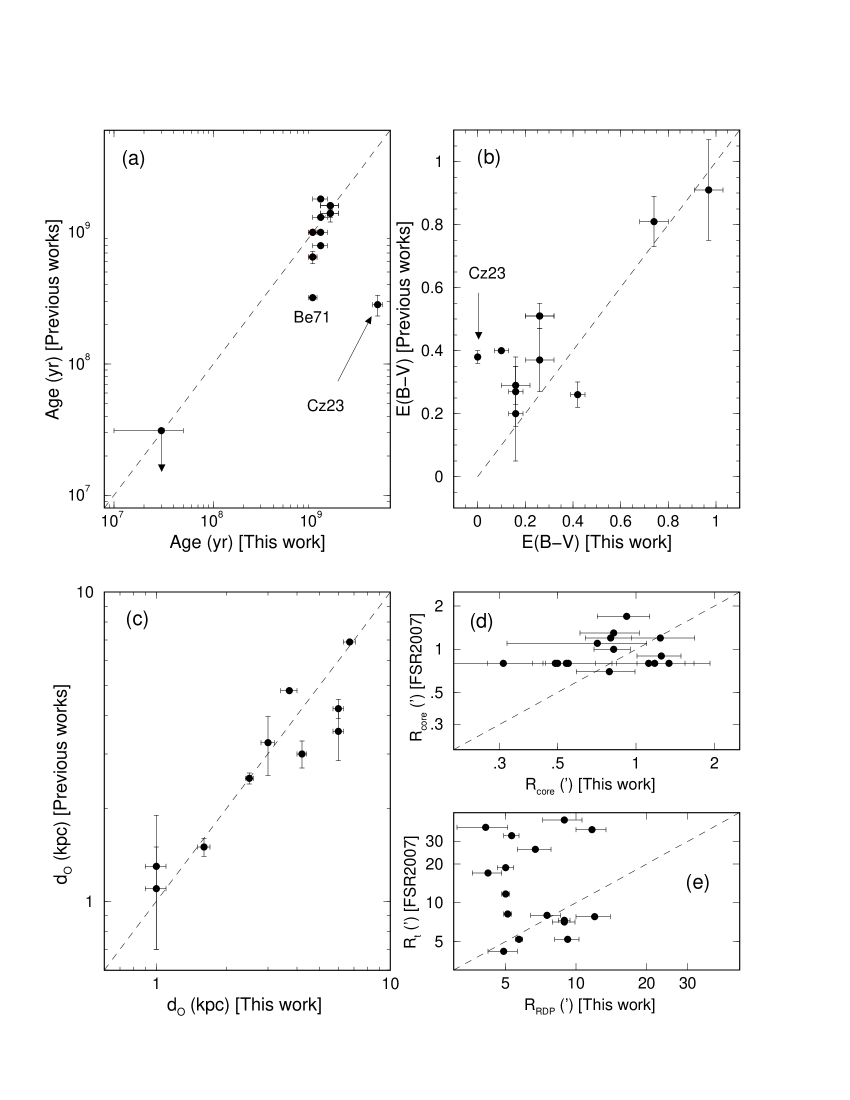
In Fig. 10 we compare parameters derived in this work for the confirmed OCs with those found in studies of other authors (see the references given in Sect. 2 for details on literature parameters of each OC). All the available data are used in the comparisons but, since some parameters have similar values in different works, the near-coincidences cannot be individually distinguished in Fig. 10. The upper limit on the age of FSR 814 (Glushkova et al. 2007) is shown by an arrow. Parameters of Cz 23 were derived by us in Bonatto & Bica (2008) with 2MASS photometry and the same methods as in the present paper, and these are taken for comparison with other works. Age (panel a), reddening (b), and distance from the Sun (c) present a good agreement, except for the age and reddening of Cz 23. We note that the differences in Cz 23 parameters with respect to Glushkova et al. (2007) arise from the fact that their photometry is not decontaminated, which is essential for this object (as discussed in Bonatto & Bica 2008).
Finally, in panels (d) and (e) we compare the present values of the core and RDP radii with those in Froebrich, Scholz & Raftery (2007)555Actually, Froebrich, Scholz & Raftery (2007) present core and tidal radii which, in populous clusters is a factor larger than the RDP radii (Bonatto & Bica 2005).. Most of the lack of correlation can be explained by the very different surface-density distributions that follow from the observed and decontaminated photometries (e.g. Fig. 1). Decontaminated surface densities, in general, enhance the central overdensity with respect to the surroundings, especially for OCs. Thus, King profile fits to decontaminated data should produce smaller radii, as compared to the observed photometry. However, we note that part of the discrepancy can be accounted for by the different fit methods employed to derive the structural parameters. While we work with the 2-parameter King profile (Sect. 4), which essentially describes the central parts of clusters, Froebrich, Scholz & Raftery (2007) use the complete 3-parameter law (King 1966) to derive the core and tidal radii.
5.5 Relations among astrophysical parameters
Diagrams with astrophysical parameters that can be used to investigate properties of OCs in different environments have been presented in Bonatto & Bica (2005). In this work we use them to investigate dependences of core and RDP radii on cluster age and Galactocentric distance (Fig. 11). As reference we use (i) a sample of bright nearby OCs (Bonatto & Bica 2005), including the two young ones NGC 6611 (Bonatto, Santos Jr. & Bica 2006) and NGC 4755 (Bonatto et al. 2006b), (ii) OCs projected against the central parts of the Galaxy (Bonatto & Bica 2007b), and (iii) the recently identified OCs FSR 1744, FSR 89 and FSR 31 (Bonatto & Bica 2007a), which are also projected against the central parts of the Galaxy. OCs in sample (i) have ages in the range and Galactocentric distances within . NGC 6611 has Myr and kpc, and NGC 4755 has Myr and kpc. Sample (ii) OCs are characterised by and . FSR 1744, FSR 89 and FSR 31 are Gyr-class OCs at .
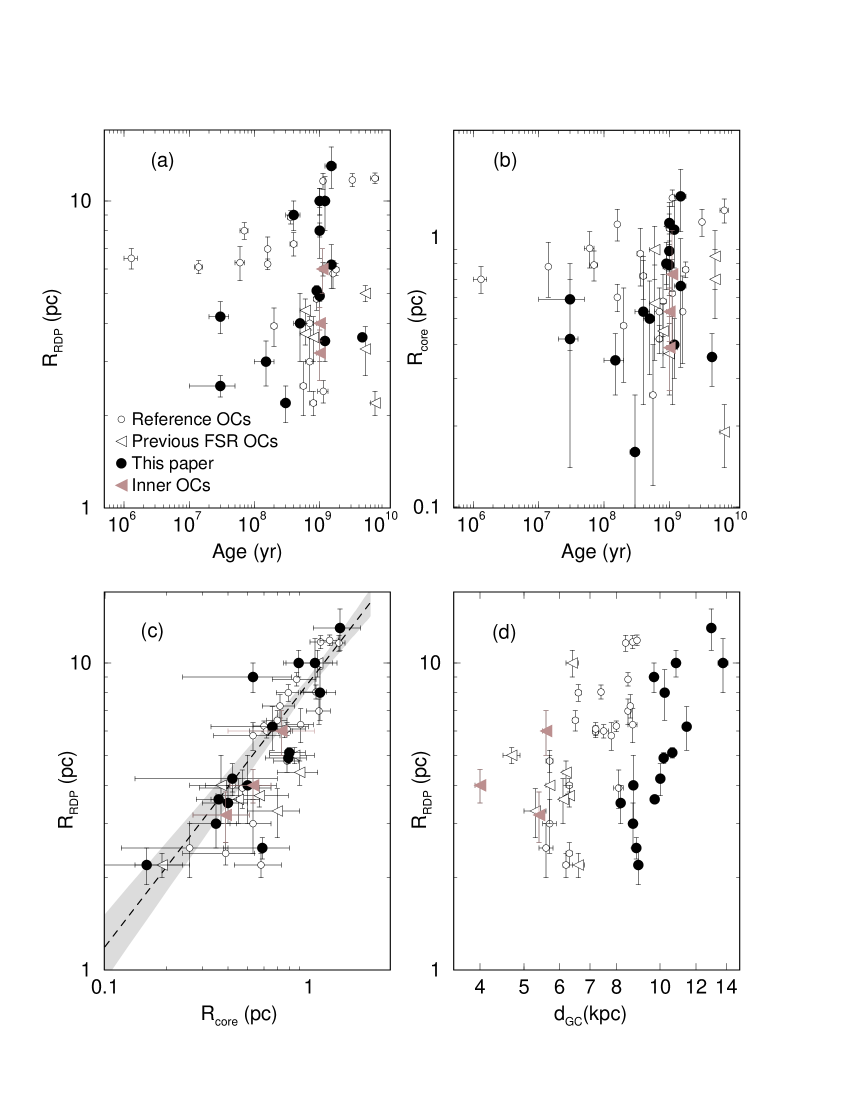
The dependence of RDP and core radii on cluster age, which is intimately related to cluster survival/dissociation rates, is examined in panels (a) and (b), respectively. Most of the present FSR OCs appear to have both kinds of radii smaller than those of OCs of similar age. Besides, an accumulation of small-radii (especially RDP radius) OCs appears to occur at Gyr, the typical time-scale of OC disruption processes near the Solar circle (e.g. Bergond, Leon & Guilbert 2001; Lamers et al. 2005).
For most of the OCs in samples (i) and (ii), the core and RDP radii follow the relation (panel c), which implies a similar scaling in both kinds of radii, in the sense that on average, larger clusters tend to have larger cores, at least for and . Similar relations between core and RDP radii were also found by Nilakshi, Pandey & Mohan (2002), Sharma et al. (2006), and Maciejewski & Niedzielski (2007).
A first-order dependence of OC size on Galactocentric distance is suggested by panel (d), as previously discussed by Lyngå (1982) and Tadross et al. (2002). The approximately linear relation between core and RDP radii (panel c) implies a similar dependence of with . Part of this relation may be primordial, in the sense that the higher density of molecular gas in central Galactic regions may have produced clusters with smaller core radii, as suggested by van den Bergh, Morbey & Pazder (1991) to explain the increase of GC radii with Galactocentric distance. In addition, there is the possibility that the core size may also be a function of the binary fraction and its evolution with age, so that loss of stars may not be the only process to determine sizes. The present FSR OCs also follow the trend of increasing RDP radii with Galactocentric distance, but in most cases the values are lower than those of OCs at similar , especially for kpc.
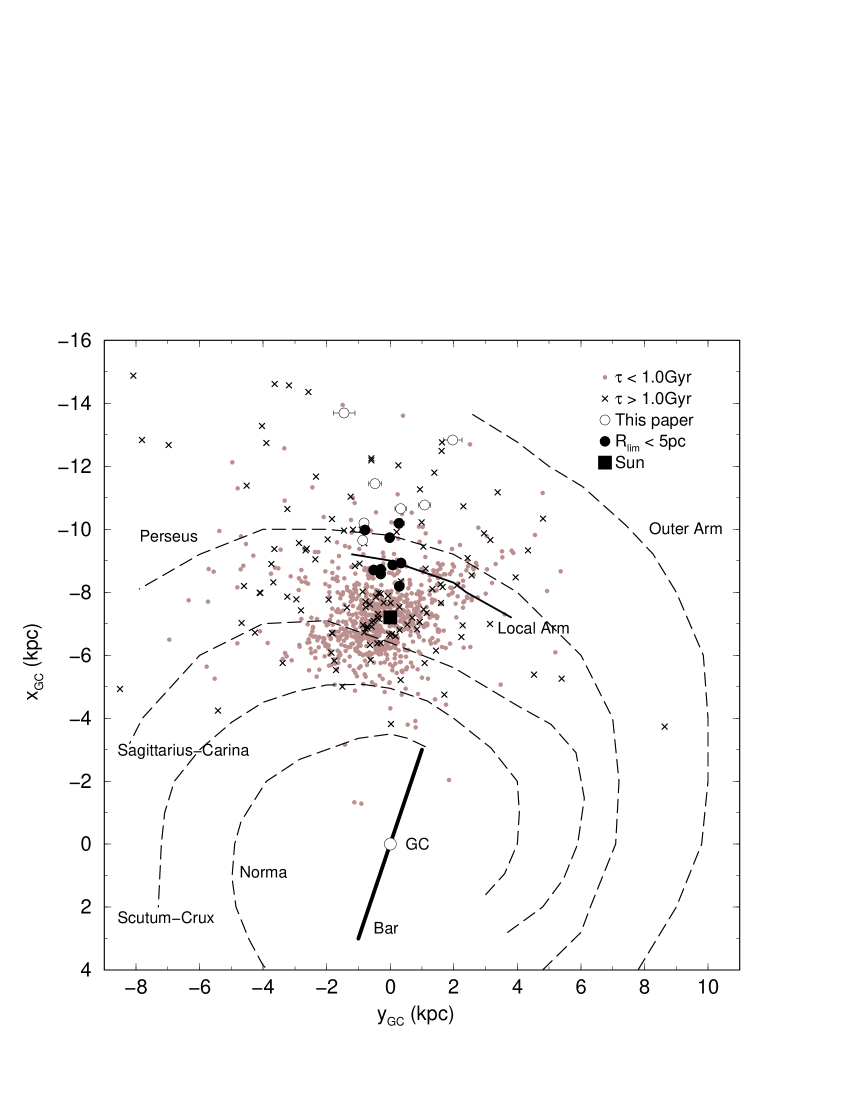
Finally, in Fig. 12 we show the spatial distribution in the Galactic plane of the present FSR OCs, compared to that of the OCs in the WEBDA database. For comparison purposes we consider two age groups, clusters younger and older than 1 Gyr. As expected, old OCs are found preferentially outside the Solar circle, and the inner Galaxy contains few OCs so far detected.
The spiral arm structure of the Milky Way (Fig. 12) is based on Momany et al. (2006) and Drimmel & Spergel (2001), as derived from H II regions, and molecular clouds (see e.g. Russeil 2003). The Galactic bar is shown with an orientation of and 3 kpc in length (Freudenreich 1998; Vallée 2005).
Despite the fact that the FSR OCs of the present sample are located outside the Solar circle, some of them appear to present small core and RDP radii (Fig. 11), as compared to OCs at similar Galactocentric distances, which might suggest significant dynamical evolution. This may be consistent with tidal stresses more important than previously assumed. Based on the distribution of with respect to (panel d of Fig. 11), we take pc as a representative value for the upper limit of the RDP radius of the smaller OCs outside the Solar circle. We point out that the spatial distribution of the FSR OCs (Fig. 12) suggests that such small OCs have interacted with the Perseus and Local arms, especially by means of encounters with giant molecular clouds. Molecular clouds more massive than are found in the Solar neighbourhood (e.g. Solomon et al. 1987). Collision with such structures is another potential mechanism to decrease cluster mass, especially for low-mass clusters (e.g. Wielen 1971; Wielen 1991; Gieles et al. 2006; Gieles, Athanassoula & Portegies Zwart 2007).
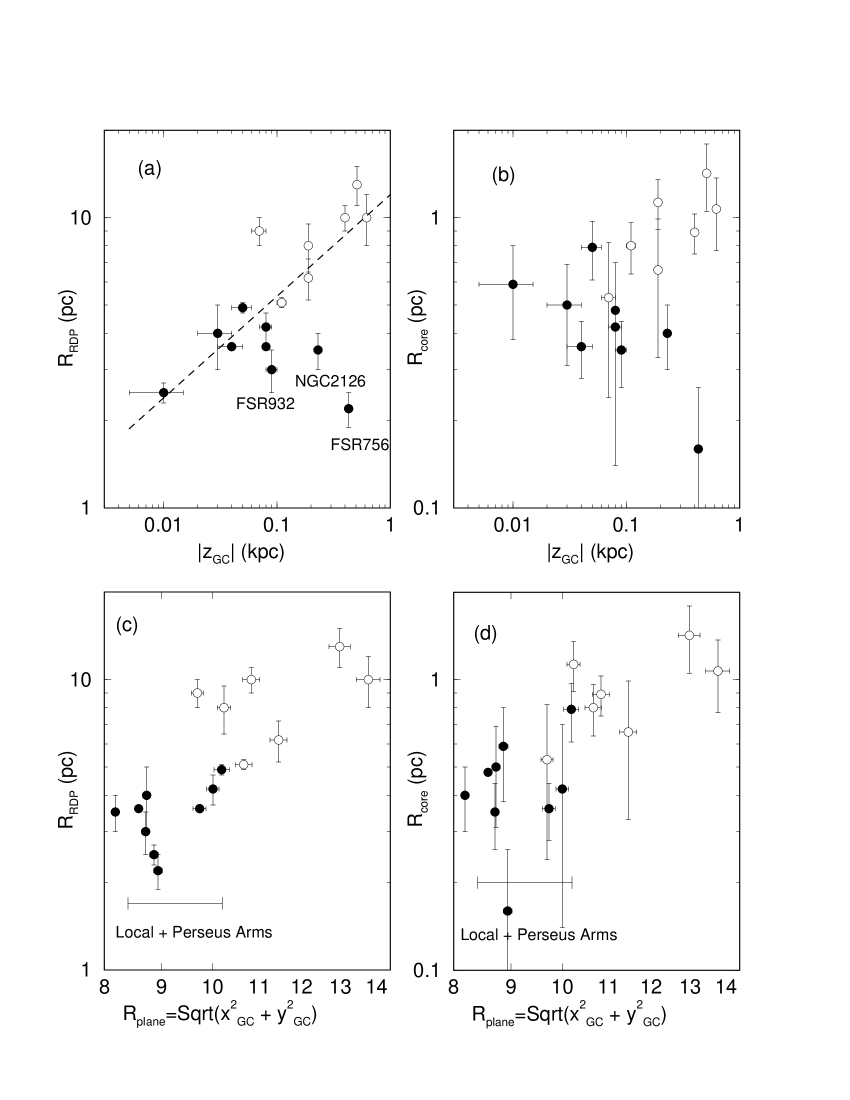
This point can be further investigated by examining the dependence of the core and RDP radii with cluster position in the Galaxy (Fig. 13). With respect to the vertical distance to the Galactic plane , the present FSR OCs are distributed up to kpc (Table 5). When plotted as a function of distance to the Galactic plane, the RDP radii present a general trend of increase with (panel a). The exceptions are FSR 756, FSR 932, and NGC 2126. These OCs excluded, the distribution of the remaining objects follows relatively tightly the power-law . Such a relation is consistent with a lower-frequency of encounters with giant molecular clouds, and with the disk, for OCs at high with respect to those orbiting closer to the plane. Although with more scatter, the core radii distribution (panel b) is similar to that of the RDP radii, which again suggests dynamical effects. A similar dependence of OC radius with was observed by Tadross et al. (2002), who also noted that, in the Solar neighbourhood, OCs with radius smaller than 5 pc are found preferentially close to the plane. We remark that part of this effect can be accounted for by the dependence of completeness on (Bonatto et al. 2006a). Since the average backgroundforeground contamination decreases for high , the external parts of an OC (i.e. with intrinsically low surface brightness) can be detected for a larger distance than for a low- objects.
As shown in panels (c) and (d), when the on-plane distance is considered, a trend of increasing radii with occurs, similarly to the relation of with (Fig. 11). However, there appears to occur a gap around the region corresponding to the Local and Perseus arms. Besides, the position of the FSR OCs with pc roughly coincides with the inter-arm region (Figs. 12 and 13).
As a caveat we note that the above arguments are based on a relatively small number of OCs.
6 Concluding remarks
The identification and derivation of astrophysical parameters of new star clusters in the Galaxy provide valuable inputs and constraints to studies of star formation and evolutionary processes, dynamics of N-body systems, cluster disruption time scales, the geometry of the Galaxy, among others.
For this work we selected all star cluster candidates projected nearly towards the anti-centre ( and ), from the catalogue of Froebrich, Scholz & Raftery (2007). Identified as stellar overdensities by Froebrich, Scholz & Raftery (2007), the candidates were classified by them as probable and possible star clusters, with quality flag ’0’ or ’1’. The 28 such candidates were analysed by means of 2MASS field-star decontaminated colour-magnitude diagrams, colour-magnitude filters, and stellar radial density profiles.
Of the 28 candidates, 15 have cluster-like CMD morphologies and King-like RDPs. Among these are the previously catalogued open clusters NGC 1798, NGC 1883, NGC 2126, Be 23, Be 69, Be 71, and Cz 23, and 2 that have been recently identified as OCs by Glushkova et al. (2007) in a similar search for stellar overdensities (FSR 814 and FSR 869). In this paper, the remaining 6 candidates are shown to be OCs, and their properties are investigated. These star clusters have ages in the range Myr to Gyr, distances from the Sun within , and Galactocentric distances within . Six other candidates have CMDs and/or RDPs that suggest star clusters of different ages, but deeper photometry is required to establish their nature. The remaining 7 overdensities are probably fluctuations of the stellar field.
From the above numbers we estimate that the fraction of FSR anti-centre overdensities that turn out to be star clusters () can be put in the range . The lower limit agrees with the estimated by Froebrich, Scholz & Raftery (2007) for all directions. Considering the anti-centre solid angle sampled in this paper, and the newly identified OCs (Sect. 5.1), the density of these OCs is . Similar arguments applied to a central direction (e.g. Bica, Bonatto & Camargo 2007) yields a density . Thus, the density of new OCs in the anti-centre is a factor of higher than towards the centre. This is probably associated to the high level of the Galactic stellar field in central directions. Significant statistical fluctuations are expected to occur in such fields, in scales similar to those produced by star clusters (e.g. Bica, Bonatto & Camargo 2007).
WEBDA contains 75 OCs with known age and distance from the sun located in the same sector as that probed in this work. Thus, the accurate parameters derived here represent an increase of to the database.
A considerable fraction of the FSR OCs studied here are located close to the Local and Perseus Arms. These OCs appear to be abnormally small, which probably can be accounted for by mass-loss due to dynamical interaction with giant molecular clouds and the spiral arms.
Catalogues of star cluster candidates, coupled with field-star decontamination and stellar radial profiles, have become a powerful tool to detect and derive astrophysical parameters of new star clusters in the Galaxy. A consequence of this kind of study will be a better definition of the OC parameter space, with reflexes on the understanding of the star-formation rate, star-cluster dynamical evolution, and Galaxy evolution and structure.
Acknowledgements
We thank the anonymous referee for suggestions. This publication makes use of data products from the Two Micron All Sky Survey, which is a joint project of the University of Massachusetts and the Infrared Processing and Analysis Center/California Institute of Technology, funded by the National Aeronautics and Space Administration and the National Science Foundation. This research has made use of the WEBDA database, operated at the Institute for Astronomy of the University of Vienna. We acknowledge partial support from CNPq (Brazil).
References
- Alter, Ruprecht & Vanysek (1970) Alter, G., Ruprecht, J. & Vanysek, V. 1970, in Catalogue of star clusters and associations and Suppl., 2nd Ed., Akad. Kiado, Budapest, edited by G. Alter, B. Balazs & J. Ruprecht
- Ann et al. (2002) Ann, H.B., Lee, S.H., Sung, H., Lee, M.G., Kim, S.-L., Chun, M.-Y., Jeon, Y.-B., Park, B.-G.& Yuk, I.-S. 2002, AJ, 123, 905
- Baumgardt & Makino (2003) Baumgardt, H. & Makino, J. 2003, MNRAS, 340, 227
- van den Bergh (1957) van den Bergh, S. 1957, ApJ, 125, 445
- van den Bergh & McClure (1980) van den Bergh, S. & McLure, R.D. 1980, A&A, 88, 360
- van den Bergh, Morbey & Pazder (1991) van den Bergh, S., Morbey, C. & Pazder, J. 1991, ApJ, 375, 594
- Bergond, Leon & Guilbert (2001) Bergond, G., Leon, S. & Guilbert, J. 2001, A&A, 377, 462
- Bessel & Brett (1988) Bessel, M.S. & Brett, J.M. 1988, PASP, 100, 1134
- Bica et al. (2006) Bica, E., Bonatto, C., Barbuy, B. & Ortolani, S. 2006, A&A, 450, 105
- Bica et al. (2007) Bica, E., Bonatto, C., Ortolani, S. & Barbuy, B. 2007, A&A, 472, 483
- Bica, Bonatto & Camargo (2007) Bica, E., Bonatto, C. & Camargo, D.. 2007, MNRAS, 385, 349
- Bica & Bonatto (2008) Bica, E. & Bonatto, C. 2008, MNRAS, 384, 1733
- Bica, Bonatto & Dutra (2008) Bica, E., Bonatto, C. & Dutra, C.M. 2008, MNRAS, submitted
- Bonatto, Bica & Girardi (2004) Bonatto, C., Bica, E. & Girardi, L. 2004, A&A, 415, 571
- Bonatto, Bica & Santos Jr. (2005) Bonatto, C., Bica, E. & Santos Jr., J.F.C. 2005, A&A, 433, 917
- Bonatto & Bica (2005) Bonatto, C. & Bica, E. 2005, A&A, 437, 483
- Bonatto, Santos Jr. & Bica (2006) Bonatto, C., Santos Jr., J.F.C. & Bica, E. 2006, A&A, 445, 567
- Bonatto et al. (2006a) Bonatto, C., Kerber, L.O., Bica, E. & Santiago, B.X. 2006a, A&A, 446, 121
- Bonatto et al. (2006b) Bonatto, C., Bica, E., Ortolani, S. & Barbuy, B. 2006b, A&A, 453, 121
- Bonatto & Bica (2007a) Bonatto, C. & Bica, E. 2007a, A&A, 473, 445
- Bonatto & Bica (2007b) Bonatto, C. & Bica, E. 2007b, MNRAS, 377, 1301
- Bonatto et al. (2007) Bonatto, C., Bica, E., Ortolani, S. & Barbuy, B. 2007, MNRAS, 381, L45
- Bonatto & Bica (2008) Bonatto, C. & Bica, E. 2008, MNRAS, submitted
- Cardelli, Clayton & Mathis (1989) Cardelli, J.A., Clayton, G.C. & Mathis, J.S. 1989, ApJ, 345, 245
- Carraro, Baume & Villanova (2003) Carraro, G., Baume, G. & Villanova, S. 2003, MNRAS, 343, 547
- Drimmel & Spergel (2001) Drimmel, R., & Spergel, D.N. 2001, ApJ, 556, 181
- Durgapal & Pandey (2001) Durgapal, A.K. & Pandey A.K. 2001, A&A, 375, 840
- Dutra, Santiago & Bica (2002) Dutra, C.M., Santiago, B.X. & Bica, E. 2002, A&A, 383, 219
- Elson, Fall & Freeman (1987) Elson, R.A.W., Fall, S.M. & Freeman, K.C. 1987, ApJ, 323, 54
- Freudenreich (1998) Freudenreich, H.T. 1998, ApJ, 492, 495
- Friel (1995) Friel, E.D., 1995, ARA&A 1995, 33, 381
- Froebrich, Scholz & Raftery (2007) Froebrich, D., Scholz, A. & Raftery, C.L. 2007, MNRAS, 374, 399
- Froebrich, Meusinger & Scholz (2007) Froebrich, D., Meusinger, H. & Scholz, A. 2007, MNRAS, 377, L54
- Froebrich, Meusinger & Davis (2007) Froebrich, D., Meusinger, H. & Davis, C.J. 2007, MNRAS, 383, L45
- Gaspar et al. (2003) Gaspar, A., Kiss, L.L., Bedding, T.R., Derekas, A., Kaspi, S., Kiss, Cs., Sarneczky, K., Szabo, Gy.M. & Varadi, M. 2003, A&A, 410, 879
- Gieles, Athanassoula & Portegies Zwart (2007) Gieles, M., Athanassoula, E. & Portegies Zwart, S.F. 2007, MNRAS, 376, 809
- Gieles et al. (2006) Gieles, M., Portegies Zwart, S.F., Baumgardt, H., Athanassoula, E., Lamers, H.J.G.L.M. Sipior, M. & Leenaarts, J. 2006, MNRAS, 371, 793
- Girardi et al. (2002) Girardi, L., Bertelli, G., Bressan, A., Chiosi, C., Groenewegen, M.A.T., Marigo, P., Salasnich, B. & Weiss, A. 2002, A&A, 391, 195
- Glushkova et al. (2007) Glushkova, E.V., Koposov, S.E. & Zolotukhin, I.Yu. 2007, A&A, in press, (astro-ph/0709.1275)
- Goodwin & Bastian (2006) Goodwin, S.P. & Bastian, N. 2006, MNRAS, 373, 752
- Hasegawa et al. (2004) Hasegawa, T., Malasan, H.L., Kawakita, H., Obayashi, H., Kurabayashi, T., Nakai, T., Hyakkai, M. & Arimoto N. 2004, PASJ, 56, 295
- von Hoerner (1958) von Hoerner, S. 1958, Z.Astrophys., 44, 221
- Hurley & Tout (1998) Hurley, J. & Tout, A.A. 1998, MNRAS, 300, 977
- Kerber et al. (2002) Kerber, L.O., Santiago, B.X., Castro, R. & Valls-Gabaud, D. 2002, A&A, 390, 121
- Khalisi, Amaro-Seoane & Spurzem (2007) Khalisi, E., Amaro-Seoane, P. & Spurzem, R. 2007, MNRAS, 374, 703
- Kharchenko et al. (2005) Kharchenko, N.V., Piskunov, A.E., Röser, S., Schilbach, E. & Scholz, R.-D. 2005, A&A, 438, 1163
- King (1962) King, I. 1962, AJ, 67, 471
- King (1966) King, I. 1966, AJ, 71, 64
- Lamers et al. (2005) Lamers, H.J.G.L.M., Gieles, M., Bastian, N., Baumgardt, H., Kharchenko, N.V. & Portegies Zwart, S. 2005, A&A, 441, 117
- Lamers & Gieles (2006) Lamers, H.J.G.L.M. & Gieles, M. 2006, A&A, 455, L17
- Lata et al. (2002) Lata, S., Pandey, A.K., Sagar, R. & Mohan, V. 2002, A&A, 388, 158
- Lata, Mohan & Sagar (2004) Lata, S., Mohan, V. & Sagar, R. 2004, BASI, 32, 371
- Lyngå (1982) Lyngå, G. 1982, A&A, 109, 213
- Maciejewski & Niedzielski (2007) Maciejewski, G. & Niedzielski, A. 2007, A&A, 467, 1065
- Mermilliod & Paunzen (2003) Mermilliod, J.C. & Paunzen, E. 2003, A&A, 410, 511
- Moffat & Vogt (1975) Moffat A.F.J. & Vogt N. 1975, A&AS, 20, 155
- Momany et al. (2006) Momany, Y., Zaggia, S., Gilmore, G., Piotto, G., Carraro, G., Bedin, L.R. & de Angeli, F. 2006 A&A, 451, 515
- Nilakshi, Pandey & Mohan (2002) Nilakshi, S.R., Pandey, A.K. & Mohan, V. 2002, A&A, 383, 153
- Oort (1958) Oort, J.H. 1958, in Ricerche Astronomische, 5, 63, Proc. of a Conference at Vatican Observatory, ed. D.J.K. O’Connell
- Park & Lee (1999) Park, H.S. & Lee, M.G. 1999, MNRAS, 304, 883
- Pavani & Bica (2007) Pavani, D.N. & Bica, E. 2007, MNRAS, 468, 139
- Piskunov et al. (2007) Piskunov, A.E., Schilbach, E., Kharchenko, N.V., Röser, S. & Scholz, R.-D. 2007, A&A, 468, 151
- Portegies Zwart et al. (2002) Portegies Zwart, S.F., Makino, J., McMillan, S.L.W. & Hut, P. 2002, ApJ, 565, 265
- Russeil (2003) Russeil, D. 2003, A&A, 397, 133
- Sharma et al. (2006) Sharma, S., Pandey, A. K., Ogura, K., Mito, H., Tarusawa, K. & Sagar, R. 2006, AJ, 132, 1669
- Solomon et al. (1987) Solomon, P.M., Rivolo, A.R., Barrett, J. & Yahil, A. 1987, ApJ, 319, 730
- Spitzer (1958) Spitzer, L. 1958, ApJ 127, 17
- Tadross et al. (2002) Tadross, A.L., Werner, P., Osman, A. & Marie, M. 2002, NewAst, 7, 553
- Vallée (2005) Vallée, J.P. 2005, AJ, 130, 569
- Villanova, Baume & Carraro (2007) Villanova, S., Baume, G. & Carraro, G. 2007, MNRAS, 379, 1089
- Yadav & Sagar (2003) Yadav, R.K.S. & Sagar, R. 2003, BASI, 31, 87
- Wielen (1971) Wielen, R. 1971, A&A, 13, 309
- Wielen (1991) Wielen, R. 1991, in ”The Formation and Evolution of Star Clusters”, K. Janes (ed.), Astron. Soc. Pac. Conf. Ser. 13, San Francisco, CA, p. 343-349
- Wilson (1975) Wilson, C.P. 1975, AJ, 80, 175