22email: luziane@if.ufrgs.br, tiago.saurin@ufrgs.br, bica@if.ufrgs.br, charles@if.ufrgs.br,
alex@lana.ccne.ufsm.br
Structures in surface-brightness profiles of LMC and SMC star clusters: evidence of mergers?
Abstract
Context. The LMC and SMC are rich in binary star clusters, and some mergers are expected. It is important to characterize single clusters, binary clusters and candidates to mergers.
Aims. We selected a sample of star clusters in each Cloud with this aim. Surface photometry of 25 SMC and 22 LMC star clusters was carried with the ESO Danish 1.54 m telescope. 23 clusters were observed for the first time for these purposes.
Methods. We fitted Elson, Fall and Freeman (1987, EFF) profiles to the data, deriving structural parameters, luminosities and masses. We also use isophotal maps to constrain candidates to cluster interactions.
Results. The structural parameters, luminosities and masses presented good agreement with those in the literature. Three binary clusters in the sample have a double profile. Four clusters (NGC 376, K 50, K 54 and NGC 1810) do not have companions and present as well important deviations from EFF profiles.
Conclusions. The present sample contains blue and red Magellanic clusters. Extended EFF profiles were detected in some blue clusters. We find evidence that important deviations from the body of EFF profiles might be used as a tool to detect cluster mergers.
Key Words.:
(Galaxies:) Magellanic Clouds; Galaxies: star clusters1 Introduction
Surface-brightness and number-density profiles can be used to investigate properties of star clusters in different tidal environments. The standard description of Globular Clusters (GCs) assumes an isothermal central region and a tidally truncated outer region (e.g. Binney & Merrifield 1998). However, both structures evolve with time. Evolved GCs, in particular, can be virtually considered as dynamically relaxed systems (e.g. Noyola & Gebhardt 2006). Since formation, star clusters are subject to internal and external processes that affect the spatial distribution of stars and introduce asymmetries in the luminosity distribution, which in principle, can be detected by surface-brightness profiles (SBPs). Among the former are mass loss associated with stellar evolution, large-scale mass segregation and low-mass star evaporation. The latter are tidal stress and dynamical friction (e.g. Khalisi et al. 2007; Lamers et al. 2005; Gnedin & Otriker 1997). These processes tend to decrease cluster mass, which may accelerate the core collapse phase in some cases (e.g. Djorgovski & Meylan 1994). With time, what results is a spatial distribution of light (or mass) that reflects the combined effect of these processes associated with physical conditions at the early collapse (Bonatto & Bica 2007b and references therein).
In this context, the present-day internal structure of individual star clusters, as well as the collective large-scale galactocentric distribution can be used to probe conditions related to galaxy formation, and to investigate cluster dynamical evolution (e.g. Mackey & van den Bergh 2005; Bica et al. 2006).
SBPs of star clusters, GCs in particular, have been shown to follow analytical profiles. The most commonly used are the single-mass, modified isothermal sphere of King (1966) that is the basis of the Galactic GC parameters given by Trager et al. (1995) and Harris (1996, and the 2003 update111http://physun.physics.mcmaster.ca/Globular.html), the modified isothermal sphere of Wilson (1975) that assumes a pre-defined stellar distribution function which results in more extended envelopes than in King (1966), and the power-law with a core of EFF (Elson, Fall & Freeman 1987) that has been fit to massive young clusters especially in the Magellanic Clouds (e.g. Mackey & Gilmore 2003a, b). Each function is characterised by different parameters that are somehow related to the cluster structure.
Perhaps as interesting as the fact that SBPs can be described by analytical profiles such as King (1966) or EFF, from which structural parameters can be derived, is the fact that significant deviations have been detected. They are (i) post-core-collapse (PCC) excesses to power laws in surface density vs. log radius for Galactic GCs (e.g. Trager et al. 1995) and (ii) in Galactic open clusters (e.g. Bonatto & Bica 2005; Bica et al. 2006), and (iii) extensions beyond the tidal radius in young populous LMC clusters (e.g. Elson, Fall & Freeman 1987) or R 136 in 30 Dor (e.g. Mackey & Gilmore 2003a), which appear to be related to formation conditions.
Not many SMC clusters have published SBPs. Mackey & Gilmore (2003b) studied 10 populous SMC clusters. Using HST, 53 clusters in the LMC were studied by Mackey & Gilmore (2003a). Number-density studies (Chrysovergis et al. 1989, and references therein) included SMC and LMC clusters, but inner profiles were limited by the low stellar resolution in photographic material.
Evidence of cluster binarity and mergers has been reported for both Clouds, which appear to be suitable environments for that. Indeed, the SMC and LMC are very rich in cluster pairs and multiplets (Bica & Schmitt 1995; Bica et al. 1999; Dieball et al. 2002). Studies of radial variations of parameters related to isophotes and comparisons with N-body simulations were carried by de Oliveira et al. (2000a); de Oliveira, Bica & Dottori (2000b), where several possible mergers were discussed. The blue LMC cluster NGC 2214 has been reported as merger, where the secondary component appears to be still conspicuous in images (Bhatia & MacGillivray 1988).
In the present study we explore a sample of 47 SMC and LMC clusters of different ages, part of them studied in terms of SBP for the first time. The sample selection was mostly based on van den Bergh (1981), in view of spanning a wide age range. We argue that distortions found in the SBP of some clusters may arise from the spatial evolution of mergers, and that the star clusters NGC 376, K 50, K 54, and NGC 1810 have evidence for mergers.
2 Observations and analysis
The data were obtained in two observing runs, the first between 1990 november 16 and 20, and the second between 1991 october 25 and november 9 using the ESO Danish 1.54 m telescope, in La Silla, Chile. The detectors were RCA CCDs (SID 501 in the first run and 503 in the second run). They have 320512 and 1024640 pixels, with the spatial scales 0.475′′/pixel and 0.237′′/pixel (Table 1), respectively. V and B Bessel filters were used. CCD gains were 12.3 and 5.9 electrons/ADU, and readout noises were 31.6 and 15 electrons. The mean seeing for the frames was 1.5′′. In Table 1 we summarize the observational data including the exposure time and seeing for each image together with the most common identifiers (Bica & Schmitt 1995; Bica et al. 1999) for the star clusters of this sample.
For all objects the V band observations were used, except NGC 2159, for which the B image had a significantly higher signal-noise ratio.
| Cluster name | Time | Seeing | CCD scale | Date |
| (s) | (arcsec) | (arcsec/pixel) | ||
| (1) | (2) | (3) | (4) | (5) |
| SMC | ||||
| NGC 121 (K 2, L 10) | 360 | 1.6 | 0.475 | 1990 |
| NGC 176 (K 12, L 16) | 360 | 1.6 | 0.475 | 1991 |
| K 17 (L 26) | 360 | 1.2 | 0.475 | 1991 |
| NGC 241+242 (K 22, L 29) | 60 | 1.7 | 0.475 | 1991 |
| NGC 290 (L 42) | 60 | 1.4 | 0.475 | 1991 |
| L 48 | 360 | 1.8 | 0.237 | 1991 |
| K 34 (L 53) | 240 | 1.4 | 0.475 | 1991 |
| NGC 330 (K 35, L 54) | 100 | 1.5 | 0.475 | 1990 |
| L 56 | 120 | 1.6 | 0.475 | 1990 |
| NGC 339 (K 36, L 59) | 180 | 1.9 | 0.475 | 1990 |
| NGC 346 (L 60) | 60 | 1.8 | 0.475 | 1990 |
| IC 1611 (K 40, L 61) | 360 | 1.4 | 0.475 | 1991 |
| IC 1612 (K 41, L 62) | 360 | 1.4 | 0.475 | 1991 |
| L 66 | 30 | 1.3 | 0.475 | 1991 |
| NGC 361 (K 46, L 67) | 120 | 1.9 | 0.475 | 1991 |
| K 47 (L 70) | 120 | 1.3 | 0.475 | 1991 |
| NGC 376 (K 49, L 72) | 240 | 1.5 | 0.237 | 1991 |
| K 50 (L 74) | 120 | 1.2 | 0.475 | 1991 |
| IC 1624 (K 52, L 76) | 180 | 1.6 | 0.475 | 1991 |
| K 54 (L 79) | 30 | 1.9 | 0.475 | 1991 |
| NGC 411 (K 60, L 82) | 180 | 2.1 | 0.475 | 1991 |
| NGC 416 (K 59, L 83) | 150 | 1.2 | 0.475 | 1991 |
| NGC 419 (K 58, L 85) | 300 | 1.4 | 0.237 | 1991 |
| NGC 458 (K 69, L 96) | 240 | 1.6 | 0.475 | 1990 |
| L 114 | 180 | 1.4 | 0.475 | 1990 |
| LMC | ||||
| NGC 1783 (SL 148) | 300 | 1.8 | 0.475 | 1991 |
| NGC 1810 (SL 194) | 120 | 1.2 | 0.475 | 1991 |
| NGC 1818 (SL 201) | 60 | 1.7 | 0.237 | 1991 |
| NGC 1831 (SL 227, LW 133) | 300 | 1.6 | 0.237 | 1991 |
| NGC 1847 (SL 240) | 120 | 2.2 | 0.475 | 1991 |
| NGC 1856 (SL 271) | 120 | 1.7 | 0.475 | 1991 |
| NGC 1866 (SL 319, LW 163) | 30 | 1.8 | 0.475 | 1990 |
| NGC 1868 (SL 330, LW 169) | 120 | 1.8 | 0.475 | 1990 |
| NGC 1870 (SL 317) | 120 | 1.8 | 0.475 | 1991 |
| NGC 1978 (SL 501) | 160 | 1.5 | 0.475 | 1990 |
| NGC 2004 (SL 523) | 60 | 1.3 | 0.475 | 1991 |
| NGC 2011 (SL 559) | 160 | 1.3 | 0.475 | 1990 |
| NGC 2100 (SL 662) | 20 | 1.5 | 0.475 | 1991 |
| NGC 2121 (SL 725, LW 303) | 240 | 1.3 | 0.475 | 1991 |
| NGC 2157 (SL 794) | 120 | 2.1 | 0.475 | 1990 |
| NGC 2159 (SL 799) | 20 | 1.3 | 0.475 | 1991 |
| NGC 2164 (SL 808) | 180 | 2.2 | 0.475 | 1991 |
| NGC 2210 (SL 858, LW 423) | 180 | 1.4 | 0.475 | 1991 |
| NGC 2213 (SL 857, LW 419) | 120 | 2.2 | 0.475 | 1990 |
| NGC 2214 (SL 860, LW 426) | 50 | 1.8 | 0.475 | 1990 |
| H 11 (SL 868, LW 437) | 420 | 1.3 | 0.475 | 1991 |
| HS 314 | 60 | 1.7 | 0.475 | 1990 |
-
Col. 1: Cluster identifications in main catalogues. Col. 2: CCD exposure time in seconds. Col. 3: Seeing in arcseconds. Col. 4: CCD scale in arcseconds per pixel. Col. 5: Year of the observing run.
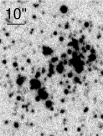
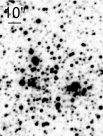
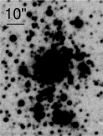
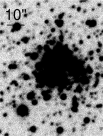
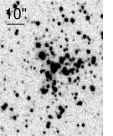
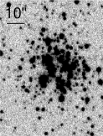
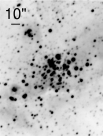
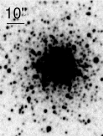
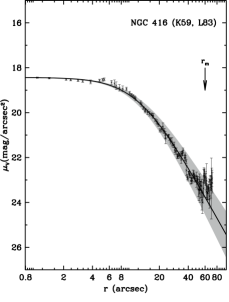
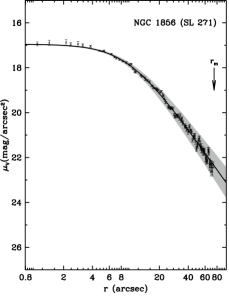
Figure 1 shows examples of clusters of the present sample. The first three (NGC 241+242, IC 1612, NGC 2011) are double clusters (Sect. 1). The next three (NGC 376, K 50, NGC 1810) are candidates to mergers (Sect. 4). NGC 346 is a young star cluster embedded in an HII region. NGC 416 is a populous intermediate age SMC cluster, and NGC 1856 is a populous blue LMC cluster.
2.1 Data reduction
All frames were reduced using standard iraf routines for bias and dark current subtration and flat-field division. Bad and hot pixels (cosmic rays) were replaced by linear interpolation along lines or columns using the nearest good pixels.
Photometric calibration was performed with a least-squares fit routine that uses errors as weights, with standard stars of Graham (1982) and Landolt (1992), resulting in a mean error smaller than 0.01 mag at a 66% confidence level. The transformations used in the photometric calibration were
for the first run, and
for the second run, where and are the instrumental magnitudes. The mean errors are 0.008, 0.014, and 0.006 mag, respectively.
2.1.1 Cluster center determination
Accurate cluster centers are fundamental, because errors will introduce additional uncertainties in the SBPs. In Fig. 2 we present brightness profiles for an artificial image where we displaced the center of the surface photometry by 5′′, 10′′, 15′′ and 20′′ of the correct center, successively. It is possible to see that apparently acceptable SBPs can be obtained, although the cluster center was not determined correctly. However, resulting structural parameters especially present offsets.
The coordinates of the symmetry center for each cluster have been obtained, with a mean error smaller than 0.5′′, using an implementation of the mirror-autocorrelation algorithm (Djorgovski 1988). We obtained for each cluster a set of autocorrelation amplitudes that have been fitted with an elliptical paraboloid. The optimal center is the vertex of this paraboloid.
For some objects we determined the center by a heuristic method because of their non-symmetrical stellar distribution as a whole, or presence of bright stars. This was the case of NGC 241+242, NGC 339, K 47, K 50, NGC 1810, and NGC 2004.
The derived cluster center positions in equatorial coordinates (J2000) are given in Table 2.
| Cluster | ||||
|---|---|---|---|---|
| (1) | (2) | (3) | (4) | (5) |
| SMC | ||||
| NGC 121 | ||||
| NGC 176 | ||||
| K 17 | ||||
| NGC 241 | ||||
| NGC 290 | ||||
| L 48 | ||||
| K 34 | ||||
| NGC 330 | ||||
| L 56 | ||||
| NGC 339 | ||||
| NGC 346 | ||||
| IC 1611 | ||||
| IC 1612 | ||||
| L 66 | ||||
| NGC 361 | ||||
| K 47 | ||||
| NGC 376 | ||||
| K 50 | ||||
| IC 1624 | ||||
| K 54 | ||||
| NGC 411 | ||||
| NGC 416 | ||||
| NGC 419 | ||||
| NGC 458 | ||||
| L 114 | ||||
| LMC | ||||
| NGC 1783 | ||||
| NGC 1810 | ||||
| NGC 1818 | ||||
| NGC 1831 | ||||
| NGC 1847 | ||||
| NGC 1856 | ||||
| NGC 1866 | ||||
| NGC 1868 | ||||
| NGC 1870 | ||||
| NGC 1978 | ||||
| NGC 2004 | ||||
| NGC 2011 | ||||
| NGC 2100 | ||||
| NGC 2121 | ||||
| NGC 2157 | ||||
| NGC 2159 | ||||
| NGC 2164 | ||||
| NGC 2210 | ||||
| NGC 2213 | ||||
| NGC 2214 | ||||
| H 11 | ||||
| HS 314 | ||||
-
Col. 2: Right ascension. Col. 3: Standard deviation. Col. 4: Declination. Col. 5: Standard deviation.
2.2 Surface photometry
Surface photometry was performed with concentric annular apertures centered on the cluster coordinates (Table 2) and subdivided in at least 4, and at most, 32 sectors. An effective radius for each annulus was determined iteractively by following the radial distribution of brightness for each annulus. The counts in each anullus were determined and adopted as surface-brightness, together with its standard deviation. The surface-brightness for each annulus is the mean or median of the values measured for all sectors together with standard deviation. In col. 6 of Table 3 we give the adopted statistics. The approach was based on the median. However, for convergence arguments, in some cases we adopted the mean. In general, the median was more suitable for red clusters. A limiting radius of the photometry for each cluster was estimated, so that the rings did not exceed the physical limits of the image.
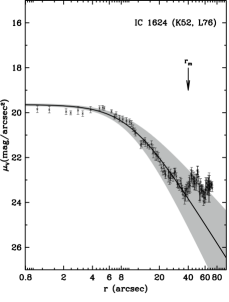
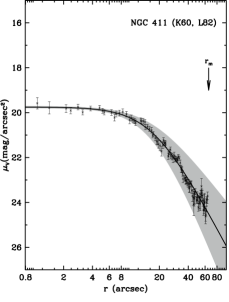
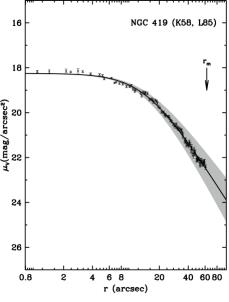
For each profile, the points are the result of four sets of anulli with radial steps of 1.5′′, 2.0′′, 3.0′′ and 4.0′′. Four anullus sets are plotted in the same axes with the best-fitting EFF profile. This is particularly useful to build SBPs with an adequate spatial resolution in the inner regions of the cluster. Conversely, large steps are more suitable for the outer regions. We find that the simultaneous use of four steps yields comparable average profiles.
For each cluster we tested if the mean or the median of the flux in the sectors provided profiles with minimal errors in the surface-brightness and resulting fits. In the luminosity and mass estimates this choice was also important.
The sky level was evaluated considering four peripheral regions in each image that were not affected by the background and field stars. These regions have been merged into a single one, of larger dimension, to compute a self- consistent histogram of sky counts. They were truncated at 3 of the average until the histogram did not vary anymore. Finally, we chose the mode of this distribution as the value of the brightness of the sky and subtracted it from the surface-brightness of the clusters.
Similarly to Elson, Fall & Freeman (1987), the young LMC clusters dealt with in this work do not appear to be tidally truncated. Indeed, their profiles are well represented by the following model
| (1) |
where is the central surface-brightness in magnitude scale, is a dimensionless power-law and is a parameter that is related to the core radius () in arcsecs by
| (2) |
Fits of Eq. 1 were performed with a nonlinear least-squares routine that uses SBP errors as weights. For most of the sample this procedure converged, and the resulting fit parameters are given in Table 3. Exceptions are NGC 376, K 50, K 54 and NGC 1810, for which there was no convergence.
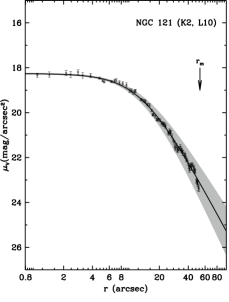
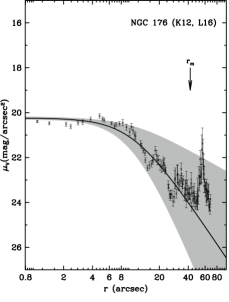
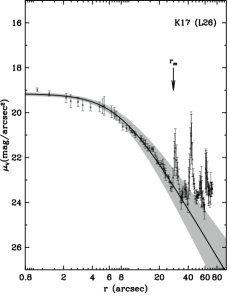
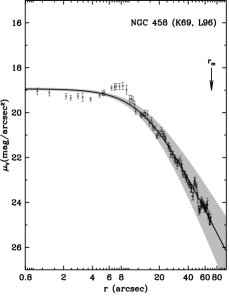
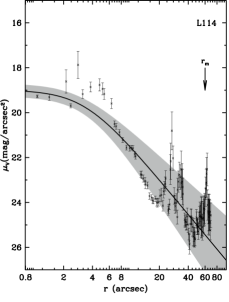
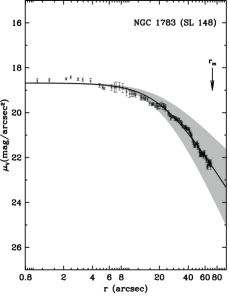
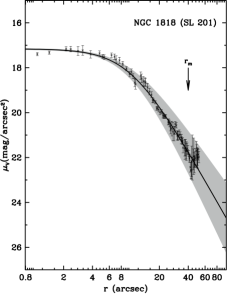
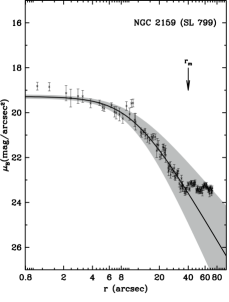
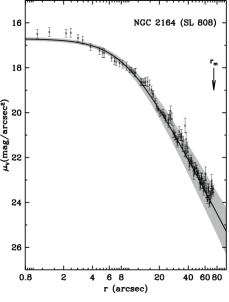
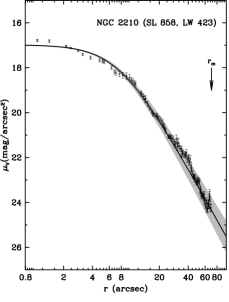
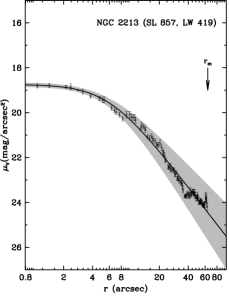
2.2.1 Surface brightness profiles
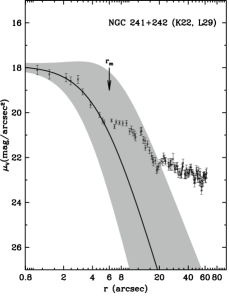
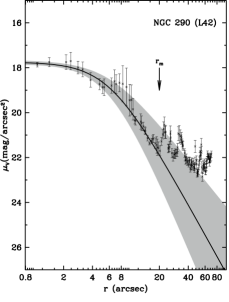
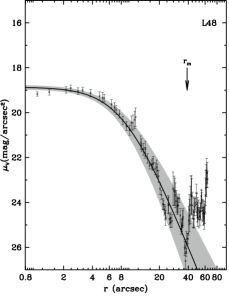
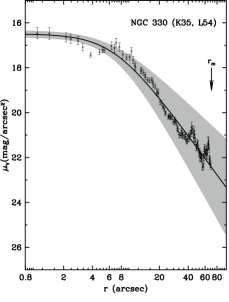
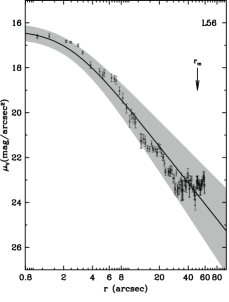
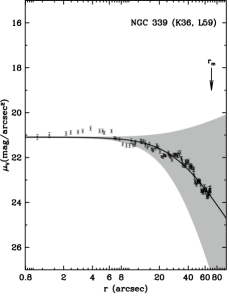
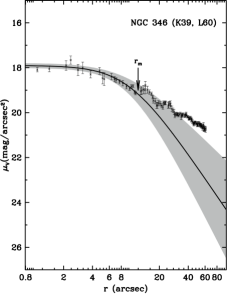
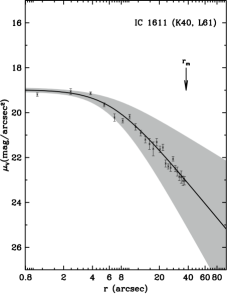
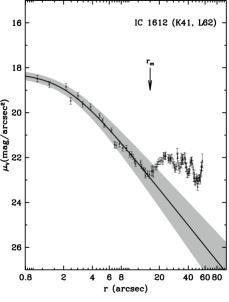
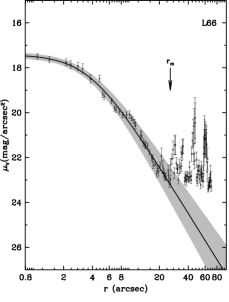
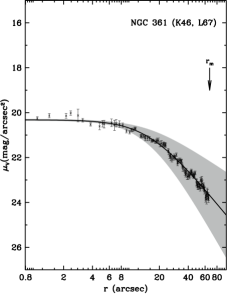
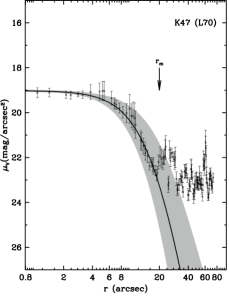
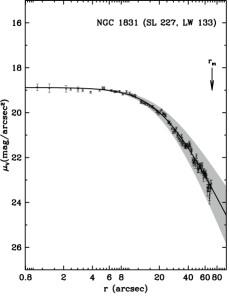
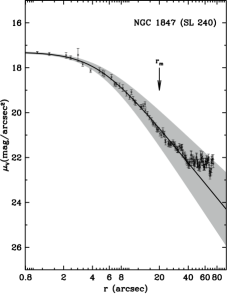
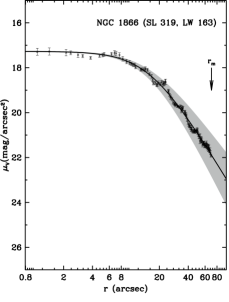
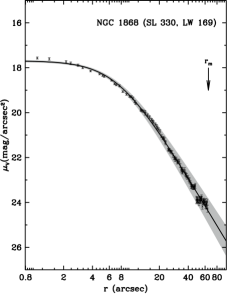
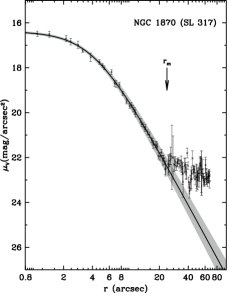
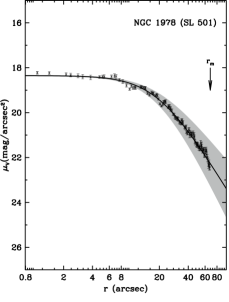
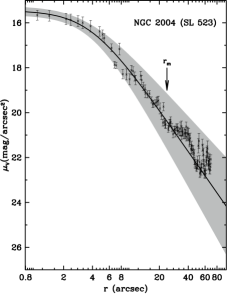
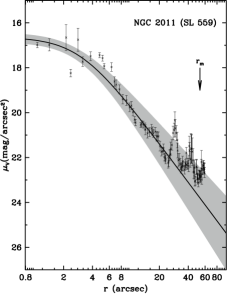
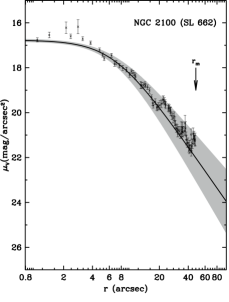
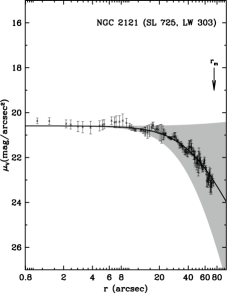
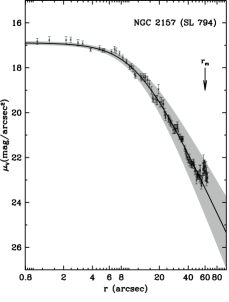
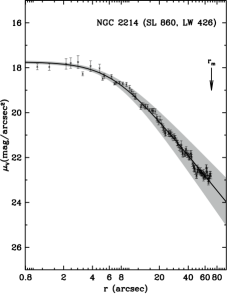
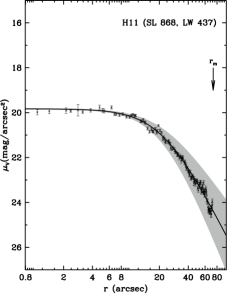
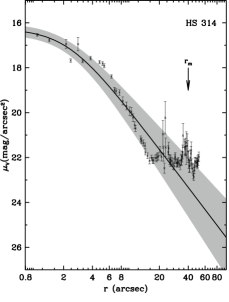
Surface brightness profiles in magnitude scale for the 47 clusters in the sample are shown in Fig. 3. The maximum fit radius () is indicated for each object and these values are listed in Table 4. The clusters NGC 376, K 50, K 54, NGC 1810, could not be fitted by Eq. 1. All profiles were obtained in the V band, except NGC 2159, for which a B image was used.
The variations seen in the profiles do not appear to depend on cluster bright stars, which arise in different age ranges, nor on bright field stars. In order to test this, we cleaned the images of e.g. NGC 330 and NGC 2004 of supergiants, and NGC 2121 of AGB stars. The original and the clean profiles are essentially the same providing the same parameters, within uncertainties. No bright field star is superimposed on the present clusters.
In addition, since we are dealing with populous clusters, statistical uncertainties are small.


2.3 Luminosity
Integration of Eq. 1 from the center to the maximum fit radius yields the luminosity :
| (3) |
For and 2, we have the asymptotic cluster luminosity :
| (4) |
3 Results
3.1 Structural parameters, luminosity and mass
Table 3 presents the structural parameters obtained by fitting Eq. 1, together with the core radius obtained from the a and parameters in Eq. 2.
Luminosity estimates can be obtained by means of Eqs. 3 and 4, both as a function of the fitting radius (), and asymptotic luminosity. Mass estimates have been calculated by multiplying the luminosity by the appropriate mass-to-light ratio. The latter values were obtained (Table 4) from the calibration in Mackey & Gilmore (2003a, b), which are based on evolutionary synthesis code of Fioc & Rocca-Volmerange (1997) (PEGASE v2.0, 1999).
The calculated values for , , in the V band, and are listed in Table 4, together with the fit radius .
| Cluster | |||||
| (mag/arcsec2) | (arcsec) | (pc) | Adopted statistics | ||
| (1) | (2) | (3) | (4) | (5) | (6) |
| SMC | |||||
| NGC 121 | 18.26 0.04 | 3.20 0.08 | 13.38 0.50 | 2.39 0.01 | median |
| NGC 176 | 20.30 0.06 | 6.09 1.78 | 20.60 4.44 | 2.20 0.11 | mean |
| K 17 | 19.16 0.08 | 2.87 0.12 | 7.78 0.54 | 1.49 0.01 | mean |
| NGC 241+242 | 17.90 0.17 | 5.90 3.11 | 4.76 1.96 | 0.60 0.07 | mean |
| NGC 290 | 17.75 0.09 | 3.09 0.39 | 6.07 0.97 | 1.11 0.03 | mean |
| L 48 | 18.86 0.10 | 4.27 0.32 | 8.77 0.90 | 1.32 0.02 | mean |
| K 34 | 19.23 0.06 | 2.48 0.15 | 9.66 0.82 | 2.39 0.04 | median |
| NGC 330 | 16.49 0.16 | 2.34 0.08 | 6.77 0.74 | 1.48 0.03 | mean |
| L 56 | 16.32 0.35 | 2.16 0.08 | 2.20 0.45 | 0.51 0.01 | median |
| NGC 339 | 21.09 0.04 | 2.77 0.31 | 31.41 3.54 | 7.23 0.71 | mean |
| NGC 346 | 17.90 0.11 | 2.53 0.22 | 9.68 0.86 | 2.01 0.03 | median |
| IC 1611 | 18.98 0.10 | 2.06 0.19 | 6.24 1.01 | 1.49 0.06 | median |
| IC 1612 | 18.22 0.19 | 2.13 0.11 | 2.12 0.32 | 0.49 0.01 | mean |
| L 66 | 17.41 0.13 | 2.76 0.12 | 3.79 0.37 | 0.74 0.01 | mean |
| NGC 361 | 20.32 0.04 | 2.10 0.08 | 15.72 0.95 | 4.34 0.07 | median |
| K 47 | 19.02 0.05 | 10.77 3.37 | 19.35 4.03 | 1.74 0.15 | mean |
| IC 1624 | 19.64 0.06 | 2.72 0.16 | 9.94 0.84 | 1.97 0.03 | median |
| NGC 411 | 19.75 0.05 | 3.26 0.14 | 17.64 1.05 | 3.12 0.04 | median |
| NGC 416 | 18.43 0.02 | 3.11 0.09 | 12.63 0.46 | 2.30 0.01 | median |
| NGC 419 | 18.25 0.02 | 2.70 0.06 | 14.74 0.47 | 2.93 0.01 | median |
| NGC 458 | 18.94 0.06 | 3.43 0.10 | 14.46 0.73 | 2.48 0.02 | mean |
| L 114 | 18.99 0.29 | 2.06 0.11 | 3.36 0.53 | 0.80 0.02 | mean |
| LMC | |||||
| NGC 1783 | 18.68 0.03 | 2.72 0.10 | 21.06 1.00 | 4.90 0.06 | median |
| NGC 1818 | 17.16 0.04 | 3.03 0.15 | 10.16 0.63 | 1.88 0.01 | median |
| NGC 1831 | 18.88 0.02 | 3.42 0.16 | 22.07 0.77 | 3.79 0.02 | median |
| NGC 1847 | 17.30 0.05 | 2.09 0.12 | 4.56 0.49 | 1.07 0.01 | mean |
| NGC 1856 | 16.95 0.03 | 2.42 0.04 | 9.57 0.27 | 2.04 0.00 | median |
| NGC 1866 | 17.27 0.03 | 2.84 0.06 | 16.03 0.59 | 3.09 0.01 | mean |
| NGC 1868 | 17.69 0.05 | 2.85 0.03 | 7.47 0.24 | 1.44 0.00 | mean |
| NGC 1870 | 16.38 0.06 | 3.15 0.07 | 4.18 0.19 | 0.76 0.00 | median |
| NGC 1978 | 18.35 0.03 | 2.82 0.08 | 19.67 0.73 | 3.81 0.02 | mean |
| NGC 2004 | 15.45 0.20 | 2.46 0.16 | 3.82 0.61 | 0.81 0.02 | mean |
| NGC 2011 | 16.64 0.22 | 2.29 0.09 | 2.98 0.43 | 0.66 0.01 | mean |
| NGC 2100 | 16.77 0.07 | 2.46 0.10 | 6.80 0.49 | 1.44 0.01 | mean |
| NGC 2121 | 20.59 0.02 | 3.66 0.36 | 47.21 3.85 | 7.78 0.44 | median |
| NGC 2157 | 16.89 0.08 | 3.65 0.12 | 11.92 0.69 | 1.97 0.01 | mean |
| NGC 2159* | 19.08 0.08 | 2.42 0.26 | 12.66 1.83 | 2.70 0.16 | median |
| NGC 2164 | 16.71 0.08 | 3.29 0.06 | 9.09 0.40 | 1.60 0.01 | mean |
| NGC 2210 | 16.98 0.03 | 3.06 0.05 | 7.65 0.25 | 1.41 0.00 | mean |
| NGC 2213 | 18.74 0.10 | 2.22 0.06 | 6.02 0.48 | 1.36 0.01 | mean |
| NGC 2214 | 17.74 0.07 | 2.10 0.04 | 6.49 0.36 | 1.52 0.01 | mean |
| H 11 | 19.83 0.03 | 3.42 0.12 | 22.37 0.97 | 3.84 0.03 | median |
| HS 314 | 16.26 0.25 | 2.25 0.12 | 2.22 0.41 | 0.50 0.01 | mean |
-
Col. 2: Central surface brightness. Col. 3: Gamma parameter. Col. 4: parameter. Col. 5: Core radius. Col. 6: Statistical adopted for the surface brightness. * For NGC 2159 we used .
| Cluster | Age | Ref. | ||||||
| (Gyr) | (pc) | () | () | () | () | |||
| (1) | (2) | (3) | (4) | (5) | (6) | (7) | (8) | (9) |
| SMC | ||||||||
| NGC 121 | 11.90 1.30 | 2 | 12.88 | 2.74 | 5.00 0.05 | 5.09 0.05 | 5.44 0.14 | 5.53 0.13 |
| NGC 176 | 0.46 0.01 | 3 | 7.29 | 0.23 | 4.17 0.34 | 4.43 0.27 | 3.53 0.08 | 3.80 0.06 |
| K 17 | 0.30 0.10 | 9 | 6.80 | 0.28 | 4.23 0.10 | 4.40 0.09 | 4.81 0.38 | 4.98 0.35 |
| NGC 241+242 | 0.07 0.04 | 10 | 1.46 | 0.17 | 3.75 0.56 | 3.83 0.50 | 2.98 0.09 | 3.06 0.09 |
| NGC 290 | 0.03 0.01 | 14 | 4.86 | 0.10 | 4.52 0.24 | 4.65 0.21 | 3.52 0.02 | 3.65 0.02 |
| L 48 | 0.15 0.04 | 3 | 9.48 | 0.20 | 4.19 0.11 | 4.21 0.12 | 3.50 0.02 | 3.51 0.02 |
| K 34 | 0.24 0.12 | 10 | 11.42 | 0.22 | 4.60 0.19 | 4.90 0.16 | 3.94 0.04 | 4.24 0.03 |
| NGC 330 | 0.03 0.01 | 1 | 17.01 | 0.09 | 5.50 0.17 | 5.76 0.15 | 4.45 0.02 | 4.71 0.01 |
| L 56 | 0.006 0.01 | 14 | 12.15 | 0.14 | 4.77 0.35 | 5.17 0.31 | 3.92 0.05 | 4.32 0.04 |
| NGC 339 | 6.30 1.30 | 2 | 19.98 | 1.66 | 4.67 0.26 | 4.97 0.20 | 4.89 0.43 | 5.19 0.33 |
| NGC 346 | 0.003 | 17 | 2.92 | 0.02 | 4.65 0.27 | 5.31 0.20 | 2.95 0.01 | 3.61 0.00 |
| IC 1611 | 0.11 0.05 | 10 | 9.23 | 0.16 | 4.46 1.95 | 5.44 1.38 | 3.66 0.31 | 4.65 0.22 |
| IC 1612 | 0.10 | 16 | 3.89 | 0.14 | 3.84 0.53 | 4.47 0.40 | 2.98 0.07 | 3.62 0.06 |
| L 66 | 0.15 0.10 | 11 | 6.32 | 0.08 | 4.42 0.12 | 4.53 0.12 | 3.32 0.01 | 3.44 0.01 |
| NGC 361 | 8.10 1.20 | 2 | 19.13 | 2.03 | 4.70 0.49 | 5.57 0.35 | 5.01 1.00 | 5.87 0.71 |
| K 47 | 0.007 | 16 | 4.86 | 0.10 | 4.23 0.28 | 4.24 0.25 | 3.23 0.03 | 3.24 0.02 |
| IC 1624 | 0.06 0.03 | 10 | 9.72 | 0.12 | 4.31 0.14 | 4.50 0.12 | 3.39 0.02 | 3.58 0.01 |
| NGC 411 | 0.20 0.10 | 3 | 15.91 | 0.63 | 4.63 0.08 | 4.71 0.07 | 4.43 0.05 | 4.51 0.05 |
| NGC 416 | 6.90 1.10 | 2 | 14.58 | 1.79 | 4.93 0.06 | 5.01 0.05 | 5.18 0.10 | 5.26 0.09 |
| NGC 419 | 0.40 | 16 | 15.18 | 0.40 | 5.22 0.06 | 5.41 0.05 | 4.82 0.02 | 5.02 0.02 |
| NGC 458 | 0.05 0.01 | 3 | 17.01 | 0.25 | 4.76 0.06 | 4.81 0.06 | 4.16 0.02 | 4.21 0.01 |
| L 114 | 5.60 0.50 | 14 | 14.58 | 0.20 | 4.10 1.12 | 4.90 0.82 | 3.40 0.22 | 4.20 0.16 |
| LMC | ||||||||
| NGC 1783 | 1.30 0.40 | 4 | 20.41 | 0.63 | 5.39 0.09 | 5.62 0.07 | 4.74 0.02 | 4.96 0.02 |
| NGC 1818 | 0.02 0.01 | 3 | 9.72 | 0.08 | 5.24 0.10 | 5.36 0.08 | 4.15 0.01 | 4.26 0.01 |
| NGC 1831 | 0.32 0.12 | 4 | 17.25 | 0.32 | 5.12 0.07 | 5.21 0.06 | 4.63 0.02 | 4.71 0.02 |
| NGC 1847 | 0.02 0.01 | 3 | 4.86 | 0.09 | 4.77 0.82 | 5.67 0.59 | 3.72 0.07 | 4.62 0.05 |
| NGC 1856 | 0.12 0.04 | 4 | 18.10 | 0.18 | 5.54 0.06 | 5.78 0.05 | 4.80 0.01 | 5.04 0.01 |
| NGC 1866 | 0.09 0.01 | 7 | 17.01 | 0.18 | 5.65 0.05 | 5.80 0.05 | 4.91 0.01 | 5.06 0.01 |
| NGC 1868 | 0.33 0.03 | 3 | 15.79 | 0.40 | 4.89 0.04 | 4.96 0.04 | 4.49 0.02 | 4.57 0.02 |
| NGC 1870 | 0.72 0.30 | 19 | 5.83 | 0.16 | 4.79 0.06 | 4.85 0.05 | 3.99 0.01 | 4.06 0.01 |
| NGC 1978 | 2.50 0.50 | 18 | 16.52 | 2.10 | 5.37 0.07 | 5.56 0.05 | 5.69 0.14 | 5.88 0.11 |
| NGC 2004 | 0.03 0.01 | 4 | 5.83 | 0.08 | 5.30 0.24 | 5.54 0.22 | 4.20 0.02 | 4.45 0.02 |
| NGC 2011 | 0.01 | 6 | 12.88 | 0.05 | 4.81 0.22 | 5.05 0.20 | 3.50 0.01 | 3.75 0.01 |
| NGC 2100 | 0.032 0.019 | 4 | 11.66 | 0.07 | 5.29 0.14 | 5.52 0.12 | 4.14 0.01 | 4.36 0.01 |
| NGC 2121 | 0.70 0.20 | 3 | 18.10 | 1.33 | 4.92 0.17 | 5.11 0.12 | 5.05 0.23 | 5.24 0.16 |
| NGC 2157 | 0.03 0.02 | 3 | 14.58 | 0.11 | 5.37 0.07 | 5.40 0.07 | 4.41 0.01 | 4.44 0.01 |
| NGC 2159* | 0.06 0.03 | 3 | 9.72 | – | – | – | – | – |
| NGC 2164 | 0.05 0.03 | 3 | 17.98 | 0.13 | 5.31 0.05 | 5.34 0.05 | 4.43 0.01 | 4.46 0.01 |
| NGC 2210 | 15.85 1.26 | 13 | 17.01 | 3.37 | 5.13 0.04 | 5.17 0.04 | 5.66 0.14 | 5.70 0.12 |
| NGC 2213 | 1.30 0.50 | 5 | 15.55 | 0.87 | 4.55 0.18 | 4.94 0.14 | 4.49 0.15 | 4.88 0.12 |
| NGC 2214 | 0.04 0.01 | 3 | 17.01 | 0.11 | 5.08 0.25 | 5.75 0.18 | 4.12 0.03 | 4.79 0.02 |
| H 11 | 15.00 3.00 | 8 | 17.74 | 3.25 | 4.75 0.06 | 4.84 0.05 | 5.27 0.20 | 5.35 0.18 |
| HS 314 | 0.01 | 15 | 9.72 | 0.03 | 4.72 0.32 | 5.01 0.28 | 3.20 0.01 | 3.49 0.01 |
-
(1) Da Costa & Hatzidimitriou (1998); (2) Mighell et al. (1998); (3) Hodge (1983); (4) Santos & Piatti (2004); (5) Da Costa et al. (1985); (6) Gouliermis et al. (2006); (7) Becker & Mathews (1983); (8) Mighell et al. (1996); (9) Hodge & Flower (1987); (10) Elson & Fall (1985); (11) Piatti et al. (2005); (12) Piatti et al. (2005); (13) Geisler et al. (1997); (14) Ahumada et al. ; (15) Bica et al. (1996); (16) Chiosi et al. (2006); (17) Sabbi & Sirianni (2007); (18) Sagar & Pandey (1989); (19) Alcaino & Liller (1987). * A B image was used.
3.2 Comparison with previous studies
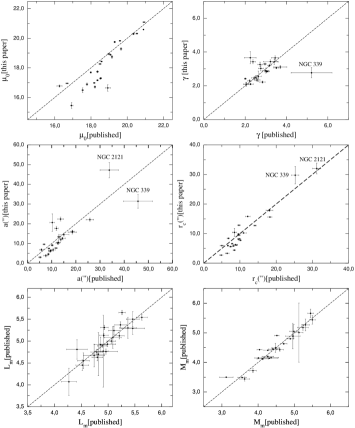
Comparison of the values measured in this study with HST results from Mackey & Gilmore (2003a, b) are plotted in Fig. 4. Agreement is in general good. Some deviant points are indicated.
3.3 Comparison of cluster properties
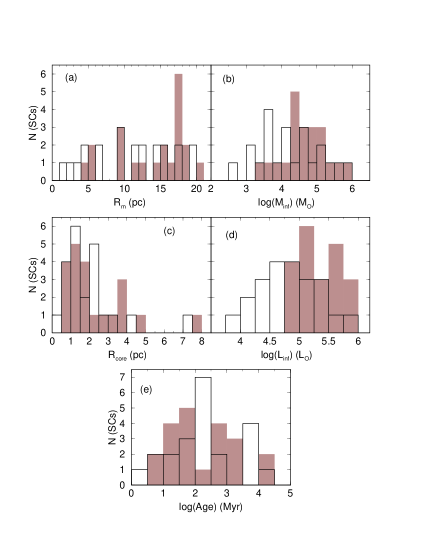
We analyse in Fig. 5 statistical properties of the present star cluster sample. As a caveat, we note that are dealing with small fractions of the catalogued star clusters in both Clouds, in the SMC (Bica & Schmitt 1995) and in the LMC (Bica et al. 1999). At least for the present sample, the LMC clusters are more massive and luminous than the SMC ones (panels a and b). In terms of radii, both samples present similar distributions (panels c and d); however, the core radius distribution is significantly different from that of . The age distributions are comparable between the present LMC and SMC clusters (panel e).
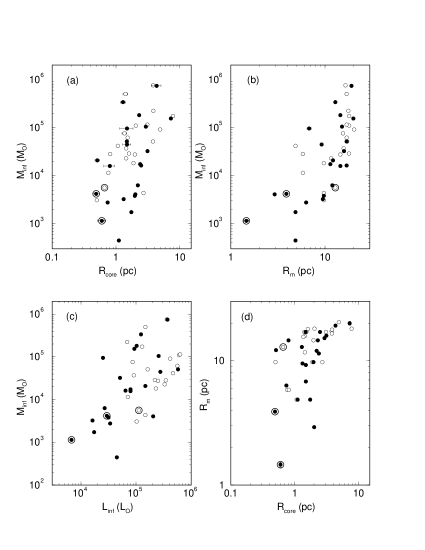
In Fig. 6 we investigate relations between parameters. The total mass correlates with the core radius (panel a), similarly to Galactic open clusters (Bonatto & Bica 2007a); in the present case, the mass reaches about two orders of magnitude higher than in the Galactic ones, while for the core radius the factor is about 4. Similar results apply for the maximum radius (panel b). Despite significant age differences, mass and luminosity correlate (panel c). Finally, the core and maximum radii correlate similarly to Galactic open clusters (Bonatto & Bica 2007c) for pc and pc (panel d); for larger radii, a saturation effect appears to occur. A possible interpretation is that the internal evolution continues after truncation of outer regions.
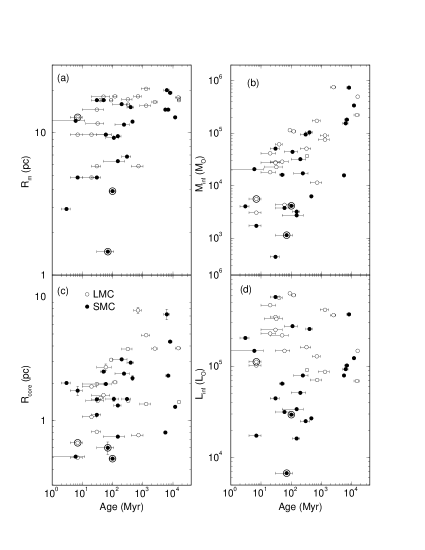
Maximum and core radii (Fig. 7 panels a and c) show a dependence with age, having the maximum radius also evidence of a saturation effect. Finally, mass has a significant correlation with age while luminosity does not (panels b and d). The mass-age correlation is probably related to dynamical cluster survival. Low mass clusters disperse into the field long before reaching an old age (Goodwin & Bastian 2006).
As compared to Mackey & Gilmore (2003b) similar behaviours occur in the relations in common, especially mass vs. age and core radius vs. age.
The binary clusters in Fig. 6 and Fig. 7 tend to be among the less massive and with smaller radii clusters in the sample. Note that we measured the main component (Fig. 3).
4 Atypical Magellanic clusters
4.1 Extended profile in the very young cluster NGC 346
The giant SMC HII region cluster NGC 346 (Fig. 1) has a systematic density excess for r10′′ (Fig. 3), likewise R 136 in 30 Doradus (Mackey & Gilmore 2003a). This may be attributed to star formation in a dynamically infant cluster. The excess in NGC 346 is not a contamination by the neighbouring intermediate age cluster BS 90 (Bica & Schmitt 1995; Rochau et al. 2007).
4.2 Binary clusters and merger candidates
We show in Fig. 8 isophotal maps for the binary clusters and merger candidates in the present sample. We applied Gaussian filters to smooth the images using the gauss routine of the iraf/images package.
As it became clear in the analysis of Fig. 3, seven clusters could not be satisfactorily fitted with EFF profiles due to the presence of large-scale structures along the SBPs. NGC 241+242 and IC 1612 + H86186 are binary clusters in the SMC (de Oliveira et al. 2000a), while NGC 2011 + BRHT14b is a binary cluster in the LMC (Bhatia et al. 1991; Dieball et al. 2002; Gouliermis et al. 2006). The double bump representing the cluster members can be seen in the profiles (Fig. 3). Isophotal maps of NGC 241+242, IC 1612 and NGC 2011 support this in Fig. 8.
A double peak is also observed in the SBPs of NGC 376, K 50 and K 54, but these clusters do not have a detected companion, together with NGC 1810 which has an unusual profile (Fig. 3). EFF profiles do not describe them. Their isophotal maps are complex. NGC 376, and especially K 50 and K 54, present apparently triangular outer isophotes, while NGC 376, K 50 and NGC 1810 have isophotal gaps that extend towards the cluster central parts (Fig. 1 and Fig. 3). In the numerical simulations of cluster encounters by de Oliveira, Bica & Dottori (2000b), similar structures can be seen. We conclude that unusual cluster profiles and isophotal distributions may be related to star cluster mergers.
4.3 Extended profiles
The SMC clusters NGC 176, NGC 290, L 66, K 47, IC 1624, and the LMC clusters NGC 1870, NGC 2159 and HS 314, in particular, have extensions beyond the EFF fitted profiles (Fig. 3). We are dealing with Blue Magellanic Clusters, with ages as a rule younger than 500 Myr. Elson, Fall & Freeman (1987) found similar extensions for comparable ages. Such clusters do not seem to be tidally truncated. Expansion due to mass loss or violent relaxation in the early cluster may contribute. The present work (Sect. 4.2) suggests that cluster interactions and eventual mergers may also contribute for clusters to spill over the Roche limit.
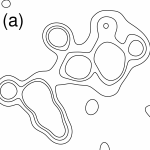
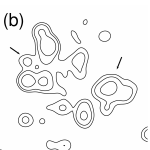
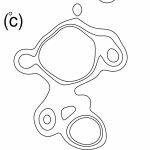
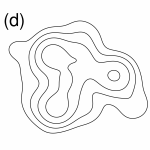
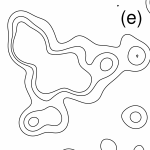
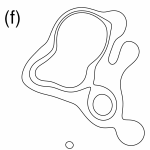
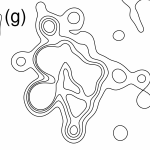
Table 5 summarizes the main conclusions about structures observed in the profiles of the star clusters of this study, including finer details. Note that objects in common with Mackey & Gilmore (2003a, b) have similar fine structures in the profile (e.g. NGC 176, Fig. 3). It is interesting that 35 of the clusters appear to have at least one significant fine structure ( 2 pc of typical size) in the observed light profiles. The seeing (Sect. 2) implies a resolution better than 0.5 pc. We call attention that the fine structure occurs in a smaller spatial scale as compared to the larger variations ( 5 pc) observed in the profile of the four clusters with evidence of mergers (Sect. 4.2).
| Cluster | Inner profile | External profile | Diagnostic |
| (1) | (2) | (3) | (4) |
| SMC | |||
| NGC 121 | NP | – | – |
| NGC 176 | RD+ | EE | – |
| K 17 | RD | EE | – |
| NGC 241+242 | – | – | binary |
| NGC 290 | RD+ | EE | – |
| L 48 | RD | EE | – |
| K 34 | NP | EE | – |
| NGC 330 | RD | – | – |
| L 56 | RD | EE | – |
| NGC 339 | RD | – | – |
| NGC 346 | RD | EE | – |
| IC 1611 | RD | – | – |
| IC 1612 | – | – | binary |
| L 66 | RD | EE | – |
| NGC 361 | RD | – | – |
| K 47 | NP | EE | – |
| NGC 376 | RD++ | EE (flattening) | merger |
| K 50 | RD++ | EE (flattening) | merger |
| IC 1624 | RD | EE | – |
| K 54 | RD++ | – | merger |
| NGC 411 | NP | – | – |
| NGC 416 | NP | – | – |
| NGC 419 | PD | – | – |
| NGC 458 | RD+ | – | – |
| L 114 | RD+ | – | – |
| LMC | |||
| NGC 1783 | RD | – | – |
| NGC 1810 | RD++ | EE (flattening) | merger |
| NGC 1818 | RD | – | – |
| NGC 1831 | NP | – | – |
| NGC 1847 | NP | EE | – |
| NGC 1856 | NP | – | – |
| NGC 1866 | RD | – | – |
| NGC 1868 | NP | – | – |
| NGC 1870 | NP | EE | – |
| NGC 1978 | RD | – | – |
| NGC 2004 | RD | – | – |
| NGC 2011 | RD+ | EE | binary |
| NGC 2100 | RD | – | – |
| NGC 2121 | NP | – | – |
| NGC 2157 | RD | EE | – |
| NGC 2159 | RD+ | – | – |
| NGC 2164 | RD | – | – |
| NGC 2210 | PD | – | – |
| NGC 2213 | RD | – | – |
| NGC 2214 | RD | – | – |
| H 11 | NP | – | – |
| HS 314 | RD+ | EE | – |
-
Col. 2: Caracterization of inner profile. Col. 3: Caracterization of external profile. Col. 4: Final diagnostic. NP: normal profile RD: radially disturbed EE: external excess PD: profile deviation. Plus sign suggests intensity.
5 Concluding remarks
Surface brightness profiles in the V band were derived for 25 SMC and 22 LMC star clusters, including blue and red ones.
Cluster centers were determined using the mirror autocorrelation (Djorgovski 1988) method with mean error smaller than 0.5′′.
The observed profiles were fitted with the EFF model. The structural parameters obtained from the fits were used to determine luminosities and masses of the star clusters. For those in common with the HST study of Mackey & Gilmore (2003a, b) the agreement is good. For 23 objects the analysis is carried out for the first time.
It is important to characterize single clusters, binary and candidates to mergers in the Clouds, clusters which are ideal laboratories for dynamical studies.
In some cases, the profiles present important deviations from EFF profiles. We also use isophotal maps to constrain candidates to cluster interactions. The binary clusters NGC 241+242, IC 1612, and NGC 2011 have a double profile. The clusters NGC 376, K 50, K 54 and NGC 1810 do not have detected companions and present as well significant deviations from EFF profiles with bumps and dips in a 5 pc scale.
We conclude that important deviations from the body of EFF profiles might be used as a tool to detect cluster mergers.
References
- Alcaino & Liller (1987) Alcaino, G. & Liller, W. 1987, AJ, 94, 372
- (2) Ahumada, A.V., Claria, J.J., Bica, E. & Dutra, C. M. 2002, A&A, 393, 855
- Becker & Mathews (1983) Becker, S.A. & Mathews, G.J. 1983, ApJ, 270, 155
- Bhatia & MacGillivray (1988) Bhatia, R.K. & MacGillivray, H.T. 1988, A&A, 203, L5
- Bhatia et al. (1991) Bhatia, R.K., Read, M.A., Tritton, S. & Hatzidimitriou, D. 1991, A&AS, 87, 335
- Bica & Schmitt (1995) Bica, E. & Schmitt, H.R. 1995, ApJS, 101, 41
- Bica et al. (1996) Bica, E., Claria, J.J., Dottori, H., Santos, J.F.C.,Jr. & Piatti, A.E. 1996, ApJS, 102, 57
- Bica et al. (1999) Bica, E., Schmitt, H.R., Dutra, C. M. & Oliveira, H.L. 1999, AJ, 117, 238
- Bica et al. (2006) Bica, E., Bonatto, C., Barbuy, B. & Ortolani, S. 2006, A&A, 450, 105
- Bica et al. (2006) Bica, E., Bonatto, C. & Blumberg, R. 2006, A&A, 460, 83B
- Binney & Merrifield (1998) Binney, J & Merrifield, M. 1998, in Galactic Astronomy, Princeton, NJ: Princeton University Press. (Princeton series in Astrophysics)
- Bonatto & Bica (2005) Bonatto, C. & Bica, E. 2005, A&A, 437, 483
- Bonatto & Bica (2007a) Bonatto, C. & Bica, E. 2007a, MNRAS, 377, 1301
- Bonatto & Bica (2007b) Bonatto, C. & Bica, E. 2007b, A&A, in press (astroph/0711.2919)
- Bonatto & Bica (2007c) Bonatto, C. & Bica, E. 2007c, A&A, 473, 445
- Chiosi et al. (2006) Chiosi, E., Vallenari, A., Held, E.V., Rizzi, L. & Moretti, A. 2006, A&A, 452, 179
- Chrysovergis et al. (1989) Chrysovergis, M., Kontizas, M. & Kontizas, E. 1989, A&AS, 77, 235
- Da Costa et al. (1985) Da Costa, G.S., Mould, J.R. & Crawford, M.D. 1985, ApJ, 297, 582
- Da Costa & Hatzidimitriou (1998) Da Costa, G.S. & Hatzidimitriou, D. 1998, AJ, 115, 1934
- de Oliveira et al. (2000a) de Oliveira, M.R., Dutra, C.M., Bica, E. & Dottori, H. 2000, A&A, 146, 57
- de Oliveira, Bica & Dottori (2000b) de Oliveira, M.R., Bica, E. & Dottori, H. 2000, MNRAS, 311, 589
- Dieball et al. (2002) Dieball, A., Müller, H. & Grebel, E.K. 2002, A&A, 391, 547
- Djorgovski (1988) Djorgovski, S., 1988, The Harlow-Shapley Symposium on Globular Cluster Systems in Galaxies; Proceedings of the 126th IAU Symposium, 126, 333
- Djorgovski & Meylan (1994) Djorgovski, S. & Meylan, G. 1994, AJ, 108, 1292
- Elson & Fall (1985) Elson, R.A.W., Fall, S.M. 1985, ApJ, 299, 211
- Elson, Fall & Freeman (1987) Elson, R.A.W., Fall, S.M., Freeman, K.C., 1987, ApJ, 323, 54
- Elson, Freeman & Lauer (1989) Elson, R.A.W., Freeman, K.C. & Lauer, T.R. 1989, ApJ, 347, L69
- Elson (1991) Elson, R.A.W. 1991, ApJS, 76, 185
- Elson (1992) Elson, R.A.W. 1992, MNRAS, 256, 515
- Fioc & Rocca-Volmerange (1997) Fioc, M., Rocca-Volmerange, B. 1997, A&A, 326, 950
- Geisler et al. (1997) Geisler, D., Bica, E., Dottori, H., Claria, J.J., Piatti, A.E., Santos Jr., J.F.C. 1997, AJ, 114, 1920
- Gnedin & Otriker (1997) Gnedin, O.Y., & Otriker, J.P. 1997, ApJ, 474, 223
- Goodwin & Bastian (2006) Goodwin, S.P., & Bastian, N. 2006, MNRAS, 373, 752
- Gouliermis et al. (2006) Gouliermis, D.A., Lianou, S., Kontizas, M., Kontizas, E. & Dapergolas, A. 2006, ApJ, 652, 93
- Graham (1982) Graham, J.A., 1982, PASP, 94, 244
- Harris (1996) Harris, W.E. 1996, AJ, 112, 1487
- Hodge (1983) Hodge, P W., 1983, ApJ, 264, 470
- Hodge & Flower (1987) Hodge, P.W. & Flower, P. 1987, PASP, 99, 734
- Khalisi et al. (2007) Khalisi, E., Amaro-Seoane, P. & Spurzem, R. 2007, MNRAS, 374, 703
- King (1966) King, I.R. 1966, AJ, 71, 64
- Lamers et al. (2005) Lamers, H.J.G.L.M., Gieles, M., Bastian, N., Baumgardt, H., Kharchenko, N.V. & Portegies Zwart, S., 2005, A&A, 441, 117
- Landolt (1992) Landolt, A.U. 1992, AJ, 340, 104
- Mackey & Gilmore (2003a) Mackey, A.D. & Gilmore, G.F. 2003a, MNRAS, 338, 85
- Mackey & Gilmore (2003b) Mackey, A.D. & Gilmore, G.F. 2003b, MNRAS, 338, 120
- Mackey & van den Bergh (2005) Mackey, A.D. & van den Bergh, S. 2005, MNRAS, 360, 631
- Mateo (1987) Mateo, M. 1987, ApJ, 323, L41
- Mighell et al. (1996) Mighell, K.J.,Rich, R.M., Shara, M. & Fall, S.M. 1996, AJ, 111, 2314
- Mighell et al. (1998) Mighell, K.J., Sarajedini, A. & French, R.S. 1998, AJ, 116, 2395
- Noyola & Gebhardt (2006) Noyola, E. & Gebhardt, K. 2006, AJ, 132, 447
- Piatti et al. (2005) Piatti, A.E., Santos Jr., J.F.C., Claria, J.J., Bica, E., Ahumada, A.V. & Parisi, M.C. 2005, A&A, 440, 111
- Rochau et al. (2007) Rochau, D., Gouliermis, D.A., Brandner, W., Dolphin, A.E. & Henning, T. 2007, ApJ, 664, 322
- Sabbi & Sirianni (2007) Sabbi, E., Sirianni, M., Nota, A., et al. 2007, AJ, in press (astroph/0710.0558)
- Sagar & Pandey (1989) Sagar, R. & Pandey, A.K. 1989, A&AS, 79, 407
- Santos & Piatti (2004) Santos, J.F.C.,Jr. & Piatti, A.E. 2004, A&A, 428, 79
- Trager et al. (1995) Trager, S.C., King, I.R. & Djorgovski, S. 1995, AJ, 109, 218
- van den Bergh (1981) van den Bergh, S. 1981, A&AS, 46, 79
- Wilson (1975) Wilson, C.P. 1975, AJ, 80, 175