Experimental investigation of a control scheme for a zero-detuning resonant sideband extraction interferometer for next-generation gravitational-wave detectors
Abstract
Some next-generation gravitational-wave detectors, such as the American Advanced LIGO project and the Japanese LCGT project, plan to use power recycled resonant sideband extraction (RSE) interferometers for their interferometer’s optical configuration. A power recycled zero-detuning (PRZD) RSE interferometer, which is the default design for LCGT, has five main length degrees of freedom that need to be controlled in order to operate a gravitational-wave detector. This task is expected to be very challenging because of the complexity of optical configuration. A new control scheme for a PRZD RSE interferometer has been developed and tested with a prototype interferometer. The PRZD RSE interferometer was successfully locked with the control scheme. It is the first experimental demonstration of a PRZD RSE interferometer with suspended test masses. The result serves as an important step for the operation of LCGT.
pacs:
04.80.Nn, 42.60.Da, 95.55.Ym
I Introduction
Presently several laser interferometer gravitational-wave detectors are in operation in the United States, (LIGOD. Sigg (2006) (LIGO Science Collaboration)), in Europe, (GEO600H. Lück, M. Hewitson, P. Ajith, B. Allen, P. Aufmuth, C. Aulbert, S. Babak, R. Balasubramanian, B. W Barr. S. Berukoff et al. (2006), and VIRGOF. Acernese, P. Amico, M. Al-Shourbagy, S. Aoudia, S. Avino1, D. Babusci, G. Ballardin, F. Barone, L. Barsotti, M. Barsuglia et al. (2006)), and in Japan, (TAMA300Ando and the TAMA Collaboration (2005)). In addition to the present detectors, there are plans to upgrade them to next-generation interferometers. Amongst them are Advanced LIGOP. Fritschel (2002) and LCGTK. Kuroda, M. Ohashi, S. Miyoki, D. Tatsumi, S. Sato, H. Ishizuka, M.-K. Fujimoto, S. Kawamura, R. Takahashi, T. Yamazaki et al (1999), which plan to use the power recycled resonant sideband extraction (RSE) technique to enhance detector sensitivities.
Despite the great advantage of being able to achieve better sensitivity by avoiding problems of thermal absorption by substrates, the RSE configuration poses a more difficult challenge in controlling the interferometer in order to use it as a gravitational-wave detector due to the increased number of degrees of freedom (DOF) that need to be controlled. Therefore, designing and demonstrating a control scheme as simple as possible are vital before the technique is adapted in large-scale interferometers such as LCGT. Recently a control of a power recycled detuned RSE has been demonstrated with a prototype experiment on the 40m interferometer at Caltech O. Miyakawa, R. Ward, R. Adhikari, M. Evans, B. Abbott, R. Bork, D. Busby, J. Heefner, A. Ivanova, M. Smith et al. (2006), and a zero detuned signal recycling has been demonstrated on the GEO600 detector S. Hild, H. Grote, M. Hewitson, H. Lück, J. R. Smith, K. A. Strain, B. Willke and K. Danzmann (2007). The difference between the RSE and the signal recycling is explained in detail in a paper such as S. Sato, S. Kawamura, K. Kokeyama, F. Kawazoe, and K. Somiya (2007).
We have developed a novel control scheme for LCGT S. Sato, S. Kawamura, K. Kokeyama, F. Kawazoe, and K. Somiya (2007), and have carried out experimental workF. Kawazoe, K. Kokeyama, S. Sato, O. Miyakawa, K. Somiya, M. Fukushima, N. Arai, S. Kawamura and A. Sugamoto (2006). This experiment aims to control a PRZD RSE interferometer using the scheme, and to measure the sensing matrix and compare it with modeling. The control scheme is described in section II, the experimental results are presented in section III, the results are shown in section IV, discussions are presented in section V, and finally the conclusion is presented in section VI.
II Control scheme
The control scheme consists mainly of two parts; the signal extraction scheme and the lock sequence.
II.1 Signal extraction scheme
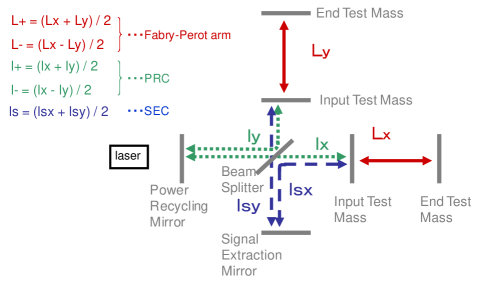
The power recycled RSE interferometer has five DOFs to be controlled as shown in Fig. 1. They are the average length and the differential length of the two Fabry-Perot (FP) arm cavities, , and , respectively, as indicated by arrows with solid lines, the average length and the differential length of the power recycling cavity (PRC), , and , respectively, as indicated by arrows with short dashed lines, and the average length of the signal extraction cavity (SEC), , as indicated by arrows with long dashed lines.
It is known from experience with present detectors which use the Pound-Drever-Hall (PDH) method R. W. P. Drever, J. L. Hall, F. V. Kowalski, J. Hough, G. M. Ford, A. J. Munley, and H. Ward (1983) that the arm cavities are relatively easy to control with clean control signals as the arm cavities have high finesse. On the other hand, it is expected to be quite challenging to obtain clean control signals of the central part of the RSE (i.e. , , and ), because the resonant conditions of the light fields inside the central part will be strongly affected by both the PRC and the SEC. Thus the length-sensing scheme has to be designed in such a way that it manipulates the resonant conditions of the light inside by properly designed cavity lengths and sideband frequencies.
The outline of the length-sensing scheme is as follows: It is based on the PDH method. The FP arm cavity lengths are controlled with a single modulation-demodulation technique and the central part of the RSE is controlled with a double modulation-demodulation technique with amplitude modulation (AM) sidebands and phase modulation (PM) sidebands. By using the double modulation-demodulation technique, the control signals for the central part will be affected very little by the signals derived from the carrier which are dominated by the FP arm cavities. This is because both the AM and the PM modulation sideband frequencies are designed in such a way that they are not resonant in the FP arm cavities; thus it decouples the FP arm cavities and the central part.
II.1.1 The central part
The central part is designed so that the AM and the PM sidebands behave in the following way: The lengths of two paths that compose the Michelson interferometer have a macroscopic asymmetry such that when the carrier interferes destructively at the dark port (DP), the AM sidebands interfere constructively at the bright port (BP) and destructively at the DP, while the PM sidebands interfere destructively at the BP and constructively at the DP. Thus the AM sidebands “reflect completely” from the Michelson part while the PM sidebands “transmit completely” through the Michelson part. This condition is met when the round trip Michelson asymmetry length is designed to be equal to for the PM sidebands, where is the speed of light, and is the modulation freqency, and integer multiple of for the AM sidebands. In our design it is for the AM sidebands and for the PM sidebands. The two cavities’ macroscopic lengths are designed so that the AM sidebands resonate inside the PRC and the PM sidebands resonate inside the compound cavity made of the PRC and the SEC. This enables the PM sidebands to be sensitive to the length of the SEC while the AM sidebands are not affected by the SEC length, thus ensuring independent control signals for and .
II.1.2 The whole RSE
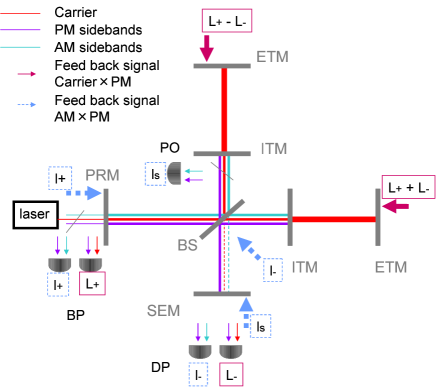
Figure 2 shows how the control signals of the prototype RSE interferometer are obtained. The control signal is obtained at BP and is fedback to the end test masses (ETM), the control signal is obtained at DP and is fedback to the ETMs. The control signal is obtained at DP and is fedback to the beam splitter (BS), the control signal is obtained at the BP and is fedback to the power recycling mirror (PRM), and the control signal is obtained at the pick-off port (PO) and is fedback to the signal extraction mirror (SEM).
Table 1 shows the theoretical length sensing signal matrix. The signals are at DC. It is calculated with parameters used for the prototype RSE interferometer, of which there will be a detailed explanation in section III. Demodulation phases are chosen so that each main signal (i.e. the signal that should be obtained at the corresponding detection port) is maximized. The first from the left column shows the detection ports; SD and DD stand for single/double modulation-demodulation, respectively, and the top first row shows the DOFs. The values along the same row are normalized by each main signal. The and signals are dominant at BP and DP, respectively, due to the designed high finesse of the Fabry-Perot arms, indicating they are relatively easy to obtain. On the other hand, it is obvious from the matrix that and signals mix at both BP and PO. However, the degree to which they mix is such that linearly independent signals can be obtained. Also signals that mix with the main signals on the DD systems are relatively small due to the fact that the carrier is not used for them. 111One thing to note is that the amplitude of the signal which mixes at the PO(DD) system is comparable to the main signal . Simulation demonstrates that this is because the macroscopic length of the arm cavity is such that the AM sidebands are not very far from the resonance peaks of the cavity. When choosing the length the size of the existing camber limited the freedom of choosing the best possible design, and so the optimum design is a compromising one. Therefore the size of the unwanted signal can be reduced by choosing the right length of the FP arm cavity, thus it will not be a problem in a real detector such as LCGT. This is necessary to bring the interferometer from an uncontrolled state to a controlled state. Therefore the designed control scheme is a promising approach for acquiring the control.
| BP(SD) | 1 | 8.2 | -2.6 | 6.4 | 1.3 |
|---|---|---|---|---|---|
| DP(SD) | -9.2 | 1 | 5.9 | 1.3 | 8.6 |
| BP(DD) | -4.9 | -1.1 | 1 | -8.6 | -5.3 |
| DP(DD) | -1.0 | 7.6 | 1.4 | 1 | 1.1 |
| PO(DD) | -1.5 | -1.2 | 1.1 | -2.2 | 1 |
II.2 Lock sequence
Up until this point we had assumed that the interferometer is close to its operating point; therefore feedback signals for all the DOFs are always present for the control system to work properly. In reality the uncontrolled interferometer is not near its operating point most of the time, therefore feedback signals for all the DOFs are almost never present simultaneously. In order to successfully lock the interferometer, a sequence of locking needs to be established. Here we show one possible order of locking the whole interferometer with simulation work results. FINESSE A. Freise (2008) is used for the calculation. The sequence is as follows:
-
1.
Lock the central part
-
(a)
Lock DOF
-
(b)
Lock DOF
-
(c)
Lock DOF
-
(a)
-
2.
Lock the FP arm cavities
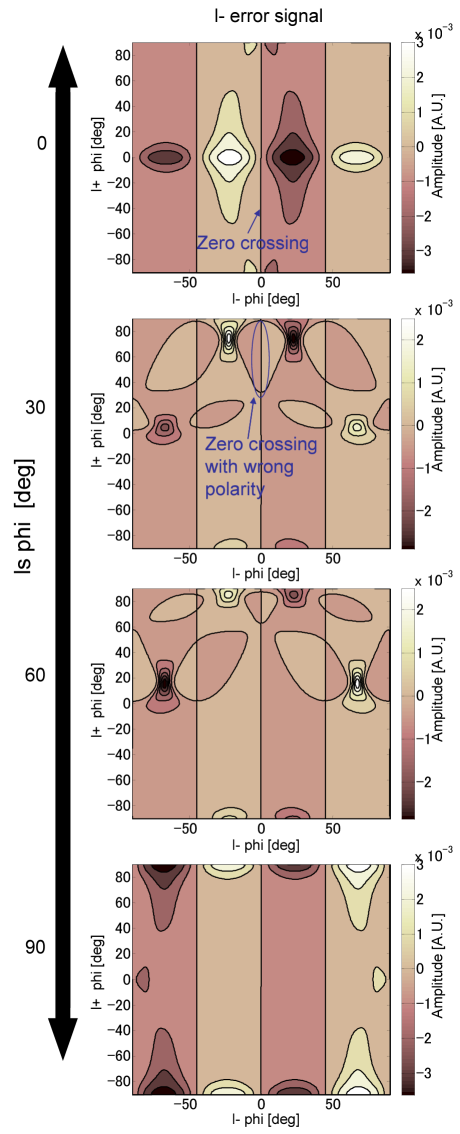
Figure 3 shows the feedback signal of the DOF when the other two DOFs in the central part are free of control. Here the FP arms are not assumed to be present for simplicity. The plots are contour plots of the error signal for the DOF when the other two DOFs are uncontrolled, i.e. the microscopic position of the SEM expressed in the phase gained by the light (hereinafter called phi) is scanned from its operating point by 0, 30, 60, and 90 degrees as indicated by the vertical arrow, while the PRM’s phi is scanned from its operating point by -90 to 90 degrees in the direction of the y-axis. The x-axis shows the phi of the DOF, with the being the operating point. On the right of each plot there is a color bar that shows the signal amplitude.
The DOF can be locked to where the amplitude of the error signal changes its sign at the so-called zero crossing. A clear vertical line of a zero crossing is present at the operating point in the top figure when the and the DOFs happen to be at their operating points, (i.e. their phi are zero). The polarity of the zero crossing needs to be taken into account; in this case the right polarity is the one that goes from plus to minus as the phi is moved from minus to plus. With the wrong polarity the error signal does not guide the DOF to be locked at the operating point. A zero crossing line at the operating point having the wrong polarity is seen as the phi of the DOF is scanned between 0 to 90 degrees. One such example is marked by the ellipse in the figure. According to the simulation results the chance of such a line being present is 30% at the maximum. This indicates that most of the time (with a minimum chance of being 70%) when the other two DOFs are completely free of control, (i.e. their detunings are scanned independently from each other), the DOF can be locked at its operating point.
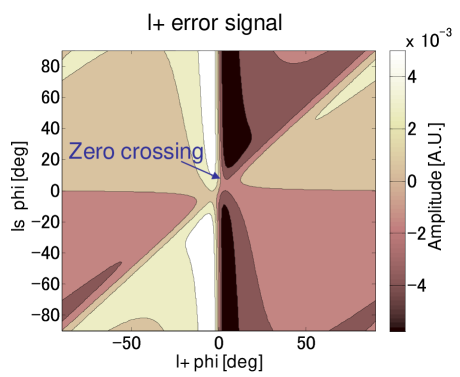
Then, with the assumption that the is now locked at its operating point, the feedback signal of the DOF is shown in Fig. 4 when the is still free of control so it could be anywhere in the y-axis. In the same manner as in Fig. 3, it is clear that a zero crossing for the is present very close to its operating point regardless of the ’s phi detuning. Therefore the DOF can be locked at its operating point. When this is the case, the zero crossing line of the DOF is always present as shown in the top plot of Fig. 3, so the lock of the DOF becomes stable.
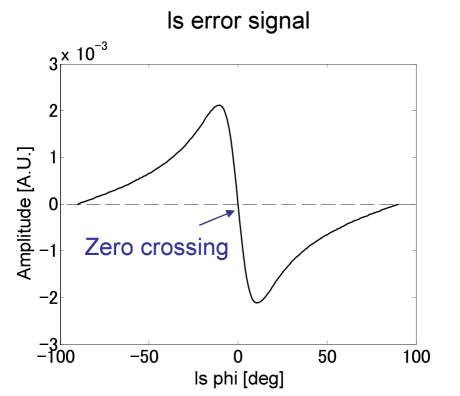
Next, along with the assumption that the is locked, there is a new assumption that the is locked at its operating point, a feedback signal of the DOF is shown in Fig. 5. The figure shows that a zero crossing point is present at its operation point as marked by the arrow. In this way the central part is locked at its operating point.
This is a good approximation because the chance that the carrier is resonant inside the FP arm cavities and thus disturbs the central part length sensing signals is very small because of the high finesse, and the chance that the sidebands are accidentally resonant inside the FP arm cavities is very small for the same reason.
Next the FP arms are locked by acquiring the lock of the individual FP arm whose control signal is always present and dominant at each detection port for each FP arm cavity. Once the two FP arm cavities are locked, the control servos can be switched to those of the and DOF to change them into the controls of and DOFs simultaneously. Therefore the FP arms are locked. Thus the whole RSE interferometer can be locked in this order.
III Experimental demonstration of a control of the PRZD RSE
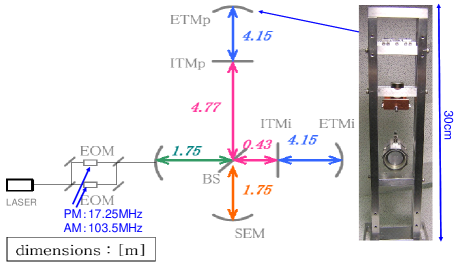
III.1 4m Prototype interferometer
Figure 6 shows the optical layout of the prototype interferometer. A light at 1.064 m from a Nd:YAG laser enters a Mach-Zehnder interferometer (MZ) where two Pockels cells are placed in different paths of the MZ and it is phase modulated at 17.25 MHz and amplitude modulated at 103.25 MHz. Light power at the output of the MZ is 90 mW with modulation depths of approximately 0.15 rad for both frequencies. The FP arm cavity length is 4.15m and is formed by a flat input mirror and a curved end mirror with a radius of curvature of 6m. Two mode-matching lenses are used for the FP arm cavities and an additional two are used to compensate for the mismatch due to the relatively large Michelson macroscopic length asymmetry (4.35 m). A coupling ratio between the incident beam and the fundamental mode of the FP arm cavity of more than 98% is achieved. The finesse of the cavity is approximately 120. All of the seven test masses (diameter 2.54cm) are suspended as double pendulums (height 30cm) to suppress the mirror motion at frequencies above the resonant frequency (at about 1.5Hz). The test mass motion around its resonant frequency is damped by an eddy-current damping system. The length control is performed via coil-magnets actuators.
III.2 Lock Sequence
The lock of the RSE has been successfully demonstrated. The sequence that has been determined with the simulation work is used; the central part first then the FP arm cavities next. The direct lock of the FP arm cavities’ two DOFs, the common, , and the differential, , has been realized without one additional step (locking the individual arms with each control signal, then switch the control servos for those of the common and the differential control). This is because often one of the two FP arm cavities is locked with the control signal for the DOF first, and as soon as the other FP arm cavity’s DOF is close to its operating point the DOF is controlled, consequently switching the control signal to lock the DOF. Typically the time interval between the lock of one FP arm cavity and both cavities is less than a second.
We define several lock states, which are shown in Fig. 7. Each state is indicated as follows:
-
•
State 0 : The interferometer is uncontrolled.
-
•
State 1 : Michelson is locked to dark fringe at the DP.
-
•
State 2 : Power-recycled Michelson is locked.
-
•
State 3 : Central part is locked.
-
•
State 4 : Tuned RSE is locked
In state 2, the carrier is anti-resonant inside the PRC. In order for the carrier to be resonant inside the PRC, the phase needs to be shifted by inside the PRC, which happens when the carrier is resonant inside the FP arm cavities as in state 4. Figure 8 shows the DC power detected at various ports, (i.e. DP, BP, PO, transmitted port for the inline FP arm cavity and for the perpendicular FP arm cavity). Each lock state is separated by boxes with colors specified in Fig. 7, and on top of each box the state number is shown. The start time of each state is defined as the time when the switch of a servo loop of each DOF is turned on. Typically each DOF is locked within a fraction of a second after the servo loop is switched on. Between the time 10 and 20 sec, the DOF is not locked the whole time. This is because the carrier is not yet anti-resonant inside the PRC and disturbs the control signal of the DOF. When the servo loop is switched on at time 20 sec, the carrier is anti-resonant inside the PRC and the DOF is completely locked as well as the DOF. The difference between states 2 and 3 is not obvious from the DC signals, due to the relatively small size of the modulation sidebands compared to that of the carrier. The sharp peaks seen between time 20 and 40 sec can be explained as follows: The carrier light is sometimes resonant in one of the two arms, consequently adding a relative phase shift of between the two beams interfering at the BS. This will switch the DP into BP, and vice versa, so the DP is no longer dark. Note that the corresponding peaks in light transmitted from the FP arm cavities are too small to be seen in the plots.
In order to verify the locking status, resonant conditions for the two sets of sidebands are monitored with optical spectrum analyzers (OSA) placed at the DP and the PO. Figure 9 shows the output of the optical spectrum analyzers. The upper three plots show the output power at the PO and the bottom three show the output power at the DP. Colored boxes indicate the lock state, as specified in Fig. 7. In state 1, neither the AM nor the PM sidebands are resonant. In state 2, the AM sidebands are resonant inside the PRC, thus there are resonant peaks of the AM sidebands detected at the PO. The PM sidebands are not yet resonant. In state 3, the PM sidebands are resonant inside the compound cavity made of the PRC and the SEC thus there are resonant peaks of the PM sidebands detected at the DP. Each cavity length is controlled throughout the locking process.
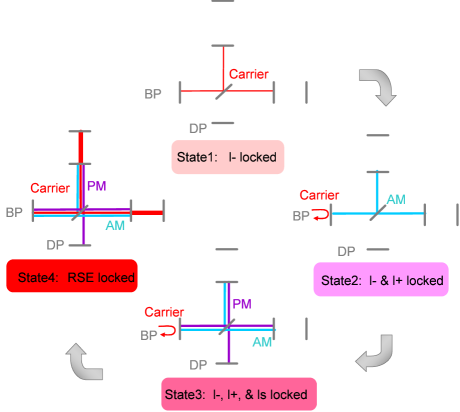
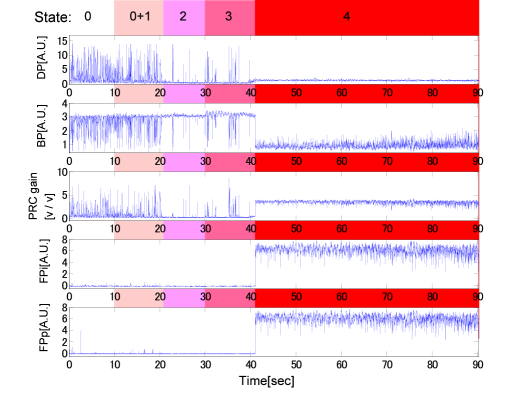
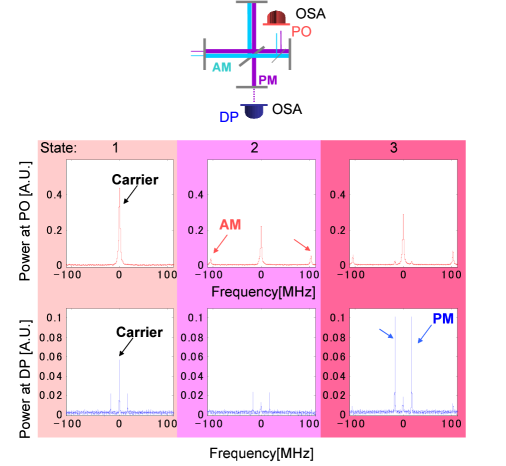
Table 2 shows the measured length sensing signal matrix, normalized by the main signals at each detection port. Demodulation phases are tuned to maximize the main signal at each detection port. A sinusoidal signal is applied to a feedback path of each DOF to move the test masses. The signal frequency (at 2.2 kHz) is well above the unity gain frequency of all the control servo so that loop gains do not have to be taken into account. The frequency is also well below the cut-off frequency of the optical response of the RSE (at about 1 MHz), so the values can be directly compared with the theoretical DC values.
The general pattern of the measured matrix is in good agreement with the theoretical one; the signals dominate at their detection ports, the and the mix at BP and PO but the signals are linearly independent, and the signals that mix at DD systems are relatively small. In general, unwanted signals other than the one that should be obtained at the corresponding detection ports tend to be greater than the theoretical values due to present imperfections such as the unwanted carrier light at the DP. It is not essential for this experiment where agreement in the overall feature of the matrix is of importance in order to verify the control scheme.
| BP(SD) | 1 | 4.5 | 4.8 | -1.9 | -1.3 |
|---|---|---|---|---|---|
| DP(SD) | -1.9 | 1 | -2.1 | -4.9 | -1.5 |
| BP(DD) | -1.2 | 6.6 | 1 | 1.8 | -5.0 |
| DP(DD) | -1.1 | -3.1 | 1.1 | 1 | 1.2 |
| PO(DD) | -1.1 | 2.2 | 4.0 | 5.1 | 1 |
IV Results
The lock of the PRZD RSE has been successfully demonstrated with the prototype interferometer. It is the first experimental demonstration of a PRZD RSE interferometer with suspended test masses. In parallel the control sequence has been established with a simulation. The measured signal matrix showed good agreement with modeling.
V Conclusion
A new control scheme has been developed for LCGT, and a PRZD RSE interferometer has been successfully controlled with the scheme. This result has shown that the LCGT can use a PRZD RSE interferometer as its optical configuration and use our control scheme to lock the interferometer. This is one important step towards the successful operation of the LCGT detector.
Acknowledgements.
This research is supported in part by a Grant-in-Aid for Scientific Research on Priority Areas (415) of the Ministry of Education, Culture, Sports, Science, and Technology of Japan, and also partially supported by the US National Science Foundation under cooperative agreement PHY-0107417.References
- D. Sigg (2006) (LIGO Science Collaboration) D. Sigg (LIGO Science Collaboration), Class. Quantum. Grav. 23, 51 (2006).
- H. Lück, M. Hewitson, P. Ajith, B. Allen, P. Aufmuth, C. Aulbert, S. Babak, R. Balasubramanian, B. W Barr. S. Berukoff et al. (2006) H. Lück, M. Hewitson, P. Ajith, B. Allen, P. Aufmuth, C. Aulbert, S. Babak, R. Balasubramanian, B. W Barr. S. Berukoff et al., Class. Quantum. Grav. 23, 71 (2006).
- F. Acernese, P. Amico, M. Al-Shourbagy, S. Aoudia, S. Avino1, D. Babusci, G. Ballardin, F. Barone, L. Barsotti, M. Barsuglia et al. (2006) F. Acernese, P. Amico, M. Al-Shourbagy, S. Aoudia, S. Avino1, D. Babusci, G. Ballardin, F. Barone, L. Barsotti, M. Barsuglia et al., Class. Quantum. Grav. 23, 63 (2006).
- Ando and the TAMA Collaboration (2005) M. Ando and the TAMA Collaboration, Class. Quantum. Grav. 22, 881 (2005).
- P. Fritschel (2002) P. Fritschel, Proc. SPIE Int. Soc. Opt. Eng. 4856, 282 (2002).
- K. Kuroda, M. Ohashi, S. Miyoki, D. Tatsumi, S. Sato, H. Ishizuka, M.-K. Fujimoto, S. Kawamura, R. Takahashi, T. Yamazaki et al (1999) K. Kuroda, M. Ohashi, S. Miyoki, D. Tatsumi, S. Sato, H. Ishizuka, M.-K. Fujimoto, S. Kawamura, R. Takahashi, T. Yamazaki et al, Int. J. Mod. Phys. D 8, 557 (1999).
- O. Miyakawa, R. Ward, R. Adhikari, M. Evans, B. Abbott, R. Bork, D. Busby, J. Heefner, A. Ivanova, M. Smith et al. (2006) O. Miyakawa, R. Ward, R. Adhikari, M. Evans, B. Abbott, R. Bork, D. Busby, J. Heefner, A. Ivanova, M. Smith et al., Phys. Rev. D 74, 022001 (2006).
- S. Hild, H. Grote, M. Hewitson, H. Lück, J. R. Smith, K. A. Strain, B. Willke and K. Danzmann (2007) S. Hild, H. Grote, M. Hewitson, H. Lück, J. R. Smith, K. A. Strain, B. Willke and K. Danzmann, Class. Quantum. Grav. 24, 1513 (2007).
- S. Sato, S. Kawamura, K. Kokeyama, F. Kawazoe, and K. Somiya (2007) S. Sato, S. Kawamura, K. Kokeyama, F. Kawazoe, and K. Somiya, Phys. Rev. D 75, 082004 (2007).
- F. Kawazoe, K. Kokeyama, S. Sato, O. Miyakawa, K. Somiya, M. Fukushima, N. Arai, S. Kawamura and A. Sugamoto (2006) F. Kawazoe, K. Kokeyama, S. Sato, O. Miyakawa, K. Somiya, M. Fukushima, N. Arai, S. Kawamura and A. Sugamoto, J. Phys.: Conf. Series 32, 380 (2006).
- R. W. P. Drever, J. L. Hall, F. V. Kowalski, J. Hough, G. M. Ford, A. J. Munley, and H. Ward (1983) R. W. P. Drever, J. L. Hall, F. V. Kowalski, J. Hough, G. M. Ford, A. J. Munley, and H. Ward, Appl. Phys. B 31, 97 (1983).
- A. Freise (2008) A. Freise, http://www.rzg.mpg.de/ adf/ (2008).