STEREO/SECCHI Stereoscopic Observations Constraining the Initiation of Polar Coronal Jets
Abstract
We report on the first stereoscopic observations of polar coronal jets made by the EUVI/SECCHI imagers on board the twin STEREO spacecraft. The significantly separated viewpoints ( 11∘ ) allowed us to infer the 3D dynamics and morphology of a well-defined EUV coronal jet for the first time. Triangulations of the jet’s location in simultaneous image pairs led to the true 3D position and thereby its kinematics. Initially the jet ascends slowly at 10-20 and then, after an apparent ’jump’ takes place, it accelerates impulsively to velocities exceeding 300 with accelerations exceeding the solar gravity. Helical structure is the most important geometrical feature of the jet which shows evidence of untwisting. The jet structure appears strikingly different from each of the two STEREO viewpoints: face-on in the one viewpoint and edge-on in the other. This provides conclusive evidence that the observed helical structure is real and is not resulting from possible projection effects of single viewpoint observations. The clear demonstration of twisted structure in polar jets compares favorably with synthetic images from a recent MHD simulation of jets invoking magnetic untwisting as their driving mechanism. Therefore, the latter can be considered as a viable mechanism for the initiation of polar jets.
1 Introduction
Polar coronal jets are collimated transient ejections of plasma occurring in polar coronal holes. They were discovered in soft X-rays by SXT on Yohkoh (see Shibata et al. (1996) for a review of the SXT results). Recent Hinode jet observations revealed a higher occurrence frequency than previously believed (Cirtain et al. 2007). The new Hinode observations allowed to determine the statistical properties of jets (Savtseva et al. 2007), and to deduce their line of sight velocities and densities (Ciphor et al. 2007; Culhane et al. 2007 ; Kamio et al. 2007; Moreno Insertis, Galsgaard Ugarte-Urra 2008).
Polar jets are believed to occur when reconnection between small scale, pre-existing or emerging, closed magnetic fields and the open large scale magnetic field of the coronal holes take place, in the so-called anemone-jets model (e.g. the 2D simulations Yokoyama & Shibata 1996). These numerical simulations, and the recent 3D one of Moreno Insertis et al. (2008) were successful in reproducing several key observational aspects of polar jets such as their speeds and temperatures and their characteristic inverted shape (e.g. Shibata et al. 1996). However, these simulations could not account for the important observation that a fraction of jets seems to exhibit helical structure and untwisting (e.g., Shimojo et al. 1996; Canfield et al. 1996 ; Pike Mason 1998; Wang et al. 1998; Wilhelm, Dammasch Hassler 2002; Jiang et al. 2007; Filippov, Golub Koutchmy 2008).
A 3D model of polar jets has been recently proposed by Pariat, Antiochos Devore (2008), (hereafter PAD08), with magnetic twist being the jet driver (see also Shibata Uchida (1986) for a 2D twist model). Here we give only a brief description of the model and its results. In this simulation, a vertically oriented magnetic dipole, embedded below the photosphere, generates a null point in a corona which also contains a uniform-background vertical magnetic field. The resulting axisymmetric configuration contains two distinct flux systems: a circular patch of strong closed magnetic flux surrounded by weaker open flux, leading to an axissymetric configuration.
Slow horizontal motions, reaching a maximum of about 1 of the local Alfvén speed at the line-tied photospheric feet of the closed magnetic flux are applied, thereby twisting the closed field. The applied flow field conserves the distibution of the vertical magnetic field and thus the axisymmetry, with an almost solid body rotation of the closed flux. Initially, the closed system responds quasi-statically to those boundary motions by slowly growing vertically. Eventually a kink-like instability occurs which breaks the intitial symmetry. This triggers reconnection at the null-point and generates a massive jet with a speed at a fraction of the local Alfvén speed. The fact that reconnection remains dormant for a significant ammount of time is an attractive element of the PAD08 model, since this allows a significant energy build-up before the generation of a massive and impulsive jet.
More importantly the model produces a non-linear torsional wave propagating outwards, which supplies a continuous energy source for accelerating the jet to large distances. The wave is due to the release of most of the twist accumulated in the closed field region. Given that, in the corona, the plasma is frozen-in to the magnetic field, the resulting torsional wave could be traced by a helical structure undergoing untwisting while the jet is lifting off. A significant amount ( 90 ) of the helicity of the overall configuration is ejected with the jet. Note finally that more recent simulations with non-axisymmetric configurations (with an inclined coronal field) lead to quantitatively the same behavior (Pariat et al. 2008 in preparation).
However, we do not know whether helical structures seen in some jet observations are ’real’ or they result from projection effects introduced in single viewpoint observations. And what about the true kinematic behavior of jets? Up to now, all jet velocity determinations were made from a single viewpoint thereby determining a projected component on the plane of the sky only. These important issues can only be addressed by using better constraints on the geometry of the observed jets. STEREO observations, with their two viewpoints, are thus perfectly suited to address these questions. This Letter presents the first stereoscopic observations of polar coronal jets. We determined the 3D kinematic evolution of a well-observed jet and studied its morphology and more specifically its helical structure, how it differs in different vantage point and finally compared it with synthetic images from the PAD08 model.
2 Observations and Data Analysis
We analyzed the observations of a polar jet seen by the 2 STEREO spacecraft (hereafter A and B) over a northern polar coronal hole on June 7 2007 around 05:00 UT. The spacecraft separation was . We focus here on the images collected by the Extreme Ultraviolet Imaging Telescope (EUVI) of the SECCHI (Wuelser et al. 2004; Howard et al. 2007) suite of instruments (the jet was also observed in the outer corona with the COR1 and COR2 coronagraphs). EUVI takes full disk images in EUV channels centered around 171, 195, 284 and 304 Å (hereafter 171, 195, 284 and 304). EUVI has 1.6 arcsec pixels and our observations have a cadence of 2.5, 10 and 20 minutes for 171, 195-304 and 284, respectively. The low-cadence of the 284 data did not allow us to observe the generation of the jet.
We processed the images with the secchi_prep routine. Then, each synchronized image pair 111Since there are different light travel times for A and B, EUVI image pairs are taken with a time difference which ensures they correspond to the same time on the Sun, i.e. they are synchronized. was co-aligned with the routine scc_stereopair. This included scaling of both images to the same pixel size, shifting to a common center and rolling to a common plane defined by the Sun center and the locations of the 2 spacecraft. Comparison of the limb locations (routine euvi_coalign) and housekeeping data from the SECCHI Guide Telescope lead to uncertainties in the co-alignment of image pairs of less than a pixel.
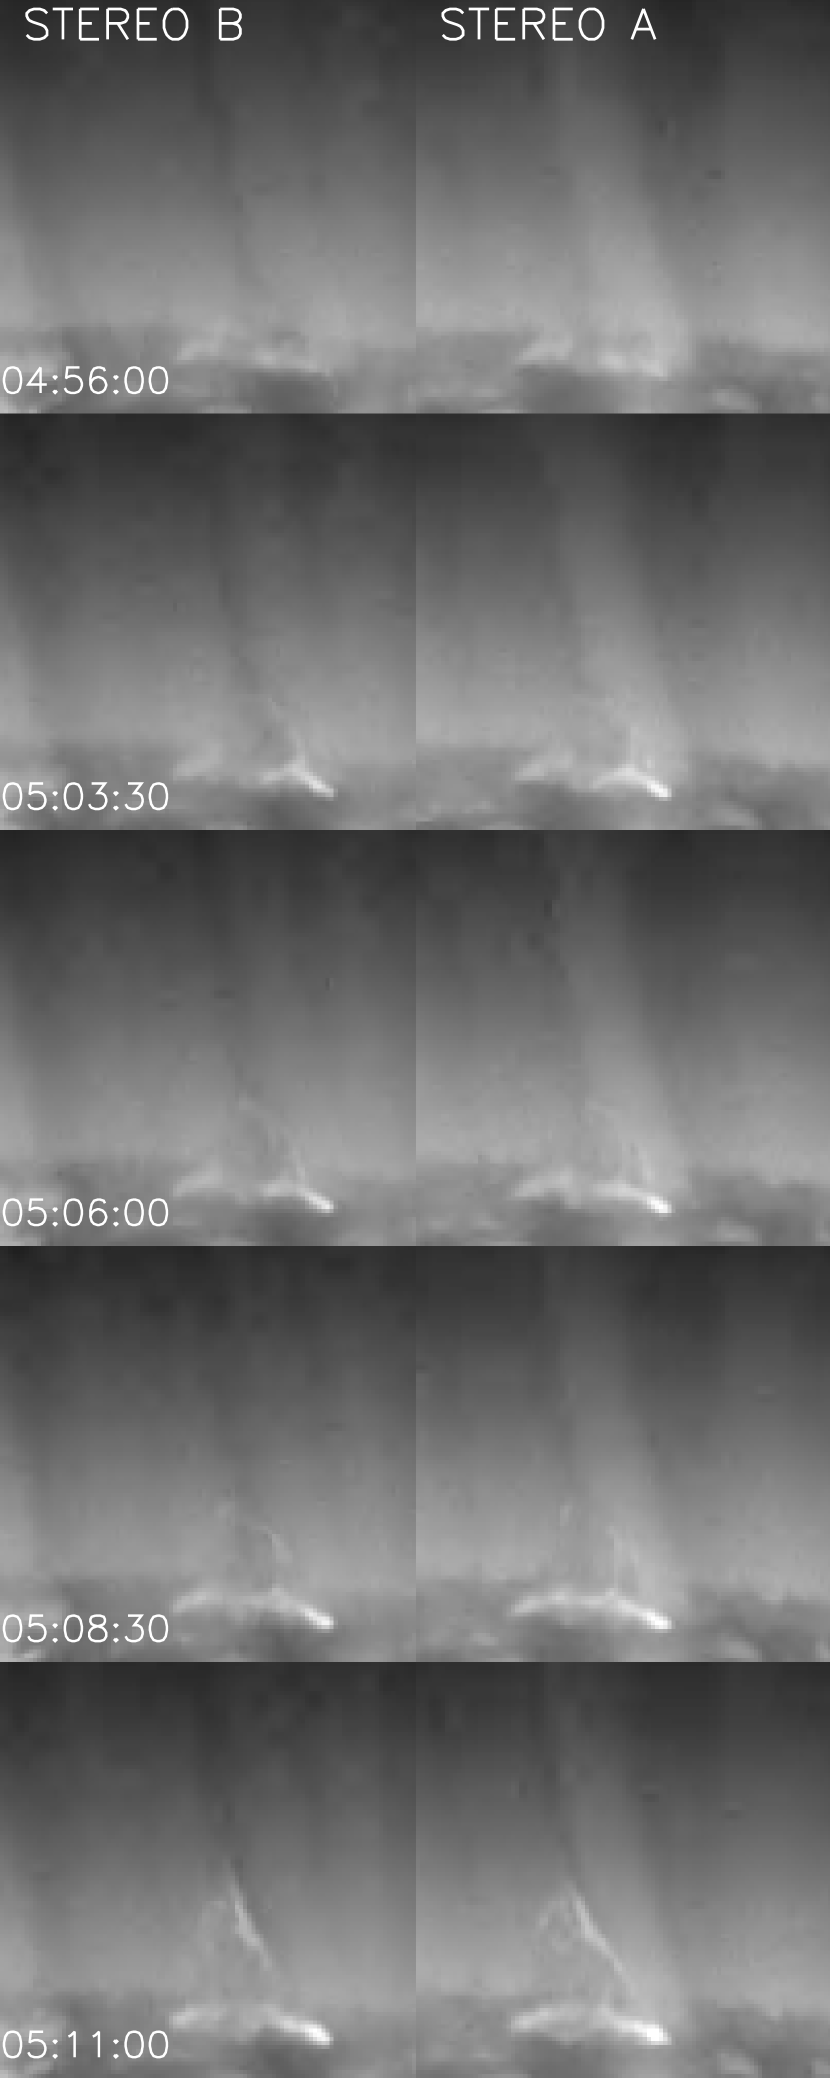
Figure 1 has synchronized image pairs of the jet in the 171 (see also the movies in the 171 and 195; video1.mpg and video2.mpg). Figure 1 and the associated movies show that the jet takes place in a configuration which includes two bright points. The western-most bright point starts to slowly extend upwards at around 04:30, something that can be better seen in the 195. Then, at around 04:55 a brightening takes place at the base of this bright point and its structure starts to rise at a faster rate. Sometime between 05:08 and 05:11 the rising structure appears to ’jump’ towards the left bright point and a jet, with the typical inverted is formed. The base of the jet, corresponding to the initial location of the two bright points, exhibits an intense brightening.
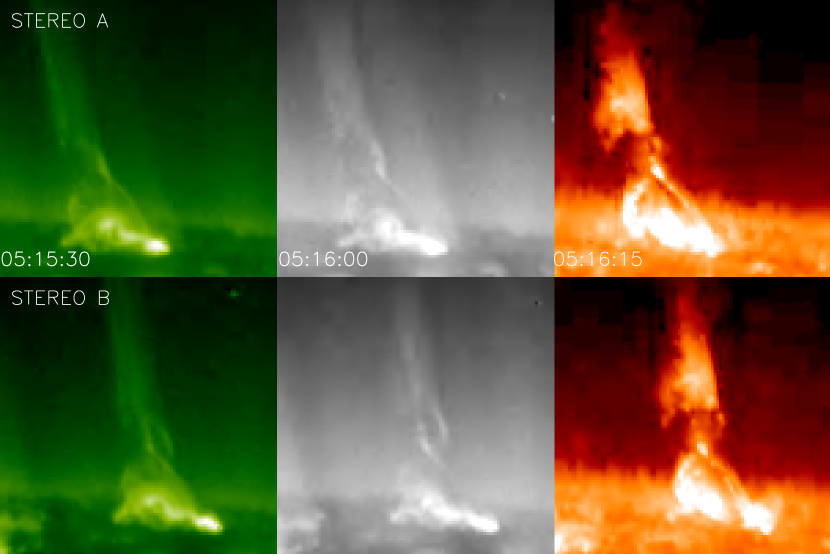
The jet develops an apparent helical structure in the last image pair of Figure 1 which appears similar on both spacecraft. However, in the next, almost simultaneous image pairs in 195, 171 and 304, the situation is markedly different (Figure 2). The body of the jet seems to be viewed face-on in A and edge-on in B and appears to untwist while rising. Therefore, what we observe could be a left-handed double helix for which we see both threads in A whereas we see them apparently crossing in B. These significant differences in the appearance of the jet between in A and B are also visible in the next image pair in the 171, before the jet merges with the background, as it rapidly expands outwards by seemingly untwisting. Both the helical jet body and its base appear very similar in 171 and 195, while small but noticeable differences can be seen in the 304. This implies that the jet contains both cool ( 80000 K; 304) and warm plasmas ( 1-1.5 MK; 171 and 195).
Previous single-viewpoint inferences of helical structure in jets were always susceptible to line of sight effects which could lead to false conclusions. This is the first time that such a conclusive observation on the existence of helical structures in jets is made. The wave-like motions we observed could be related to the transverse oscillations detected in some jets (Cirtain et al. 2007), spicules (De Pontieu et al. 2007) and prominences (Okamoto et al. 2007).
Next we studied the 3D kinematics of the jet. We first visually identified the tie-points of the jet-front (i.e. the image pixel coordinates) in synchronized image pairs in 171 and 195, and repeated this process 10 times for each considered image pair. Triangulation of those locations (routine scc_triangulate; see Inhester (2006) for the basics of triangulation and stereoscopy) supplied the 3D coordinates (x,y,z) and the heliocentric distance of the jet front as a function of time. We then calculated the averaged radial distance of the jet as a function of time , , and the corresponding standard deviation (supplying an estimate of the error bars) for the 10 tie-point selections for every considered image pair.
Figure 3 contains (upper panel) and the temporal evolution of radial velocity of the jet (lower panel) determined by numerical derivation of with respect to . This plot provides the ’true’ distance and velocity of the jet as opposed to determinations from a single viewpoint which give access to a fraction of those quantities only. As can be seen in Figure 3 there are 2 phases in the kinematic evolution of the jet: an initial phase () during which the jet ascends very slowly at 10-20 (note that for this phase we used data from the 195 because of the better visibility of the jet in this line) followed by a phase of impulsive acceleration () when the jet speeds up to 300 . Such two-phase kinematic behavior is characteristic of quasi-statically driven MHD systems which eventually become instable. The maximum speed of the jet is a substantial fraction of the Alfvén speed in the corona. The corresponding accelerations, calculated from the second derivative of with respect to , exceeded the solar gravity.
The deduced coordinates of the jet allowed us to trace its trajectory in 3D. Figure 4 has the jet trajectory corresponding to the phase of rapid acceleration (i.e. the last 6 points of Figure 3). The most striking feature is the abrupt change in the jet plane from point 4 to point 5 of its orbit, before following an almost vertical path in points 5 and 6. This change is correlated with the apparent ’jump’ of the jet seen in the images and the movies around 05:08 (4th row of Figure 1), thereby suggesting that a kink-like instability may have taken place.
3 Discussion and Conclusions
Our stereoscopic observations present the first conclusive evidence of helical structures in polar jets. This lends significant support to the PAD08 model, in which jets are driven by magnetic untwisting, and predict the development of a clear helical structure.
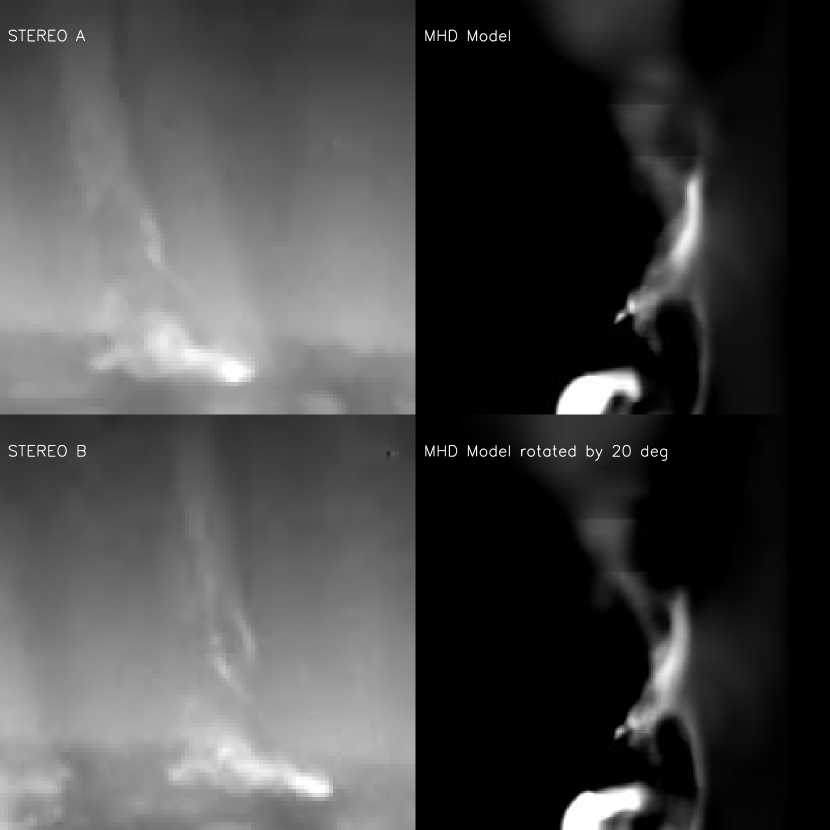
For a more quantitative comparison between the helical jet structure of our observations and the PAD08 simulations we produced synthetic images from the latter. Results from a jet simulation having a inclination of the volume coronal field (relatively to the vertical; see PAD08) were used. We constructed synthetic images by integrating the square of the electron density from the MHD simulation, along horizontal lines of sight (orthogonal to the direction of the jet). This emulates the EUV emission that EUVI records which is proportional to the line of sight integral of . Temperature effects entering into the determination of EUV intensities, through the temperature-dependent instrumental response function, were not taken into account. This assumption is likely to be acceptable, because the instrumental temperature response functions are rather narrow, tending to select quite isothermal plasmas and we have shown that the jet has similar morphology in 3 different EUVI channels (Figure 2). Synthetic images are given in the right column of Figure 5. The two simultaneous images correspond to two viewpoints separated by 20 degrees, i.e. the second image was constructed by rotating the simulation box by 20 degrees about the z-axis. The images correspond to a snapshot of the PAD08 simulation, shortly after the helical structure started to develop. We note that while in the top right image of Figure 5 two threads can be seen, the bottom right image shows two crossing threads, very similar to the face-on and edge-on views of the jet from A and B in the left column of the same Figure respectively.
The field lines of the PAD08 model from the selected snapshot have 1.1 turns or equivalently a twist of 2.2 , a value that should approximate the amount of twist present in the observed jet, given the similarity between the synthetic and observed images in Figure 5. This amount of twist is a lower limit on the total twist applied to the observed configuration during the initial slow evolution phase jet since there seems that significant twist is left over at the base of the jet. The fact that a wider viewpoint separation has to be applied to the simulation results in order to obtain a similar jet morphology with respect to the observations is not surprising. The MHD simulations starts with a relatively high degree of symmetry compared to what may be expected for the ’real’ Sun.
From the above comparison we conclude that magnetic twist is a viable candidate for the initiation of polar jets. Moreover the kinematics of the jet, with the slow rise phase, followed by a ’jump’ and rapid acceleration to a fraction of the Alfvén speed are also consistent with the twist model of PAD08. However, similar kinematic behavior results from models that do not invoke twist as their driver (e.g., Yokoyama & Shibata 1996; Moreno Insertis et al. 2008). It seems, therefore, that the jet morphology can be the most sensitive discriminator between different initiation mechanisms. We finally note that SXT observations showed that about 10 of jets exhibit helical structure and untwisting (Shimojo et al. 1996). Whether this fraction is a lower limit, due to the relatively low spatial resolution of the SXT observations, should await detailed statistical studies of the higher spatial resolution data from Hinode and SECCHI.
The SECCHI data used here were produced by an international consortium of the Naval Research Laboratory (USA), Lockheed Martin Solar and Astrophysics Lab (USA), NASA Goddard Space Flight Center (USA), Rutherford Appleton Laboratory (UK), University of Birmingham (UK), MaxPlanckInstitut for Solar System Research (Germany), Centre Spatiale de Liège (Belgium), Institut d’ Optique Théorique et Appliqueé (France), and Institut d’Astrophysique Spatiale (France). We thank the referee for useful comments.
References
- (1) Alexander, D. Fletcher, L. 2000, Sol. Phys., 190, 167
- (2) Canfield, R. C., Reardon, K. P., Leka, K. D., Shibata, K., Yokoyama, T., Shimojo, M. 1996, ApJ, 464, 1016
- (3) Cirtain, J. W. et al. 2007, Science, 318, 1582
- (4) Culhane, L. et al. 2007, PASJ, 59, 751
- (5) De Pointieu B. et al. 2007, Science, 318, 1574
- (6) Filippov, B., Golub, L. Koutchmy, S. 2008, eprint arXiv:0711.4320
- (7) Jiang, Y. C., Chen, H. D., Li, K. J., Shen, Y. D., Yang, L. H. 2007, AA, 469, 331
- (8) Chifor, C., Young, P. R., Isobe, H., Mason, H. E., Tripathi, D. Hara, H. Yokoyama, T. 2008, AA Letters, in press
- (9) Harrison, R. A., Bryans, P. Bingham, R. 2001, AA, 379, 324
- (10) Howard, R., et al. 2008, Space Sci. Rev., in press
- (11) Inhester, B. 2006, preprint (astro‐ph/0612649)
- (12) Kamio, S. et al. 2007, PASJ, 59, 757
- (13) Moreno-Insertis, F., Galsgaard, K. Ugarte-Urra, I. 2008, ApJL, 673, 211
- (14) Okamato, T. J. et al. 2007, Science, 318, 1577
- (15) Shimojo, M., Hashimoto, S., Shibata, K., Hirayama, T., Hudson, H. S., & Acton, L. W. 1996, PASJ, 48, 123
- (16) Pariat, E., Antiochos, S. K. Devore, C. R. 2008, ApJ, submitted
- (17) Pike, C. D., Mason, H. E. 1998, Sol. Phys., 182, 333
- (18) Shibata, K. Uchida, Y. 1986, Sol. Phys, 103, 299
- (19) Shibata, K., Shinojo, M., Yokoyama, T., Ohyama, M. 1996, in ASP Conf. Ser. 111, Magnetic Reconnection in the Solar Atmosphere, ed. R. D. Bentley J. T. Mariska (San Francisco: ASP), 29-38
- (20) Shimojo, M., Hashimoto, S., Shibata, K., Hirayama, T., Hudson, H. S., Acton, L. W. 1996, PASJ, 48, 123
- (21) Yokoyama, T., & Shibata, K. 1996, PASJ, 48, 353
- (22) Wang, Y.-M. et al. 1998, ApJ, 508, 899
- (23) Wilhelm, K., Dammasch, I. E., Hassler, D. M. 2002, ApSS, 282, 189
- (24) Wuelser, J.‐P., et al. 2004, Proc. SPIE, 5171, 111