Stellar Exotica in 47 Tucanae111Based on observations made with the NASA/ESA Hubble Space Telescope, obtained at the Space Telescope Science Institute, which is operated by the Association of Universities for Research in Astronomy, Inc., under NASA contract NAS 5-26555.
Abstract
We present far-ultraviolet (FUV) spectroscopy obtained with the Hubble Space Telescope (HST) for 48 blue objects in the core of 47 Tuc. Based on their position in a FUV-optical colour-magnitude diagram, these were expected to include cataclysmic variables (CVs), blue stragglers (BSs), white dwarfs (WDs) and other exotic objects. For a subset of these sources, we also construct broad-band, FUV through near-infrared spectral energy distributions. Based on our analysis of this extensive data set, we report the following main results. (1) We detect emission lines in three previously known or suspected CVs and thus spectroscopically confirm the status of these systems. We also detect new dwarf nova eruptions in two of these CVs. (2) Only one other source in our spectroscopic sample exhibits marginal evidence for line emission. Thus CVs are not the only class of objects found in the gap between the WD and main sequences, nor are they common amongst objects near the top of the WD cooling sequence. Nevertheless, predicted and observed numbers of CV agree to within a factor of about 2-3. (3) We have discovered a hot ( K), low-mass () secondary star in a previously known 0.8 d binary system. This exotic object completely dominates the binary’s FUV-NIR output and is probably the remnant of a subgiant that has been stripped of its envelope. Since this object must be in a short-lived evolutionary state, it may represent the “smoking gun” of a recent dynamical encounter. (4) We have found a Helium WD, only the second such object to be optically detected in 47 Tuc, and the first outside a millisecond pulsar system. (5) We have discovered a bright BS with a young WD companion, the only BS-WD binary known in any GC. (6) We have found two additional candidate WD binary systems, one containing a MS companion, the other containing a subgiant. (7) We estimate the WD binary fraction in the core of 47 Tuc to be . (8) The mass of the optically brightest BS in our sample may exceed twice the cluster turn-off mass, but the uncertainties are too large for this to be conclusive. Thus there is still no definitive example of such a “supermassive” BS in any GC. Taken as a whole, our study illustrates the wide range of stellar exotica that are lurking in the cores of GCs, most of which are likely to have undergone significant dynamical encounters.
Subject headings:
globular clusters: individual(NGC 104) — blue stragglers — novae, cataclysmic variables — white dwarfs – binaries:close — ultraviolet: stars — techniques: spectroscopic1. Introduction
Globular clusters (GCs) harbour an impressive array of exotic stellar populations, such as blue stragglers (BSs), millisecond pulsars (MSPs), X-ray binaries (XRBs), cataclysmic variables (CVs) and Helium white dwarfs (He WDs). The sizes of these populations can be significantly enhanced in GCs, relative to the Galactic field. This is a direct result of the high stellar densities encountered in GC cores (up to at least ). In such extreme environments, dynamical interactions between cluster members occur rather frequently, which opens up new and efficient production channels for virtually all types of “stellar exotica.” Thus GCs are excellent laboratories for studying these otherwise extremely rare objects (Maccarone & Knigge 2007).
This argument can also be turned around. Since exotic stellar populations in GCs are preferentially produced by dynamical interactions, they can be used as tracers of a GC’s dynamical state. For example, the number of faint X-ray sources in GCs has been shown to correlate well with the predicted stellar encounter rate (Pooley et al. 2003; Heinke et al. 2003a; Gendre, Barret & Webb 2003a; Pooley & Hut 2006), and deviations from this relationship can be related to specific dynamically-relevant factors (e.g. the highly elliptical orbit of NGC 6397; see Pooley et al. 2003).
However, exotic stellar populations are not merely passive tracers of GC evolution. Instead, most of these populations are composed of close binaries that actively drive the evolution of their host clusters towards evaporation. Both primordial and dynamically-formed close binaries can be thought of as heat sources in this context: in successive dynamical encounters with passing single stars, close binaries tend to give up gravitational binding energy to their interaction partners, and hence to their parent cluster as a whole. The binaries themselves become increasingly tight in the process (i.e. they “harden”). Thus stellar exotica in GCs are not merely formed dynamically, but are part of the central feedback loop that links the dynamical evolution of a GC to the formation and evolution of its close binary population (e.g. Hut et al. 1992 [Section 3.1.3]; Shara & Hurley 2006; Hurley, Aarseth & Shara 2007).
Even though exotic stellar populations are abundant in GCs compared to the Galactic field, they still represent only a small fraction of the total number of stars in any cluster. Thus even in GCs, finding and characterizing these populations is a challenging task. One useful feature common to most members of these populations is that their spectral energy distributions (SEDs) tend to be “bluer” than those of ordinary stars (i.e. a larger fraction of their radiation is emitted at higher frequencies). This can be exploited. For example, deep X-ray surveys have turned out to be a powerful method for locating XRBs and CVs in GCs (e.g. Grindlay et al. 2001ab; Pooley et al. 2002; Heinke et al. 2003b; Gendre, Barret & Webb 2003b; Heinke et al. 2005; Webb, Wheatley & Barret 2006). Similarly, far-ultraviolet (FUV) surveys of GCs are sensitive to an even wider range of “hot” exotic populations, while still avoiding the crowding problems associated with optical searches (e.g. Ferraro et al. 2001; Knigge et al. 2002 [hereafter Paper I]; Dieball et al. 2005a; Dieball et al. 2007). However, the detection of X-ray emission and/or FUV excess is usually not enough to yield a unique source classification. Thus additional information – ideally based on spectroscopic observations – is required for a full census of the exotic stellar populations in GCs.
Here, we present FUV spectroscopy obtained with the Hubble Space Telescope (HST) of 48 FUV-excess sources in the core of 47 Tuc. Based mainly on their position in a FUV/optical colour-magnitude diagram (CMD), these sources are expected to include BSs, CVs and young WDs (Paper I). We find examples of all of these classes in our spectroscopy, along with unexpected discoveries of even more exotic objects. In Section 2, we describe the observations we use in our study, along with our data reduction and analysis methods. We also highlight the positions of our spectroscopic targets in the CMD and present proper motion-based membership information for a subset of sources. In Section 3, we present an overview of all the individual spectra and assess the overall relationship between CMD position and spectroscopic classification. The heart of this paper is Section 4, where we take a detailed look at the most interesting sources. We also construct global FUV through near-infrared (NIR) SEDs for these objects and use joint fits to the spectroscopic and SED data to determine their nature. In Section 5, we discuss some of the wider implications of our work and estimate the WD binary fraction in 47 Tuc. Finally, in Section 6, we summarize our main results and conclusions.
2. Observations and Data Analysis
2.1. Far-Ultraviolet Imaging and Slitless Spectroscopy
We have carried out a deep spectrosopic and photometric survey of 47 Tuc in the FUV waveband. In total, we obtained 30 orbits of HST/STIS observations for our program (G0-8279), split into 6 epochs of 5 orbits each. Imaging exposures were obtained at the beginning and end of each epoch, with the rest of the time being spent on slitless spectroscopy. Exposure times were typically 600 s for both imaging and spectroscopy. In total, we obtained approximately 14,600 s of FUV imaging and 82,200 s of slitl¡ess spectroscopy.
All of the observations used the FUV-MAMA detectors, together with the F25QTZ filter. This filter blocks geocoronal Ly Oi 1304 Å and Oi] 1356 Å emission, which would otherwise produce an unacceptably high background in our slitless spectral images. The resulting photometric bandpass is strongly asymmetric, with peak transmission at about 1487 Å, just above the sharp cut-off around 1450 Å; the pivot wavelength is 1595 Å, and the full-width at half-maximum is 229 Å. The 10241024 pixel FUV-MAMA detectors cover a field of view of about 25″25″ (corresponding to about 1/3 of 47 Tuc’s core) with a spatial sampling of about 24.5 mas pix-1.
The data reduction and analysis steps carried out for the direct images – which include the construction of a combined master image, as well as source detection and photometry – have already been described in Paper I. We will use the resulting FUV source catalogue throughout this paper, except for three small changes and additions. First, in Paper I, we restricted our attention to the spatial area common to all direct images. Even though the spatial shifts between images taken in different epochs are quite small, this restriction removed one bright FUV source for which we now have a high-quality spectrum. We have therefore added this source – Star 999 in the notation adopted below – to the photometric catalogue. Second, we have applied a small (0.086 mag) correction to the FUV magnitudes obtained in Paper I in order to account for the sensititivity loss of the FUV-MAMA detectors at the time of the observations. This correction was not available at the time of Paper I’s publication. Third, as described in Knigge et al. (2006), we have applied distortion and boresight corrections to the FUV source positions. The boresight correction is designed to put our equatorial coordinates into the absolute astrometric frame defined by the Chandra source positions listed in Heinke et al. (2005).
Our slitless FUV spectroscopy was carried out with the G140L grating, which provides a dispersion of 0.584 Å pix-1 and a spectral resolution of about 1.2 Å. This set-up can cover a spectral range of roughly 1450 Å – 1800 Å. However, note that in slitless observations, the actual wavelength range covered for each source depends on its spatial position on the detector. Since the observatory software automatically applied a spatial offset to all spectroscopic observations, the effective field of view for the spectral images was only about 85% of the field available in the direct images.
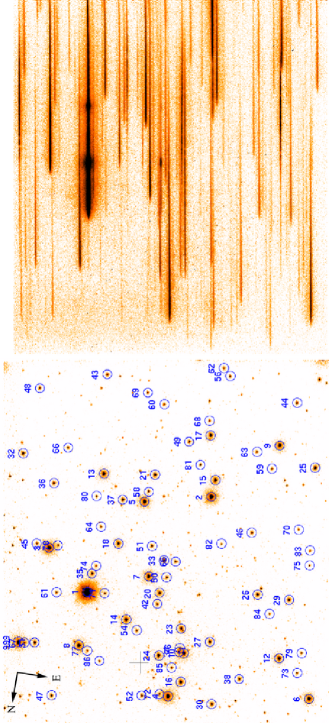
Figure 1 shows the co-added direct and spectral images side-by-side. This figure illustrates the high efficiency of the slitless approach, but also the technical challenges it poses. By moving to the FUV waveband, we can drastically reduce the crowding that plagues optical images, since the vast majority of “normal” cluster members are simply not hot enough to produce appreciable amounts of FUV flux (see Figure 1 in Paper I for a graphic illustration of this effect). As a result, multi-object slitless spectroscopy of dense GC cores becomes feasible in the FUV and provides an efficient technique for determining the nature of exotic stellar populations. However, extracting single-source spectra from slitless spectral images like that shown in Figure 1 is not a trivial task. Part of the difficulty stems from the fact that the spatial and spectral dimensions are not independent. However, the more important problem is the blending of sources in the spectral image.
We deal with these technical challenges by using the multispec software package, which has been specifically designed to facilitate the extraction of single-source spectra from multi-object slitless spectral images (Maíz-Apellániz 2005, 2007). Briefly, multispec uses the position, brightness and colour of each source (as determined from direct images of the field) to generate an initial estimate of its spectrum. Next, all of these estimates are combined to construct a complete synthetic spectral image that can be directly compared (in a sense) to the actual spectral image. The initial estimates of the individual spectra are then iteratively optimized until the best possible match between synthetic and real spectral images has been achieved.
A few points are worth noting regarding this process. First, a key factor in the construction of the synthetic spectral image from the individual spectra is the wavelength-dependent cross-dispersion profile (CDP). This is effectively the point spread function (PSF) perpendicular to the dispersion direction in the spectral image. We derived the CDP for our instrumental set-up from calibration observations in the HST archive. Second, blending is self-consistently accounted for in the extraction, since an arbitrary number of sources can contribute to any given pixel in the synthetic spectral image. Third, the extraction process also allows for a smoothly varying global detector background, which is iteratively estimated from the residuals between real and synthetic spectral images. Fourth, we extract source spectra separately for each epoch. This avoids any problems associated with the slight spatial offsets between the spectral images for each epoch. Our final spectrum for each source is then the exposure-weighted average of the optimized single-epoch spectra.
The extracted source spectra will be good approximations to the true source spectra, as long as (i) the CDP is sufficiently accurate, (ii) the input source catalogue is sufficiently accurate and complete, and (iii) blending is not too severe. All of these conditions imply that there is a limit to the ability of the algorithm in extracting spectra for faint objects that are heavily blended with one or more bright objects. In this situation, even very slight errors in the extraction of the bright source spectra can lead to large systematic errors in the extracted faint source spectra.
In order to flag areas of a spectrum that might be compromised by severe blending, we calculate a wavelength-dependent “blend ratio” for each extracted source. This is defined as the ratio of counts from the source itself to the counts produced by all other extracted objects, as estimated at the peak of the source CDP. We stress that this blend ratio is no panacea. In particular, since our estimate of it is necessarily based on the extracted source spectra, it can itself be affected by blending. For example, if the flux of a faint source has been overestimated due to blending, the blend ratio associated with that source will be underestimated. Nevertheless, the blend ratio does provide an extremely useful, if qualitative, measure of the wavelength-dependent reliability of each source spectrum. As a rule of thumb, blending is not a serious issue whenever the blend ratio is , whereas spectral regions with blend ratios may be severely compromised.
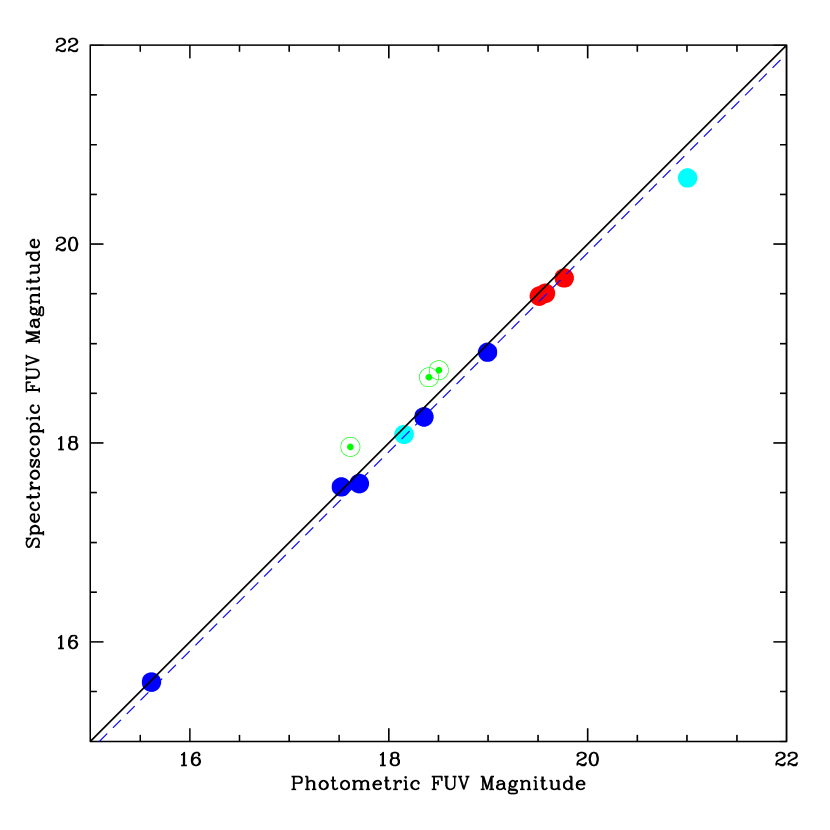
In order to test our spectral extraction method, we have folded the extracted spectra of several bright FUV sources with particularly good spectral coverage through the STIS/FUV-MAMA/F25QTZ photometric response curve. This was done with the synphot package within iraf/stsdas and yielded spectroscopic estimates of the FUV magnitudes for these sources. These could be directly compared to the photometric magnitudes, as shown in Figure 2. The agreement between spectroscopic and photometric estimates is generally quite good, except for the 3 BSs in the sample. These generally have spectroscopic magnitudes that are systematically fainter than the photometric ones, by 0.2 mag - 0.3 mag. This disagreement is actually to be expected, since we can only extract spectra out to 1800 Å. Beyond this, the throughput drops dramatically and is not well calibrated. However, the FUV spectra of BSs rise extremely steeply towards longer wavelengths (see Section 3.2), and the FUV-MAMA/F25QZ photometric bandpass does retain some slight sensitivity there. Thus wavelengths beyond our spectrosopic cut-off contribute non-negligibly for the BSs. For the other sources, photometric and spectroscopic estimates agree quite well. The rms scatter is only about 0.1 mag, which is acceptable, especially considering that our sample includes known variables (such as the CVs AKO 9, V1 and V2; see Section 3.1 below). There is marginal evidence for a slight offset of 0.089 mag (in the sense of the spectroscopic estimates being brighter), so we apply this as a uniform correction to all of our extracted spectra.
2.2. Optical Imaging
The FUV-optical CMD presented in Paper I served as a starting point in the classification of our spectroscopic targets (see Section 3). The optical photometry for this CMD was based on a deep, co-added WFPC2/PC/F336W (roughly U-band) image of the cluster core and has already been described in Paper I.
For the subset of FUV sources discussed in Section 4, we additionally constructed broad-band, FUV through NIR SEDs. With the exception of the FUV data point (which comes from our own STIS/F25QTZ direct image), all of this photometry was obtained from ACS/HRC observations of 47 Tuc in the HST archive. These observations spanned the full complement of ACS/HRC broad-band filters, including F250W ( 2716 Å), F330W (3363 Å), F435W ( 4311 Å), F475W ( 4776 Å), F555W ( 5256 Å), F606W ( 5888 Å), F625W ( 6296 Å), F775W ( 7665 Å), F814W ( 8115 Å), and F850LP ( 9145 Å); here, is the pivot wavelength of each filter. Due to the limited field of view and depth of the exposures we used, only a subset of these filters are usually available for each target.
All of our ACS/HRC photometry was carried out with Andrew Dolphin’s PSF-fitting package dolphot 111http://purcell.as.arizona.edu/dolphot, which is a modified version of the WFPC2-optimized HSTphot package (Dolphin 2000). The advantage of dolphot for our purposes is that it provides an ACS-optimized mode, in which detector- and filter-specific simulated Tiny Tim PSFs are used as baseline PSF models222http://www.stsci.edu/software/tinytim/tinytim.html. In ACS mode, dolphot applies CTE corrections automatically and provides fully calibrated photometric measurements.
Throughout this paper, all magnitudes are given on the STMAG system, where
| (1) |
For photometric measurements, is the (constant) flux of a flat-spectrum source that would produce the observed count rate in the photometric band-pass. In Section 4, we will also adopt the STMAG system for spectroscopic data, by using Equation 1 as a monochromatic definition of . This convention allows us to put spectroscopic and photometric measurements onto a common, easily interpretable scale.
2.3. The FUV-optical Colour-Magnitude Diagram
Figure 3 shows the FUV-optical CMD for sources in our imaging field of view. The data and models shown in Figure 3 are exactly the same as in Paper I, except for (i) the slight updates to the FUV photometry described in Section 2.1, (ii) the fact that we now also show objects without optical counterparts, for which we adopt an F336W magnitude of 23.5 (well below the actual optical detection limit), and (iii) we have added an approximate He WD model sequence (calculated by shifting the standard WD sequence to account for the radius difference between a 0.5 WD and 0.25 one).
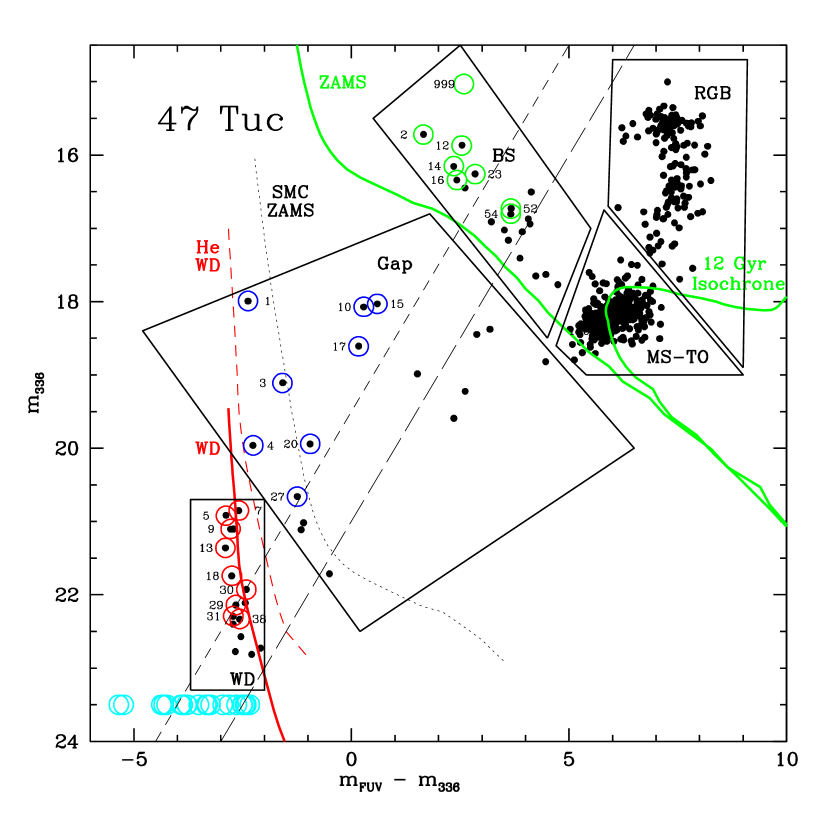
Objects for which we have been able to extract useful spectra are circled in Figure 3 and labelled with their spectroscopic ID number (c.f. Figure 1 and Table 1). Each spectroscopic target is also assigned a preliminary photometric classification, based on its position in Figure 3. Possible classifications include white dwarf (WD), “gap object” (sources between the WD and main sequences), blue stragglers (BS), FUV source with no optical counterpart (NoOpt), main-sequence turn-off star (MS-TO) and red giant/horizontal branch star (RGB).333We speculated in Paper I that the mismatch between the predicted and observed position of stars on the RGB may be due to chromospheric FUV emission from these objects. However, the recent discovery of a significant red leak in the STIS/FUV-MAMA response (STIS Instrument Handbook for Cycle 17; Section 5.3.4) provides a more mundane explanation. This red leak is not yet incorporated into the sensitivity curve used in stsdas/synphot. Fortunately, this has negligible impact on our results, since all of the objects discussed in Section 4 are relatively blue and FUV bright. Selection boxes for all of these objects (except the NoOpts) are shown in Figure 3, and the spectroscopic targets inside each box are marked with a distinct colour. The photometric classifications are also given in Table 1.
In the context of stellar exotica, the gap region is of particular interest. This is the area in which CVs and detached WD-MS binaries may be expected to be found (Paper I; Townsley & Bildsten 2002). Some such objects may also fall into the WD and NoOpt selection boxes, e.g. if the hot WD still dominates the binary SED in both FUV and F336W. However, as shown statistically in Paper I, both of the latter boxes are likely to contain primarily WDs.
In total, we have been able to extract useful spectra for 48 objects, including 8 gap sources, 8 BSs, 9 WDs and 23 NoOpts. All MS-TO and RGB objects were too faint to be included in our spectral extraction. The long-dashed diagonal line corresponds to and marks the approximate spectroscopic extraction limit. Note that not all sources above this limit are circled in Figure 3. This is because some bright sources fell outside our spectroscopic field of view and others were too severely blended with even brighter objects to yield useful spectra. The short-dashed diagonal line corresponds to and marks the approximate spectroscopic completeness limit, as discussed further in Section 5.1. Using the same method as in Paper I, we estimate that objects in the CMD brighter than , and objects brighter than may be the result of a chance coincidence (i.e. a superposition of two unrelated stars). These estimates are based on the number of FUV sources brighter than the adopted cut-offs, the number of optical sources, and the number of actual matches between these source lists.
2.4. Proper Motions and Cluster Membership
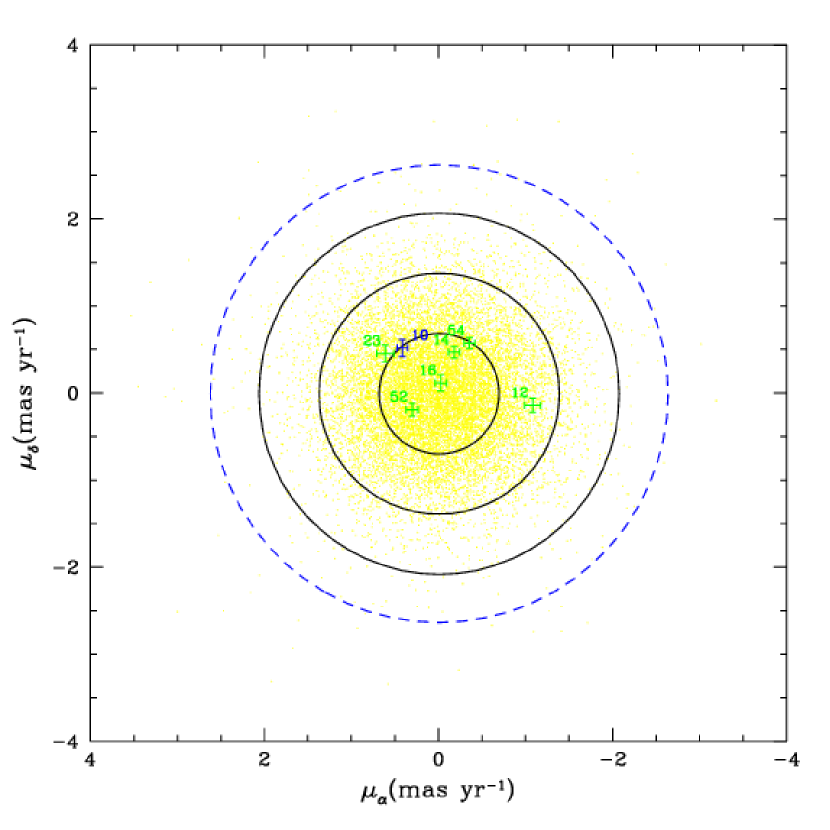
McLaughlin et al. (2006) have recently created a large photometric and proper motion catalogue that contains over 14,000 stars near the central regions of 47 Tuc. A subset of 18 of our spectroscopic targets have counterparts in their master catalogue, and 6 of these have well-determined proper motions. In Figure 4 we show the location of these stars in the proper motion diagram, relative to other cluster members in the McLaughlin catalogue. All of our targets (which include 5 BSs and 1 gap object according to the CMD-based classification) are fully consistent with being cluster members.
3. FUV Spectroscopy of 48 Objects in the Core of 47 Tuc
In this section, we present an overview of all the useful spectra we could extract from our slitless FUV spectral images. We have grouped the spectra by their CMD-based classifications for this purpose.
3.1. The Spectra of Gap Objects
The FUV spectra of our 8 gap sources are shown in Figure 5. The diversity of these spectra is striking and immediately suggests that these objects do not form a homogenous group. All gap sources will be analyzed individually in Section 4, so we only present a brief overview here.
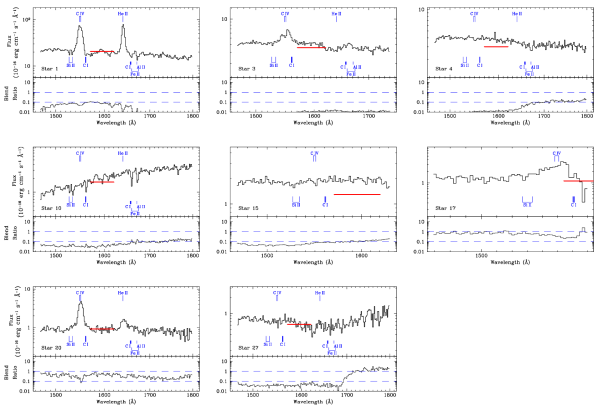
Clear emission lines are seen in Stars 1, 3, and 20, all of which were previously known or suspected CVs (also known as AKO 9, V1, and V2, respectively [see Table 1]). The presence of emission lines confirms the CVs nature of these objects. Our data on AKO 9 has already been analyzed in detail elsewhere (Knigge et al. 2003), but the spectroscopic confirmation of V1 and V2 as CVs is reported here for the first time in the refereed literature. 444The review presented in Knigge (2004) inludes preliminary, rough spectral extractions for these objects. Only one other gap source – Star 17 – shows tentative evidence of line emission. Unfortunately, the position of this object on the detector is such that only a short segment of its spectrum is available, with the red cut-off occuring just beyond the C iv line. The line itself thus falls close to the edge of the detector, which is why we do not consider the apparent flux excess near 1550 Å to be a definite detection of line emission. We will discuss Star 17 in more detail in Section 4.9.
Of the 4 remaining objects, 3 exhibit flat or blue continua, but the fourth – Star 10 – presents a rather strange, red continuum with absorption lines. All 4 of these objects turn out to be interesting (see Section 4), but Star 10, in particular, is probably the most exotic and unusual object our FUV survey has uncovered. This object is analyzed more closely in Section 4.7.
3.2. The Spectra of Blue Stragglers
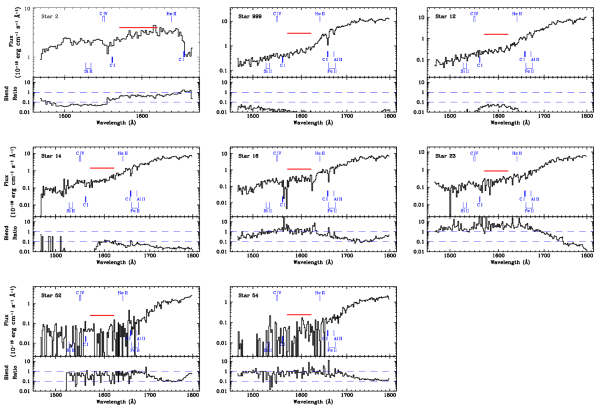
Figure 6 shows the FUV spectra of our 8 BSs in the core of 47 Tuc. Only the two brightest of these – Stars 2 and 999 – will be analyzed in more detail in Section 4.
Unlike the gap sources, all but one of the BSs display rather similar FUV spectra. More specifically, 7 of the 8 BSs show extremely red FUV continua, with fluxes increasing by typically 2 orders of magnitude between roughly 1500 Å and 1800 Å. This near-exponential rise is expected, since BSs are stars of spectral type A-F for which the FUV waveband falls on the Wien tail of their SEDs. In principle, this should make the FUV flux and spectral shape a very sensitive thermometer for BSs, a possibility we will explore in Section 4.12. In those sources with sufficient S/N, the spectra also exhibit absorption lines due to C i and Al ii (with a possible contribution from Fe ii).
The obvious outlier among the BSs is Star 2, whose FUV continuum rises much more slowly towards longer wavelengths. Moreover, the flux level at the blue end of the spectrum (around 1500 Å) is much higher than for any other BS in our sample. Thus even though the red part of Star 2’s FUV spectrum may be affected by blending, the discrepancy between this object and the other BSs appears to be real. Star 2 is analyzed more carefully in Section 4.2.
3.3. The Spectra of White Dwarfs
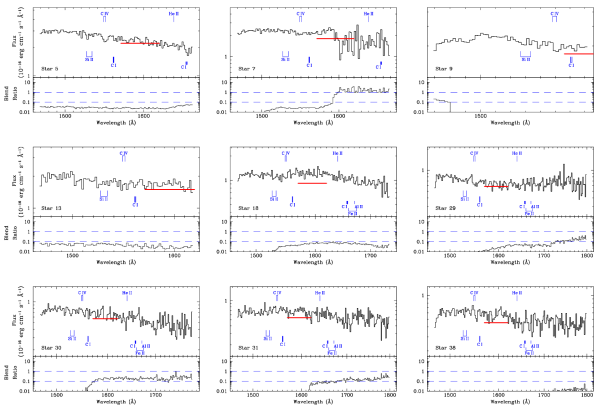
The FUV spectra of the 9 hot WDs in our sample are shown in Figure 7. Only the two brightest of these – Stars 5 and 7 – will be analyzed in more detail in Section 4.
The WDs present a relatively homogenous set of FUV spectra. which can be characterized as blue, featureless continua. This is as expected for young WDs near the top of the cooling sequence. There is little evidence for absorption or emission lines in any of these spectra. The only features that are perhaps worth remarking on are a hint of an absorption dip near C iv in the spectrum of Star 5, and a hint of emission near the same line in the spectrum of Star 29. However, we regard neither of these features as convincing. We thus conclude that the top of the WD cooling sequence in 47 Tuc does not hide a large population of WD-dominated CVs (see also Section 3.4). Surprises are still possible though, as illustrated by the analysis of Star 7 in Section 4.6.
3.4. The Spectra of FUV Sources without Optical Counterparts
Figure 8 shows the spectra of our 23 FUV sources without optical counterparts. This group of objects is also expected to be dominated by hot WDs. As shown in Paper I, the number of these objects is consistent with expectations for the WD population, and our optical (WFPC2/PC/F336W) photometry is certainly not complete for these optically faint objects. Since we do not have optical counterparts, none of these sources are included in Section 4.
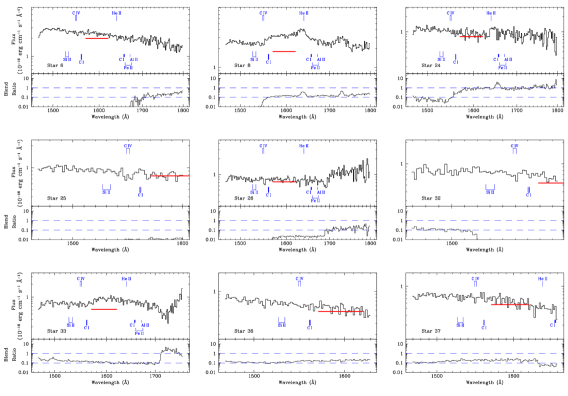
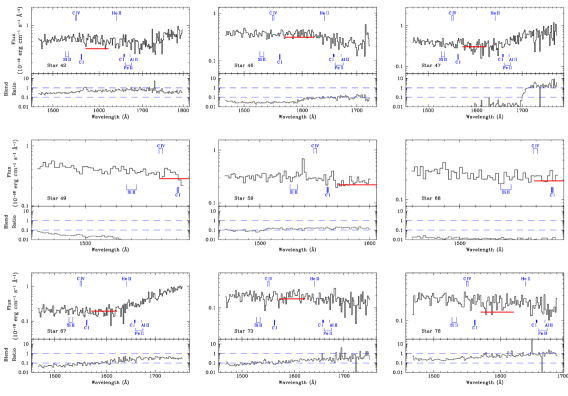
Figure 8 shows that the spectra of essentially all of these FUV sources are consistent with expectations for single DA WDs. In particular, the resemblance of the spectra to those of the photometrically-classified WDs (Figure 7) is obvious. The spectrum of Star 33 contains an obvious hump, but this is caused by blending with a fainter FUV source. That source was not included in the spectral extraction, which explains why the blend ratio for Star 33 does not show this feature. None of the objects in Figure 8 show convincing evidence for emission or absorption lines. This confirms the conclusion of Section 3.3 that the top of the cooling sequence does not harbour numerous CVs.
4. A Closer Look at Individual Sources
We will now present a more detailed analysis of the most interesting and representative sources in our spectroscopic sample. This includes all of the gap sources, as well as the two brightest objects from the CMD-based WD and BS groups. All sources analysed in this section are listed in bold at the top of Table 1. The last column in the table presents our final classification for each source.
Throughout this section, we will use model fits to the combined spectral and SED data sets to shed light on the physical nature of our sources. The cluster parameters adopted in these models are those of Gratton et al. (2003), i.e. pc, , . All stars, except WDs, are described by interpolating on the latest, -enhanced Kurucz atlas9 model atmosphere grids. 555The Kurucz model atmosphere grids are available for download at http://kurucz.harvard.edu/grids.html. These grids use the updated opacity distribution functions described by Castelli & Kurucz (2001) and account for enhanced -element abundances at a level of . For the purpose of modelling WDs, we rely on the grid of synthetic WD spectra described in Gänsicke, Beuermann & de Martino (1995), which has been kindly provided by Boris Gänsicke. We generally adopt and (corresponding to ) to describe WDs in 47 Tuc. This is appropriate for recently formed WDs near the top of the cooling sequence (Renzini & Fusi Pecci 1988; Wood 1995). We also use the WD models to qualitatively describe other hot spectral components, such as accretion disks in CVs. We will only be interested in rough estimates of the characteristic temperatures and sizes of such generic hot components, and the use of WD models should be adequate for this purpose.
The spectral resolution of the Kurucz models is relatively low, with a typical wavelength step of 10 Å in the FUV region. This turns out to be quite adequate for our qualitative modelling, and so the observed spectra (and also the WD models) are interpolated onto the wavelength grid of the Kurucz spectra during our fitting procedure. We have also carried out synthetic photometry on all models in the Kurucz and WD grids. This was done using synspec in iraf/stsdas, which includes throughput files for all HST detector/filter combinations. Most of our modelling is done in a least squares sense, with every data point being given equal weight. Since we only consider the coarse Kurucz wavelength grid when modelling the FUV spectrum, this usually provides a reasonable compromise between the emphasis placed on the spectrum relative to the broad-band SED. In a few cases, the relative weights assigned to the spectroscopy and photometry were adjusted slightly to improve the overall quality of the fits.
We note from the outset that our goal here is to find physically plausible descriptions of the data, rather than arbitrary sets of best-fit parameters. Thus we will sometimes constrain certain parameters or parameter combinations to have values consistent with, for example, the expected location of the WD or main sequences. Of course, we will only do this when adequate fits can actually be found with the constrained parameters. We feel this approach is appropriate, since the match between data and models is limited by systematic effects (e.g. blending in the spectra, crowding in the photometry, and uncertainties affecting the theoretical models) rather than by purely statistical errors on the data.
4.1. Star 1 = AKO 9: A CV with a Subgiant Donor
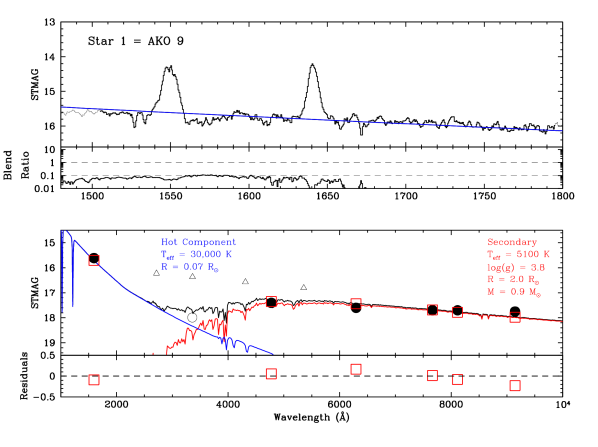
Star 1 is the brightest FUV source in 47 Tuc and is identical to the previously known blue object AKO 9. A detailed analysis of our FUV spectroscopy and photometry for this source has already been presented in Knigge et al. (2003). Figure 10 shows the FUV spectrum and broad-band SED for AKO 9, along with our suggested two-component fit to these data.
As shown in Knigge et al. (2003), AKO 9 is almost certainly a CV with an orbital period of d and an evolved, probably subgiant donor star. This description also turns out to provide a good fit to the more extensive broad-band SED we have assembled here. In constructing this model, we have assumed that the secondary is a turn-off mass object and have used the orbital period-mean density relation for Roche-lobe filling stars,
| (2) |
as an additional constraint on the donor parameters (e.g. Warner 1995). The hot component that dominates the FUV light is too bright to be a pure WD and is instead likely to arise in an accretion disk. In our fit, we have described this component with a WD model atmosphere. The temperature was fixed at K, which yields an effective radius of (for a pure WD, we would expect ). However, the temperature and effective radius are highly correlated and not well constrained.
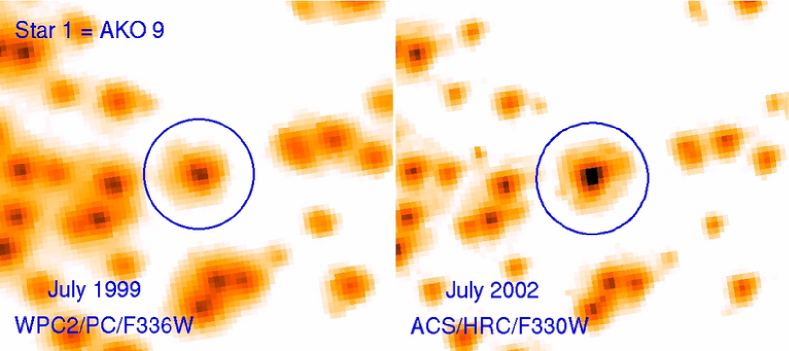
In the process of constructing the broad-band SED, we noticed that a subset of optical observations obtained in July 2002 were systematically brighter than all of our other optical data. We show these 4 data points as open triangles in Figure 10. Note, in particular, the almost 2 mag brightness difference between the roughly U-band data used in Paper I (open circle in Figure 10) and that obtained in July 2002. As shown in Figure 11, this difference is easily noticeable in the images themselves.
We conclude that we have discovered a dwarf nova eruption of AKO 9. Two previous outburst of this object have been observed with HST, one in July 1986, the other in October 1992 (Minniti et al. 1997; see also Knigge al. al. 2003). The present discovery of an eruption in July 2002 confirms that the mean interoutburst recurrence time is at most 6-7 years. However, given the relatively sparse time coverage of the photometry investigated to date, a shorter recurrence time remains possible.
Even though all of the existing observational evidence is consistent with AKO 9 being a dwarf nova-type CV, the source warrants additional investigation. In particular, a radial velocity study would be invaluable for establishing the system parameters. As an incentive for such a study, we note that the X-ray, FUV and optical properties established so far do not completely preclude the possibility that the primary could be a black hole, rather than a WD.
4.2. Star 2: A Blue Straggler with a White Dwarf Companion
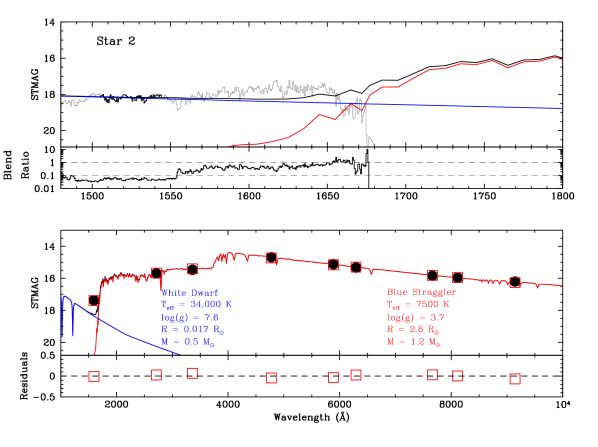
Star 2 lies on the BS sequence in the FUV-optical CMD (Figure 3), but its FUV spectrum rises much more slowly towards longer wavelengths than that of any other BS in our data (Figure 6). Even though our spectrum for this object is rather short, and may be affected by blending longwards of about 1550 Å, we have no reason to doubt the reality of the FUV excess it implies (relative to other BSs).
Figure 12 shows the FUV spectrum and broad-band SED for this object, along with our best-bet model. All of the photometry is well described by a single component with parameters appropriate for a BS in 47 Tuc. However, no single component model is able to also match the FUV spectrosopy. 666The surface gravity (and hence mass) of the BS is not well constrained by the fit and was therefore fixed at a physically plausible value. Also, the predicted FUV spectrum of the BS may not be very accurate (see Section 4.12). However, our conclusion that the observed FUV spectrum shows a strong excess at the shortest wavelengths is insensitive to these caveats.
The simplest and most plausible way to account for the observed FUV excess is to invoke a WD companion to the BS. As shown in Figure 12, a WD with K provides a reasonable match to the FUV spectrum without significantly affecting the broad-band SED. Thus a BS-WD binary system provides a good match to the entire spectroscopic and potometric data set.
Is it possible that we are being fooled by a chance superposition? There are two questions to consider in this context. First, could the FUV flux we have identified with the short-wavelength spectrum of Star 2 actually be associated with a different FUV source? Inspection of the direct image (Figure 1) shows that there are two FUV-bright sources – Stars 17 and 30 – that lie close enough to Star 2 in the spatial direction to warrant consideration. However, Star 17 lies to the right of Star 2 in the direct image and so cannot be responsible for any short-wavelength flux in the spectrum of Star 2. Star 30, on the other hand, has photometric and spectroscopic properties consistent with a single WD and lies about 585 pixels (corresponding to about 340 Å) to the left of Star 2. If the short-wavelength flux attributed to Star 2 were really due to Star 30, essentially of the observed counts would have to be associated with wavelengths well beyond 1800 Å. However, the FUV bandpass has very little sensitivity at such long wavelengths, and the spectroscopic countrates of even the reddest FUV-bright sources in our sample – the BSs – peak well shortward of 1800 Å. Thus Star 30 is almost certainly not the source of any flux assigned to Star 2.
The second question is whether the FUV source we see in the direct image could be a chance blend of the bright BS with a comparably bright WD. It is worth noting here that the BS is expected to be detected in the FUV, so it is not plausible that the WD should completely dominate the FUV output. We have inspected the direct FUV image in the vicinity of Star 2 and find no evidence to support the idea that the FUV source is a blend. However, it should be acknowledged that the FUV imaging PSF is rather complex and asymmetric, and that there are not many FUV-bright objects against which Star 2 could be meaningfully compared. By the same token, however, the probability of two such bright objects lying close to each other by chance is very small. Figure 12 shows that both the WD and the BS would be brighter than on their own. In total, there are only 20 objects (including Star 2) that are this bright in our FUV photometry. The probability that two such objects should lie close enough to each other to form an unrecognizable blend (say within 3 pixels) is only %. Thus it is highly likely that the hot WD is physically associated with the BS.
Even though Star 2 is the first BS-WD binary that has been identified in any GC to date, the existence of such objects should probably be expected. One straightforward way to form such a system is directly from a MS-MS binary. As the more massive object in this progenitor system ascends the giant branch, it may overflow its Roche lobe and thus turn its companion into a BS via Case B or Case C mass transfer 777Here, Case B refers to mass transfer occuring prior to He ignition (during the ascent of the red giant branch), which may produce a He WD; Case C refers to mass transfer after He ignition (during the ascent of the asymptotic giant branch), which would leave behind a CO WD (e.g. Paczyński 1971).
In either case, the outcome would be a BS-WD binary. This formation channel will be available in GC cores as long as the original binary is hard (since otherwise it would not survive until the onset of mass transfer). The hard/soft boundary in GCs corresponds to binary separations on the order of a few AU (e.g. Davies 1997), so there is certainly room for BS-WD progenitor systems in the parameter space of hard binaries.
An alternative way to form BS-WD binaries is directly via dynamical encounters. In particular, since single BSs are the most massive stars found in GCs, any 3-body interaction involving such a BS would tend to leave it with a companion (usually the more massive member of the original binary). Thus a system like Star 2 could have been formed, for example, in an exchange encounter involving a BS and a WD-MS binary.
4.3. Star 3 = V1: A CV with a Main-Sequence Donor
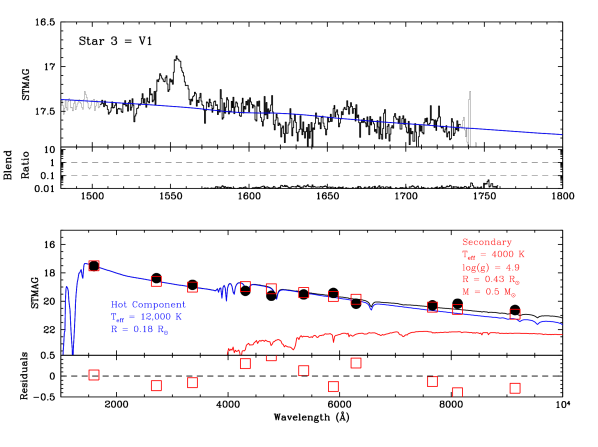
Star 3 = V1 is a previously suspected CV (Paresce, De Marchi & Ferraro 1992; Grindlay et al. 2001a; Ferraro et al. 2001; Knigge et al. 2002). Its orbital period is either 3.5 hrs or 7.0 hrs, depending on whether the observed optical variability is due to ellipsoidal variations or not (Edmonds et al. 2003b).
Figure 13 shows our FUV spectrum and broad-band SED for V1. As already noted in Section 3.1, the detection of C iv in emission spectroscopically confirms V1 as a CV. The emission line is double-peaked, which suggests that it was formed in a rotating medium, such as an accretion disk (e.g. Smak 1981; Horne & Marsh 1986) or a rotating disk wind viewed at high inclination (e.g. Knigge, Woods & Drew 1995). The FUV-NIR SED is consistent with a single, hot component dominating the flux at all wavelengths.
Since the donor of V1 must fill its Roche lobe, we can use the period-mean density relation (Equation 2) to constrain its nature. If the orbital period is 7.0 hrs, and the donor lies close to the cluster MS, the donor mass would have to be roughly 0.75 . Such a star would be 0.5 mag - 1.0 mag brighter than V1 at Å; this makes the long-period option unlikely. 888Strictly speaking, unevolved CV donors are slightly bloated relative to isolated MS stars (e.g. Knigge 2006). However, even if we assume that the secondary in V1 is a full 20% larger than a MS star (and adjust its parameters so as to still satisfy the period-density relation), it would be significantly ( mag) brighter than the observations at Å. Any contribution from the hot component that must dominate at shorter wavelengths would make this discrepancy even worse. If the period is 3.5 hrs instead (which would imply that the observed variability is not ellipsoidal in nature), the expected donor mass is about 0.5 . As shown in Figure 13, such a donor would be a relatively minor contributor to the flux at all FUV-NIR wavelengths. This is self-consistent, since a faint donor like this would not produce a significant ellipsoidal signal. We therefore favour the 3.5 hr period and suggest that the donor lies on or near the lower MS of the cluster.
Both the FUV continuum and the FUV-NIR SED are reasonably described by a 12,000 K optically thick component with an effective radius of 0.18 (where we have again used a WD model to represent this component). Very similar models have been found to match the accretion disk-dominated SEDs of nova-like CVs in the Galactic field (e.g. Knigge et al. 1998). The identification of V1 as a nova-like CV containing a bright accretion disk is consistent with the fact that no dwarf nova outbursts have so far been discovered in this source. However, we do note that the observed SED in Figure 13 exhibits undulations (e.g. between 4000 Å and 6000 Å), which can also be seen as large (up to 0.5 mag) residuals between model and data. These undulations and residuals are probably due to variability. Even though nova-like CVs do not show the eruptions associated with dwarf novae, they do produce a wide range of variability, including flickering, orbital and even sizeable long-term variations (e.g. Honeycutt, Robertson & Turner 1998; Honeycutt & Kafka 2004; Knigge et al. 1998, 2000, 2004).
4.4. Star 4: A Helium WD
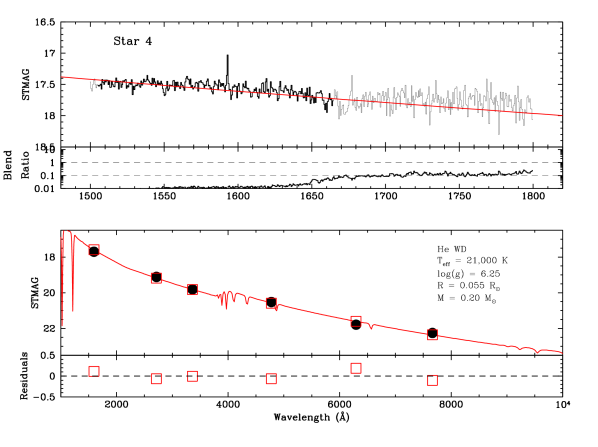
Star 4 is a gap object photometrically, but one that lies close to the WD cooling sequence in Figure 3. The FUV spectrum and broad-band SED in Figure 14 are blue and featureless, but it is impossible to fit these data with an ordinary WD model. The observed spectral slope implies an effective temperature of around 20,000 K, but a normal WD with this temperature is much too faint to match the observed flux. Instead, the required stellar radius is about 0.05 , 3 times larger than the radius of a CO-core WD.
Such a radius is exactly what is expected for low-mass He-core WDs in GCs (Serenelli et al. 2002). In fact, both the radius and temperature we infer for Star 4 are extremely similar to those of the He WD in NGC 6397 found by Edmonds et al. (1999). Motivated by this, we fix the surface gravity of our WD model fit at (Edmonds et al. 1999) and then find an excellent, self-consistent description of the entire data set with K, and .
We conclude that Star 4 is a He WD in 47 Tuc. This is only the second such object to be optically identified in this cluster, the other being the low-mass companion to millisecond pulsar MSP-U (Edmonds et al. 2001). Indeed, only a handful of He WDs have so far been optically detected in all GCs combined, and the only ones not associated with MSPs or ultra-compact X-ray binaries (e.g. Dieball et al. 2005b) are the so-called “non-flickerers” in NGC 6397 (Cool et al. 1998; Edmonds et al. 1999) and the double-degenerate binary V46 in M4 (O’Toole et al. 2006).
In order to form a He WD, its progenitor must lose sufficient mass to avoid He ignition at the top of the RGB. The obvious way to truncate the progenitor evolution is via mass loss during a mass-transfer episode in a binary system. In a GC, He WDs can therefore be formed either in primordial hard binaries or in binaries formed by dynamical encounters (most likely exchange interactions). The channels available for He WD formation in 47 Tuc have been discussed in detail by Hansen, Kalogera & Rasio (2003). They find that both the primordial binary and exchange interaction channels can produce He WDs in 47 Tuc. In either case, the companion of the He WD is likely to be a NS or CO-core WD. However, in a dense GC core, any He WD in a binary system will be vulnerable to ejection during subsequent exchange encounters. Thus isolated He WDs could be produced in GCs by dynamical processes.
In the case of Star 4, there is certainly no sign of any binary companion in the SED. However, only a radial velocity study will allow us to determine if this is because the He WD is currently single or because it has a dark, massive (NS or WD) companion. As noted by Hansen, Kalogera & Rasio (2003), He WDs are unique tracers of the compact object populations in GCs and can provide insight into the dynamical processes that drive GC evolution. Thus follow-up studies of the known He WDs in GCs (including Star 4), as well as searches for additional candidates, are likely to be extremely valuable.
4.5. Star 5: A Simple WD
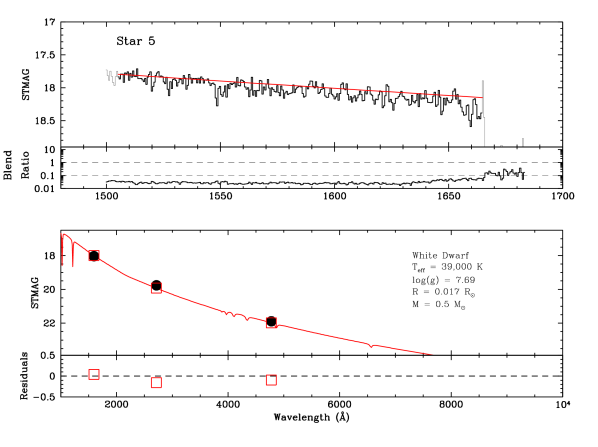
Star 5 is a representative example of hot, young WDs in 47 Tuc (c.f. Figure 3. The FUV spectrum and (very limited) broad-band photometry are shown in Figure 15. The object is too faint to be detected/measured in most of our optical images, but all of the data are consistent with the SED expected for a single, hot ( K) CO-core WD near the top of the cooling sequence.
4.6. Star 7: A WD-MS Binary
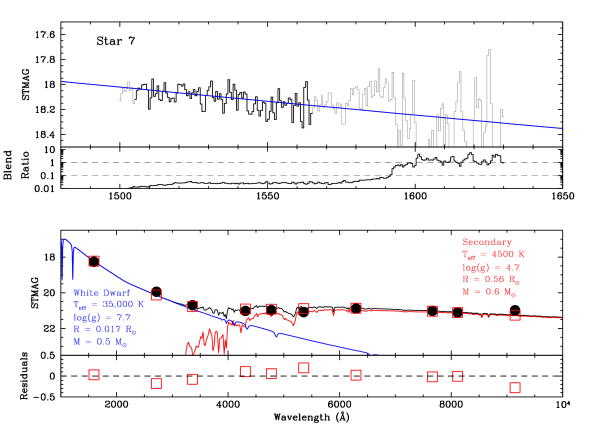
Star 7 was originally included in this section as another representative hot, young WD. However, despite its location close to the WD cooling sequence in Figure 3, the broad-band photometry in Figure 16 reveals a composite SED. As expected from the CMD location, the WD dominates at short wavelengths ( Å). Beyond this, there is a red excess that is well described by a 0.6 MS star in the cluster. Even though the expected number of false matches among FUV sources brighter than is only (Section 2.3), it is, of course, impossible to rule out completely that the composite SED could arise from a chance coincidence between the WD and a low-mass MS star. However, we see little evidence for blending at intermediate wavelengths, where both components contribute significantly to the total flux. We therefore believe Star 7 is likely to be a genuine WD-MS binary in 47 Tuc.
4.7. Star 10 = PC1-V36: A Close Binary with a Dark Primary and a Stripped Secondary
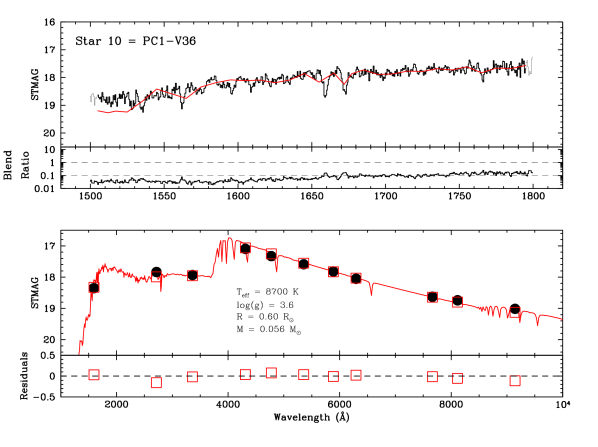
Star 10 = PC1-V36 is arguably the most interesting and exotic object in our entire sample. In Figure 3, it lies squarely in the gap between the WD and main sequences, but we already noted in Section 3.1 that its FUV spectrum is rather peculiar. In Figure 17, we show this FUV spectrum again, but now alongside with the broad-band SED we have constructed from the ACS/HRC images.
In one sense, the spectrum and FUV-NIR SED are extremely simple: a single spectral component with K, and (corresponding to a mass of ) provides an excellent description of our entire spectroscopic and photometric data set. 999We note in passing that an optical spectrum of Star 10 has been presented and analyzed by De Marco et al. (2005). Their preferred parameters for this object (N104-3 in their notation) are K, , . Such a model is inconsistent with the data presented here. For example, a star with these parameters would be more than 1.5 mag fainter in the FUV waveband than we observe. This discrepancy could be a sign of large-amplitude variability on long time scales. However, our own SED shows little sign of this, despite being constructed from non-simultaneous observations (see Figure 17). Another possibility is that the spectrum used by De Marco et al. (2005) was affected by blending, which could bias the inferred stellar parameters. While it would clearly be important to distinguish between these alternatives, doing so is beyond the scope of the present paper. However, this combination of parameters obviously does not describe any kind of normal star in 47 Tuc. This reflects the highly unusual SED of Star 10, which does not appear to be composite, yet is clearly much bluer than that of normal main sequence, red giant and horizontal branch stars in 47 Tuc, and much redder than that of hot WDs. Note that we provide errors here, because the parameters of this object are so unusual and there is no evidence for systematic residuals that might seriously bias the fit. Also, unlike for most other objects, no parameters were constrained a priori in the fit.
Perhaps the most obvious question raised by the strange SED is whether Star 10 is actually a cluster member. Fortunately, this object is the only non-BS in our sample for which a reliable proper motion measurement is available in McLaughlin et al. (2006). As shown in Figure 4, these data are entirely consistent with membership of 47 Tuc.
Additional confirmation of the inferred parameters comes from the variability of the object. Albrow et al. (2001) found a periodic signal with d in their optical time-series photometry for Star 10 (= PC1-V36 in their notation). The light curve shape was consistent with ellipsoidal modulations, in which case the orbital period of the binary system would be d. If this object is an ellipsoidal variable, the star that dominates the SED must be Roche lobe-filling and should obey the orbital period-mean density relationship given in Equation 2. Combining d with our well-determined radius of , this relationship predicts a mass of . This is completely consistent with the mass inferred from the spectral/SED fit. We conclude that Star 10 is a 0.8 d binary system containing a bright, low-mass secondary star that fills (or nearly fills) its Roche lobe. There is no sign of the primary in the SED, which rules out MS-TO stars and other optically bright objects.
With an effective temperature higher than any BS, a mass below the Hydrogen-burning limit, and a radius comparable to a MS star, the secondary in the Star 10 binary system must be in an extreme and short-lived evolutionary state. In our view, the most likely interpretation is that the secondary star is the remnant of a subgiant whose Hydrogen envelope has been almost completely stripped off. A similar description has been suggested for the donor star in the X-ray binary AC 211 in M15 (van Zyl et al. 2004). The requisite stripping could have occurred as a result of mass transfer in a primordial or dynamically-formed binary system. Alternatively, and more excitingly, it might have occurred during the very dynamical encounter that produced the binary system (such as a physical collision with a NS; e.g. Lombardi et al. 2006). In this case, Star 10 might be the “smoking gun” of a recent dynamical encounter involving a compact object.
4.8. Star 15: A WD-Subgiant Binary?
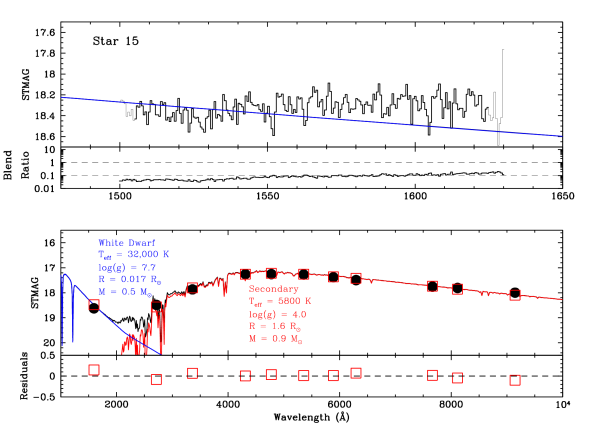
Star 15 is a gap source and located very close to Star 10 = PC1-V36 in the FUV/optical CMD (Figure 3). However, its FUV spectrum and broad-band SED in Figure 18 reveal that its properties are completely different from those of Star 10. Our suggested model for this system consists of a hot WD (which dominates the FUV) and a MS-TO/subgiant secondary star (which dominates everything else). This describes the data fairly well, although the observed FUV spectrum is somewhat flatter than expected for a WD that matches the FUV flux level. We have not attempted to fit any more complicated models, since the FUV spectrum suffers from at least mild blending across much of the spectral range.
As usual, we have to allow for the possibility that the apparently composite nature of Star 15 is due to a chance coincidence. Even though the expected number of false matches among FUV sources brighter than is only (Section 2.3), this concern deserves particular attention in this case, because the offset between FUV and optical positions listed in Table 1 is relatively large (1.29 FUV pixels). While this is well within the hard cut-off adopted in Paper I (1.5 pixels) that was also used for estimating the expected number of chance coincidences, the probability of a given match being due to chance clearly increases with increasing offset. Based on careful visual inspection and blinking of the FUV and optical images, we think there is a strong possibility that the FUV and optical sources associated with Star 15 will turn out to be unrelated, altough it is impossible to be certain. In order to flag this, we have therefore added a “?” to the spectroscopic/SED classification in Table 1.
4.9. Star 17: A Probable WD-Subgiant Binary and Possible CV
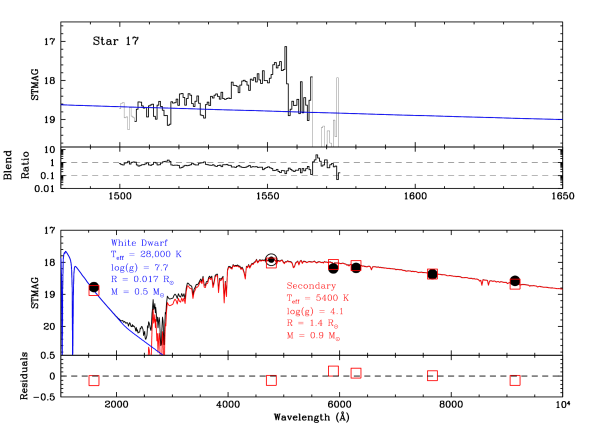
Star 17 is another gap source and located close to Stars 10 and 15 in the FUV/optical CMD (Figure 3). Its broad-band SED (Figure 18, bottom panel) is also very similar to that of Star 15 and suggests that Star 17 is another WD-subgiant binary system. However, as already noted in Section 3.1, there is marginal evidence that C iv 1550 Å is in emission in this sytem (Figure 18, top panel). The detection is not compelling, partly because the line happens to lie close to the edge of the detector and is therefore cut off, and partly because the spectrum of Star 17 suffers from moderate blending.
In assessing the likelihood that Star 17 may be a previously unknown CV in 47 Tuc, it is worth noting that this FUV source was not found to be variable in Paper I, and is also not a viable counterpart to any of the Chandra X-ray sources in Heinke et al. (2005). On balance, we are currently skeptical that this system will be confirmed as a CV in the future.
The status of Star 17 as a WD-subgiant binary is somewhat more secure, although here again we have to consider the possibility that the match between FUV and optical sources is due to a chance coincidence. We note again that the expected number of false matches among FUV sources brighter than is only (Section 2.3). However, as in the case of Star 15, the offset between FUV and optical positions is relatively large for Star 17 (1.20 FUV pixels), so the possibility of a false match deserves to be taken seriously nonetheless. We have therefore again inspected and blinked the FUV and optical images in the vicinity of Star 17. While we cannot rule out the possibility of a random match based on this, we do think Star 17 is more likely to be a genuine match than Star 15. Statistically, it would certainly be rather surprising if both Stars 15 and 17 turned out to be chance coincidences. Nevertheless, we have again conservatively marked the binary classification for Star 17 in Table 1 with a “?”.
4.10. Star 20 = V2: A CV with a Main-Sequence Donor
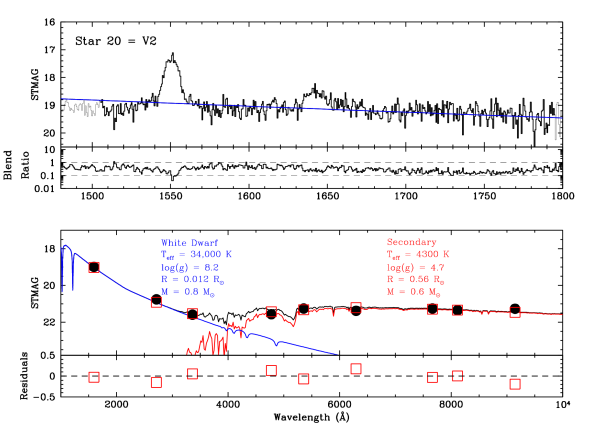
Star 20 = V2 is a previously known CV that was originally discovered as an erupting dwarf nova by Paresce & De Marchi (1994). A second outburst was found by Shara et al. (1996). V2 is also known to be an X-ray source (Grindlay et al. 2001a), as well as a UV-excess object located in the gap region of the CMD (Ferraro et al. 2001; Knigge et al. 2002).
The FUV spectrum and broad-band SED we have obtained for V2 are shown in Figure 20. As already noted in Section 3.1, the presence of C iv 1550 Å and He ii 1640 Å emission lines spectroscopically confirms the CV classification of this source. The SED can be decomposed into a hot component with parameters appropriate for a massive WD, and a cool component with parameters appropriate for a low-mass MS star in 47 Tuc.
Edmonds et al. (2003b) found evidence for variability on periods of 6.8 hrs and 3.0 hrs in their optical photometry for V2. Allowing for the possibility that one of the signals is ellipsoidal in nature (in which case the orbital period is twice the observed period), this means that there are four candidate orbital periods for this system. For comparison, the donor parameters suggested by our SED fit (in which we constrained the donor to lie on the cluster MS), would imply an orbital period of 4.8 hrs (via Equation 2). We will not pursue this issue further here, since neither the orbital period nor our estimate of the donor properties is secure. We do note that donors with significantly higher mass than that implied by our fit are excluded, since they would be brighter than the observed SED at optical and NIR wavelengths. Thus the broader classification of the secondary as a lower MS star is fairly secure.
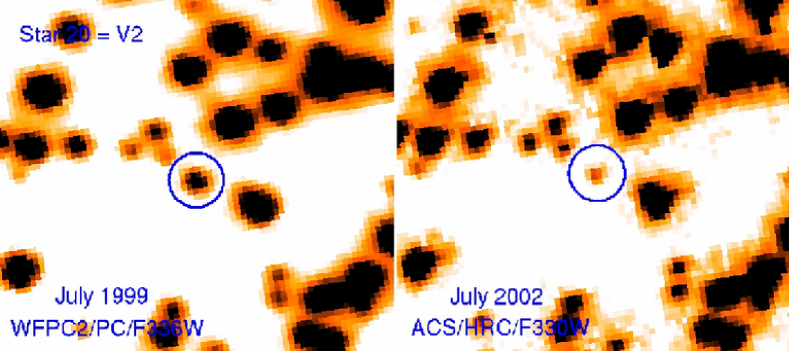
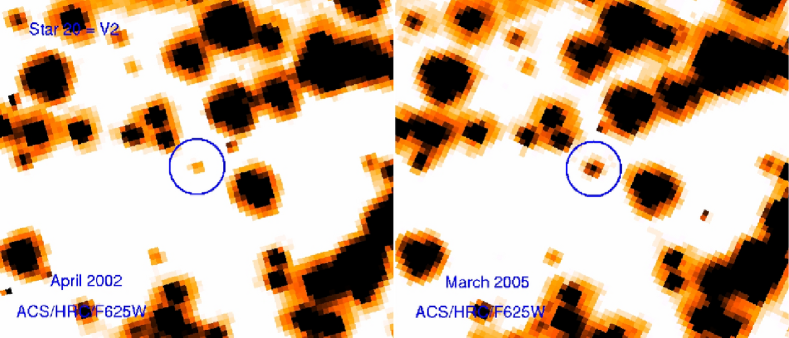
In the process of constructing our broad-band SED, we also found evidence of two additional eruptions of V2, which are shown in Figure 21. First, the ACS/HRC/F330W data point in Figure 20 is 1.7 mag fainter than the older WFPC2/PC/F336W measurement that was used in the construction of the CMD (Figure 3. This suggests that V2 was in outburst in July 1999, the epoch that dominates in our co-added PC/F336W image. This is consistent with the fact that Ferraro et al. (2001) report an even brighter WFPC2/PC/F336W magnitude for V2 from data obtained exclusively in July 1999. The fainter ACS/HRC/F330W measurement would move V2 much closer to the WD sequence in Figure 3. Second, there is a 1.0 mag difference between the two ACS/HRC/F625 magnitude estimates we have for this source. The bright estimate comes from an image taken in March 2005, which is the only image obtained at this time in our optical data set. The discovery of two eruptions in our limited optical data set confirms that V2 is a dwarf nova with a relatively high duty cycle (c.f. Shara et al. 1996).
4.11. Star 27: An SMC Interloper
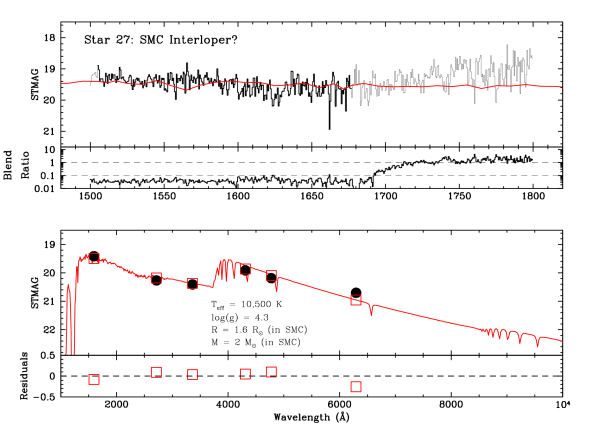
Star 27 is another gap source in Figure 3, and its FUV spectrum and broad-band SED are shown in Figure 22. Despite several attempts, we were unable to find a physically plausible one- or two-component fit to this data that was consistent with the source being a cluster member.
We therefore considered the possibility that Star 27 is a background star. As discussed in Paper I, the outskirts of the SMC are located directly behind 47 Tuc, and roughly one SMC interloper may be expected to contaminate our FUV/optical CMD. Figure 3 shows that Star 27 is a good candidate, since it lies close to the expected location of the SMC main sequence. Note that this object is not included in Figure 4, since there is no proper motion information for it in McLaughlin et al. (2006). Thus a location in the SMC cannot be excluded for Star 27.
In order to test this idea, we changed the distance adopted in our fits to 60 kpc (the average metallicity in the SMC is similar to that of 47 Tuc). We then find that a single-component model with K, and provides a good description of all of the datal. These parameters are entirely reasonable for a slightly evolved star in the SMC. We therefore conclude that Star 27 is an SMC interloper and unrelated to 47 Tuc.
4.12. Star 999: A Bright and Probably Massive Blue Straggler
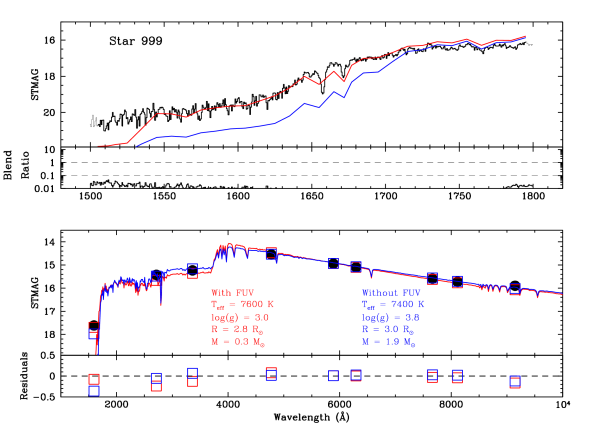
Star 999 is the optically brightest BS in our spectroscopic sample. Its FUV spectrum and broad-band SED are shown in Figure 23, and imply K and for this object. These are reasonable parameters for a BS in 47 Tuc. However, in order to obtain an acceptable single component fit to all of the data, a surprisingly low surface gravity is also required (; red line in Figure 23. Taken at face value, this combination of radius and surface gravity would point to an extremely low mass of for Star 999. This does not seem reasonable for a BS.
There could be physical explanations for such an abnormally low surface gravity, such as fast rotation (Porter & Townsend 2005; Knigge et al. 2006) or the presence of a disk around the star (De Marco et al. 2004). However, before resorting to such explanations, it is worth checking that the spectral models we are using can actually be trusted in the regime we are using them here. The obvious worry here is the reliability of the models in FUV region, since this waveband is on exponential Wien tail of the BS SED where even relatively slight inaccuracies in the model may result in large flux changes.
The work by Castelli & Cacciari (2001) suggests that this worry is well founded. They carried out an extensive FUV analysis of Pop II A-stars, based on the same set of Kurucz models that we employ here. Their main finding was that, for K, model fits to the FUV spectra produce biased surface gravity estimates that are systematically lower than those implied by optical data. For hotter stars, there was no systematic discrepancy between the two sets of estimates.
As a test, we therefore repeated the one-component fit, but excluded the FUV spectrum and photometry. The result of this exercise confirmed our suspicions: the best model fit to the NUV-NIR SED (the blue line in Figure 23) has a similar temperature and radius to the global best fit, but a much higher surface gravity (). The BS mass implied by this fit is therefore also much higher ().
Two points regarding the fits carried out in previous sections are worth making at this stage. First, the effective temperature of Star 10 is just about high enough for our model fit to yield a meaningful surface gravity estimate. Second, the FUV excess seen in the BS Star 2 (and attributed to a WD companion) cannot be attributed to a similar model failure. This can be seen by comparing the FUV properties of Stars 2 and 999 directly. The broad-band FUV magnitude of both stars is dominated by a BS with K, with Star 2 being only 0.2 mag brighter than Star 999. However, at the shortest wavelengths available in the FUV spectra (1500Å - 1600Å), Star 2 is a full 2 mag brighter than Star 999. Thus the massive FUV excess exhibited by Star 2 is not just relative to theoretical models, but also relative to other BSs in the cluster.
Returning to Star 999 itself, it is interesting to note that the mass inferred from our fit to the NUV-NIR SED is just over twice the turn-off mass in 47 Tuc (). This is interesting, since the formation of a BS with must involve three progenitors. Such a “supermassive” BS (SMBS) cannot be formed in a single collision between two MS stars, nor via mass transfer in an ordinary binary system. Unfortunately, the uncertainties on the mass of Star 999 are too large to establish it as a SMBS (the statistical error alone is about 0.4 ). The sample of BSs analysed by De Marco et al. (2005) also contained several candidate SMBSs (including one in NGC 6793 for which Saffer et al. [2002] had derived a preliminary mass estimate of about ). However, none of these candidates could be confirmed conclusively as SMBSs. At the moment, this leaves the BS-MS binary discovered by Knigge et al. (2006) as the most convincing candidate for a BS system with three progenitors in a GC core. However, the first definitive SMBS remains to be discovered.
5. Discussion
Since we have discovered and analysed a fair number of interesting and exotic objects in 47 Tuc, it is worth considering some of the wider implications of our results. In the following sections, we will therefore take a look at three key issues: (i) the binary fraction in 47 Tuc; (ii) the nature and abundance of CVs in GCs; (iii) the significance of systems that are unique even by the standard of most other exotica (such as Star 10 in our sample).
5.1. The White Dwarf Binary Fraction in 47 Tuc
We can use our results to obtain a rough estimate of the binary fraction amongst hot, young WDs in 47 Tuc. As a starting point, we note that our FUV photometry includes 25 objects brighter than and within our spectroscopic field of view. Figure 3 shows that, above this limit, we have useable spectra for all gap objects, all but one BSs and all objects on the WD cooling sequence. Thus we use as an approximate completeness limit for the discovery of WD binary systems in our spectroscopic sample.
There are 5 objects without optical counterparts above this limit, as well as 5 objects on the WD cooling sequence for which we have no evidence of a companion. As a check, we visually inspected the vicinity of each of these 10 FUV sources in the deepest red optical image available. For most objects, this was a 600 s F814W exposure. In a few cases, the location of interest fell outside the F814W field of view or on an image defect, so we used a 350 s F555W exposure instead.101010One object – Star 6 – was outside the field of view of both images, so in this case we inspected a shallower 60 s F814W exposure. No additional red counterparts were found, down to an estimated limit of or better. This excludes the existence of MS companions as bright as that in Star 7.
Thus there are probably 10 single WDs in our bright () sub-sample. This same sub-sample also contains two very probable binary systems containing hot, young WDs (Stars 2 and 7), and one additional possible one (Star 15). CVs have been excluded here, because their WDs are probably accretion-heated, rather than young. We also exclude Star 17, partly because it is a candidate CV, and partly because it, too, could be a chance superposition. A rough estimate of the binary fraction amongst hot WDs in the core of 47 Tuc is then 2/13 (assuming that Star 15 is not a binary), i.e. . The statistical error on this estimate is solely due to small number statistics, whereas the quoted systematic error shows how the maximum-likelihood estimate would change if the true number of WD binaries in our sample was 1 or 3, instead of 2.
Clearly, this estimate needs to be viewed with great caution. Aside from the issues of small number statistics and chance coincidences, we cannot rule out the possibility of faint, lower MS companions to some of the apparently single WDs in our sample. On the other hand, the number of WDs (objects near the cooling sequence in Figure 3, as well as objects without a F336W counterpart) rises considerably more steeply towards fainter magnitudes than the numbers of gap sources and BSs. Since Stars 2 and 15 were found amongst the latter two classes, our binary candidate haul may have been unusually lucky.
While the allowed range we have determined is not yet very constraining, it is certainly consistent with the much more accurate estimates of the binary fraction determined by Albrow et al. (2001) in the core of 47 Tuc. They found based on the number of eclipsing binaries in their data, and based on the number of W UMa stars. Even though the estimate presented here is much less accurate, it is the first to be derived from the WD population of a GC and demonstrates the potential of FUV surveys in this area. Given the importance of core binary fractions to cluster dynamics – and the present controversy surrounding the theoretical predictions (Ivanova et al. 2005; Hurley, Aarseth & Shara 2007; Fregeau 2007) – more accurate WD-based estimates could be extremely valuable.
5.2. Cataclysmic Variables in 47 Tuc and other GCs
Theoretical models for CV formation in GCs predict that a cluster like 47 Tuc should harbour , mostly dynamically-formed CVs (di Stefano & Rappaport 1994; Ivanova et al. 2006; but also see Townsley & Bildsten 2005). Even though recent surveys have at last begun to uncover a sizeable population of CV candidates in GCs, there is still a clear shortfall in the observed numbers relative to these predictions. For example, the combination of deep Chandra X-ray surveys and optical follow-up has so far led to the identification of probable CVs in 47 Tuc (Grindlay et al. 2001a; Edmonds et al. 2003ab; Heinke et al. 2005). However, it is still not clear if this discrepancy points to a problem with our understanding of CV formation and/or evolution, or if it is simply due to observational incompleteness (see Heinke et al. 2005, Ivanova et al. 2006 and Maccarone & Knigge 2007 for discussions of this point).
The present results are relevant to this issue for several reasons. First, the discovery of emission lines in three previously suggested CV candidates in our spectroscopic sample (Star 1 = AKO 9; Star 3 = V1; Star 20 = V2) confirms that combined X-ray-, colour- and variability-based searches are, in fact, finding genuine CVs. This is rather important, since only seven other CVs have so far been spectroscopically confirmed in all Galactic GCs combined. 111111These are CVs 1-4 in NGC 6397 (Grindlay et al. 1995; Edmonds et al. 1999), V101 in M5 (Margon, Downes & Gunn 1981; Naylor et al. 1989; Shara, Moffat & Potter 1990); Nova 1938 in M4 (Shara, Moffat & Potter 1990); and Star 1 in NGC 6624 (Deutsch et al. 1999). Note that the spectroscopically confirmed dwarf nova V4 in the field of M30 (Margon & Downes 1983; Shara, Moffat & Potter 1990) is probably a foreground object (Machin et al. 1991). The only good CV candidate that was not confirmed spectroscopically is Star 10 = PC1-V36. This object was highlighted as a possible CV in Paper I, based on its FUV brightness, variability and possible match to an X-ray ¡source.121212The status of Star 10=PC1-V36 as an X-ray emitter remains uncertain: see the “note added” in Paper I, as well as Edmonds et al. (2003ab) and Heinke et al. (2005). As discussed in Section 4.7, we now find that Star 10 is an even more exotic system.
Second, we have detected the secondary stars in two of our CVs. In Star 1 = AKO 9, the donor is a subgiant, whereas in Star 20 = V2, it is a lower-MS star. Moreover, our SED fit to Star 3 = V1 constrains the secondary in this systems to be a lower-MS star also. In principle, the distribution of donor properties in the CV population is a strong constraint on theoretical models. For example, di Stefano & Rappaport (1994) predict quite a sizeable population of bright, long-period CVs with evolved donors (like AKO 9) in 47 Tuc, whereas such systems are relatively rare in the simulations of Ivanova et al. (2006). As the number of known GC CVs grows, the distributions of orbital period and donor spectral type will become a powerful way to test models of CV formation and evolution.
Third, we estimated in Paper I that CVs should be contained in our FUV imaging survey, based on the predictions by di Stefano & Rappaport (1994). Thus theory and observation would agree perfectly if essentially all gap objects in Figure 3 were CVs. Even though our spectroscopic sample comprises only half (8/16) of the photometrically identified gap objects, it is clear that this scenario is too optimistic. More specifically, even if we include the marginal detection of line emission in Star 17, only half (4/8) of the gap objects in the spectroscopic sample are confirmed as CVs. Is it possible that some or all of the other four gap objects in the spectroscopic sample are nevertheless CVs that we have caught in a state of weak or absent line emission? We believe this is extremely unlikely. The spectroscopic/SED classifications for three of these gap objects convincingly show that they are not CVs: Star 4 is a He WD, Star 10 is a different kind of exotic binary containing a stripped subgiant; Star 27 is an SMC interloper. This leaves Star 15 as the only other viable candidate. However, the possibility that it is really a CV seems remote, given the lack of X-ray emission and FUV variability (Paper I), as well as the possibility that the match between FUV and optical sources could be a chance coincidence (Section 4.8).
Overall then, our results suggest that CVs comprise no more than % of the population in the gap, at least among the brighter objects. Nevertheless, taken at face value, this implies that predicted and observed numbers differ by “only” a factor of about two or three. However, this conclusion is not yet completely robust, both due to the small number statistics involved, and because different theoretical models predict different CV luminosity functions and hence different numbers of observable systems (di Stefano & Rappaport 1994; Ivanova et al. 2006).
5.3. The More Exotic, the Better…
We finally want to briefly highlight what are arguably the three most exotic objects we have uncovered. These are Star 2 (a BS-WD binary), Star 4 (a He WD) and Star 10 = PC1-V36 (a binary containing a dark primary and stripped subgiant secondary). We have already outlined possible formation scenarios for these systems in Sections 4.2, 4.4, and 4.7, so we will not repeat these here. Instead, we just note that our FUV survey has turned out to be an efficient way of finding and classifying such remarkable systems. The gap between the WD and main sequences in the FUV-optical CMD seems to be a particularly fertile hunting ground in this respect: both Stars 4 and 10 are found amongst only 8 gap sources in our spectroscopic sample.
Aside from being intrinsically interesting, the most extreme objects in GCs are important precisely because they are probably quite hard to form. Star 10 may be a good example of this. The very existence of such a system may point to a single, specific formation mechanism. This contrasts with the relatively more common types of stellar exotica, for which there is usually more than one formation channel (for an example in the CV context, see Figure 7 in Ivanova et al. 2006). Thus a single unique object can be the smoking gun that establishes the importance of a particular dynamical process in GCs.
6. Summary & Conclusions
We have presented and analysed FUV spectroscopy for 48 blue objects in the core of 47 Tucanae. For the 12 most interesting and representative cases, we have also assembled broad-band, FUV-NIR spectral energy distributions in order to determine their nature. Our main results are as follows:
-
1.
We have spectroscopically confirmed three previously known or suspected CVs in the cluster core (V1, V2 and AKO 9). For two of these (V2 and AKO 9), we have also found photometric evidence of dwarf nova eruptions in addition to those that were previously known.
-
2.
Only one other source – Star 17, a “gap object” located between the WD and main sequences in the CMD – exhibits marginal evidence for line emission in its spectrum. Thus the gap region is not exclusively populated by CVs, nor are these systems common amongst objects near the top of the WD cooling sequence. Nevertheless, predicted and observed numbers of CVs agree to within a factor of about 2-3.
-
3.
We have discovered a hot ( K), large (), but very low-mass () secondary star in a previously known 0.8 d binary system. This exotic object, Star 10, fills or nearly fills its Roche-lobe and completely dominates the binary’s FUV-NIR output. We suggest that this star is the remains of a subgiant that has been almost completely stripped of its envelope. This stripping could have occurred as a result of mass transfer in the binary system, or during the dynamical interaction that actually formed the system. Since the stripped secondary must be in a short-lived evolutionary state, this object may represent the “smoking gun” of a recent dynamical encounter.
-
4.
We have also found a Helium WD in 47 Tuc (Star 4). This is only the second optically detected such object in this cluster, and the first outside an MSP system. The He WD could have been formed in a primordial binary, or in a binary system formed in an exchange encounter involving a massive NS or WD. No sign of a companion is seen in our data.
-
5.
We have discovered a bright BS with a young WD companion (Star 2). This is the only BS-WD binary known in any GC. However, the apparent rarity of such objects might be a selection effect. Since BS are much brighter than WDs at optical wavelengths, such binaries have been hard to find until now. In our FUV spectrum, the existence of a hot WD companion to the BS can be inferred from a strong FUV excess at the shortest wavelengths.
-
6.
In addition to the objects already discussed, we have found two more candidate WD binary systems. In one of these (Star 15), the apparent companion is a MS star, but this composite object may well be the product of a chance coincidence. However, the other system (Star 7) is likely to be a genuine binary, and the companion in this case is a sub-giant.
-
7.
We have used the number of WD binary systems we have found to place a crude constraint on the WD binary fraction in the core of 47 Tuc. We find . Much stronger constraints can in principle be obtained from larger WD samples constructed from FUV surveys.
-
8.
An SED fit to the optically brightest BS in our spectroscopic sample suggests that the mass of this star may exceed twice the turn-off mass. However, the uncertainties on the mass estimate are too large for this to be conclusive. There is still no definitive example of such a “supermassive” BS in any GC.
Overall, we feel that the present study is an excellent illustration of the wide range of stellar exotica that are lurking in the cores of GCs. In particular, the gap region of the CMD seems to harbour quite a variety of weird and wonderful objects. Most of these systems will have undergone significant dynamical encounters or perhaps have even been formed in one. All of this reenforces the motivation for studying these systems.
We also hope to have shown that FUV surveys – and particularly multi-object slitless FUV specroscopy – provide an excellent and efficient way of achieving this goal. The power of this approach is greatest, however, when it is used in combination with data spanning the widest possible range in wavelength (e.g. the FUV-NIR range). With such panchromatic data sets, we can determine the nature of most of the exotic stellar systems that are hiding in GC cores.
References
- Albrow et al. (2001) Albrow, M. D., Gilliland, R. L., Brown, T. M., Edmonds, P. D., Guhathakurta, P., & Sarajedini, A. 2001, ApJ, 559, 1060
- Auriere et al. (1989) Aurière, M., Koch-Miramond, L., & Ortolani, S. 1989, A&A, 214, 113
- Castelli & Cacciari (2001) Castelli, F., & Cacciari, C. 2001, A&A, 380, 630
- Castelli & Kurucz (2001) Castelli, F., & Kurucz, R. L. 2001, A&A, 372, 260
- Cool et al. (1998) Cool, A. M., Grindlay, J. E., Cohn, H. N., Lugger, P. M., & Bailyn, C. D. 1998, ApJ, 508, L75
- Davies (1997) Davies, M. B. 1997, MNRAS, 288, 117
- De Marco et al. (2004) De Marco, O., Lanz, T., Ouellette, J. A., Zurek, D., & Shara, M. M. 2004, ApJ, 606, L151
- De Marco et al. (2005) De Marco, O., Shara, M. M., Zurek, D., Ouellette, J. A., Lanz, T., Saffer, R. A., & Sepinsky, J. F. 2005, ApJ, 632, 894
- Deutsch et al. (1999) Deutsch, E. W., Margon, B., Anderson, S. F., & Downes, R. A. 1999, AJ, 118, 2888
- Dieball et al. (2007) Dieball, A., Knigge, C., Zurek, D. R., Shara, M. M., Long, K. S., Charles, P. A., & Hannikainen, D. 2007, ApJ, 670, 379
- Dieball et al. (2005) Dieball, A., Knigge, C., Zurek, D. R., Shara, M. M., Long, K. S., Charles, P. A., Hannikainen, D. C., & van Zyl, L. 2005, ApJ, 634, L105
- Dieball et al. (2005) Dieball, A., Knigge, C., Zurek, D. R., Shara, M. M., & Long, K. S. 2005, ApJ, 625, 156
- Di Stefano & Rappaport (1994) Di Stefano, R., & Rappaport, S. 1994, ApJ, 423, 274
- Dolphin (2000) Dolphin, A. E. 2000, PASP, 112, 1383
- Edmonds et al. (1999) Edmonds, P. D., Grindlay, J. E., Cool, A., Cohn, H., Lugger, P., & Bailyn, C. 1999, ApJ, 516, 250
- Edmonds et al. (2001) Edmonds, P. D., Gilliland, R. L., Heinke, C. O., Grindlay, J. E., & Camilo, F. 2001, ApJ, 557, L57
- Edmonds et al. (2003) Edmonds, P. D., Gilliland, R. L., Heinke, C. O., & Grindlay, J. E. 2003a, ApJ, 596, 1177
- Edmonds et al. (2003) Edmonds, P. D., Gilliland, R. L., Heinke, C. O., & Grindlay, J. E. 2003b, ApJ, 596, 1197
- Ferraro et al. (2001) Ferraro, F. R., D’Amico, N., Possenti, A., Mignani, R. P., & Paltrinieri, B. 2001, ApJ, 561, 337
- Fregeau (2007) Fregeau, J. M. 2007, IAUS 246, “Dynamical Evolution of Dense Stellar Systems”, ed. E. Vesperini, in press (arXiv:0710.3167)
- Gänsicke et al. (1995) Gänsicke, B. T., Beuermann, K., & de Martino, D. 1995, A&A, 303, 127
- Gendre et al. (2003) Gendre, B., Barret, D., & Webb, N. 2003a, A&A, 403, L11
- Gendre et al. (2003) Gendre, B., Barret, D., & Webb, N. A. 2003b, A&A, 400, 521
- Gratton et al. (2003) Gratton, R. G., Bragaglia, A., Carretta, E., Clementini, G., Desidera, S., Grundahl, F., & Lucatello, S. 2003, A&A, 408, 529
- Grindlay et al. (1995) Grindlay, J. E., Cool, A. M., Callanan, P. J., Bailyn, C. D., Cohn, H. N., & Lugger, P. M. 1995, ApJ, 455, L47
- Grindlay et al. (2001) Grindlay, J. E., Heinke, C., Edmonds, P. D., & Murray, S. S. 2001a, Science, 292, 2290
- Grindlay et al. (2001) Grindlay, J. E., Heinke, C. O., Edmonds, P. D., Murray, S. S., & Cool, A. M. 2001b, ApJ, 563, L53
- Guhathakurta et al. (1992) Guhathakurta, P., Yanny, B., Schneider, D. P., & Bahcall, J. N. 1992, AJ, 104, 1790
- Hansen et al. (2003) Hansen, B. M. S., Kalogera, V., & Rasio, F. A. 2003, ApJ, 586, 1364
- Heinke et al. (2003) Heinke, C. O., Grindlay, J. E., Lugger, P. M., Cohn, H. N., Edmonds, P. D., Lloyd, D. A., & Cool, A. M. 2003a, ApJ, 598, 501
- Heinke et al. (2003) Heinke, C. O., Grindlay, J. E., Edmonds, P. D., Lloyd, D. A., Murray, S. S., Cohn, H. N., & Lugger, P. M. 2003b, ApJ, 598, 516
- Heinke et al. (2005) Heinke, C. O., Grindlay, J. E., Edmonds, P. D., Cohn, H. N., Lugger, P. M., Camilo, F., Bogdanov, S., & Freire, P. C. 2005, ApJ, 625, 796
- Honeycutt et al. (1998) Honeycutt, R. K., Robertson, J. W., & Turner, G. W. 1998, AJ, 115, 2527
- Honeycutt & Kafka (2004) Honeycutt, R. K., & Kafka, S. 2004, AJ, 128, 1279
- Horne & Marsh (1986) Horne, K., & Marsh, T. R. 1986, MNRAS, 218, 761
- Howell et al. (2000) Howell, J. H., Guhathakurta, P., & Gilliland, R. L. 2000, PASP, 112, 1200
- Hurley et al. (2007) Hurley, J. R., Aarseth, S. J., & Shara, M. M. 2007, ApJ, 665, 707
- Hut et al. (1992) Hut, P., et al. 1992, PASP, 104, 981
- Ivanova et al. (2005) Ivanova, N., Belczynski, K., Fregeau, J. M., & Rasio, F. A. 2005, MNRAS, 358, 572
- Ivanova et al. (2006) Ivanova, N., Heinke, C. O., Rasio, F. A., Taam, R. E., Belczynski, K., & Fregeau, J. 2006, MNRAS, 372, 1043
- Knigge et al. (1995) Knigge, C., Woods, J. A., & Drew, J. E. 1995, MNRAS, 273, 225
- Knigge et al. (1998) Knigge, C., Long, K. S., Wade, R. A., Baptista, R., Horne, K., Hubeny, I., & Rutten, R. G. M. 1998, ApJ, 499, 414
- Knigge et al. (2000) Knigge, C., Long, K. S., Hoard, D. W., Szkody, P., & Dhillon, V. S. 2000, ApJ, 539, L49
- Knigge et al. (2002) Knigge, C., Zurek, D. R., Shara, M. M., & Long, K. S. 2002, ApJ, 579, 752
- Knigge et al. (2003) Knigge, C., Zurek, D. R., Shara, M. M., Long, K. S., & Gilliland, R. L. 2003, ApJ, 599, 1320
- Knigge (2004) Knigge, C. 2004, Modern Physics Letters A, 19, 2013
- Knigge et al. (2004) Knigge, C., Araujo-Betancor, S., Gänsicke, B. T., Long, K. S., Szkody, P., Hoard, D. W., Hynes, R. I., & Dhillon, V. S. 2004, ApJ, 615, L129
- Knigge et al. (2006) Knigge, C., Gilliland, R. L., Dieball, A., Zurek, D. R., Shara, M. M., & Long, K. S. 2006, ApJ, 641, 281
- Knigge (2006) Knigge, C. 2006, MNRAS, 373, 484
- Lombardi et al. (2006) Lombardi, J. C., Jr., Proulx, Z. F., Dooley, K. L., Theriault, E. M., Ivanova, N., & Rasio, F. A. 2006, ApJ, 640, 441
- Maccarone & Knigge (2007) Maccarone, T., & Knigge, C. 2007, Astronomy and Geophysics, 48, 12
- Machin et al. (1991) Machin, G., Callanan, P. J., Allington-Smith, J., Charles, P. A., & Hassall, B. J. M. 1991, MNRAS, 250, 602
- bla (1) Maíz Apellániz, J. 2005, HST/STIS Instrument Science Report, ISR 2005-2
- bla (2) Maíz Apellániz, J. 2007, multispec: A code for the extraction of slitless spectra in crowded fields, http://dae45.iaa.csic.es:8080/ jmaiz/software/multispec/handbook.pdf
- Margon & Downes (1983) Margon, B., & Downes, R. A. 1983, ApJ, 274, L31
- Margon et al. (1981) Margon, B., Downes, R. A., & Gunn, J. E. 1981, ApJ, 247, L89
- McLaughlin et al. (2006) McLaughlin, D. E., Anderson, J., Meylan, G., Gebhardt, K., Pryor, C., Minniti, D., & Phinney, S. 2006, ApJS, 166, 249
- Minniti et al. (1997) Minniti, D., Meylan, G., Pryor, C., Phinney, E. S., Sams, B., & Tinney, C. G. 1997, ApJ, 474, L27
- Naylor et al. (1989) Naylor, T., et al. 1989, MNRAS, 241, 25P
- O’Toole et al. (2006) O’Toole, S. J., Napiwotzki, R., Heber, U., Drechsel, H., Frandsen, S., Grundahl, F., & Bruntt, H. 2006, Baltic Astronomy, 15, 61
- Paczyński (1971) Paczyński, B. 1971, ARA&A, 9, 183
- Paresce & de Marchi (1994) Paresce, F., & de Marchi, G. 1994, ApJ, 427, L33
- Paresce et al. (1992) Paresce, F., de Marchi, G., & Ferraro, F. R. 1992, Nature, 360, 46
- Pooley et al. (2002) Pooley, D., et al. 2002, ApJ, 573, 184
- Pooley et al. (2003) Pooley, D., et al. 2003, ApJ, 591, L131
- Pooley & Hut (2006) Pooley, D., & Hut, P. 2006, ApJ, 646, L143
- Porter & Townsend (2005) Porter, J. M., & Townsend, R. H. D. 2005, ApJ, 623, L129
- Renzini & Fusi Pecci (1988) Renzini, A., & Fusi Pecci, F. 1988, ARA&A, 26, 199
- Serenelli et al. (2002) Serenelli, A. M., Althaus, L. G., Rohrmann, R. D., & Benvenuto, O. G. 2002, MNRAS, 337, 1091
- Saffer et al. (2002) Saffer, R. A., Sepinski, J. F., Demarchi, G., Livio, M., Paresce, F., Shara, M. M., & Zurek, D. 2002, in “Stellar Collisions, Mergers and their Consequences”, ASP Conf. Ser., Vol. 263, ed: M. M. Shara (ASP: San Francisco), p157
- Shara et al. (1990) Shara, M. M., Potter, M., & Moffat, A. F. J. 1990, AJ, 99, 1858
- Shara et al. (1996) Shara, M. M., Bergeron, L. E., Gilliland, R. L., Saha, A., & Petro, L. 1996, ApJ, 471, 804
- Shara and Hurley (2006) Shara, M. M., & Hurley, J. R. 2006, ApJ, 646, 464
- Smak (1981) Smak, J. 1981, Acta Astronomica, 31, 395
- Town (1) Townsley, D. M. & Bildsten L. 2002, ApJ, 565, L35
- Town (2) Townsley, D. M. & Bildsten L. 2005, ApJ, 628, 395
- van Zyl et al. (2004) van Zyl, L., Charles, P. A., Arribas, S., Naylor, T., Mediavilla, E., & Hellier, C. 2004, MNRAS, 350, 649
- Webb et al. (2006) Webb, N. A., Wheatley, P. J., & Barret, D. 2006, A&A, 445, 155
- bla (1111) Warner, B. 1995, “Cataclysmic Variable Stars”, Cambridge Astrophysics Series, Cambridge University Press
- Wood (1995) Wood, M. A. 1995, in: 9th European Workshop on White Dwarfs, Lecture Notes in Physics, Vol. 443, ed: D. Koester & K. Werner (Berlin: Springer-Verlag), p.41
| ID | RA | Dec | CMD | Sep | Var? | PM? | Other Names | Spec/SED Class | ||
|---|---|---|---|---|---|---|---|---|---|---|
| (1) | (2) | (3) | (4) | (5) | (6) | (7) | (8) | (9) | (10) | (11) |
| 1 | 00:24:04.915 | -72:04:55.40 | 15.62 | 17.99 | Gap | 0.95 | Yes | … | AKO 9, W36, PC1-V11,M055581 | CV (WD-SG) |
| 2 | 00:24:06.541 | -72:05:03.20 | 17.37 | 15.72 | BS | 0.74 | Yes | … | M048212 | Binary (BS-WD) |
| 3 | 00:24:04.248 | -72:04:57.99 | 17.53 | 19.11 | Gap | 1.05 | Yes | … | V1, X9, W42, PC1-V47, M053129 | CV (WD-MS) |
| 4 | 00:24:06.353 | -72:04:49.17 | 17.70 | 19.96 | Gap | 1.00 | No | … | M061563 | He WD |
| 5 | 00:24:05.557 | -72:05:02.15 | 18.03 | 20.92 | WD | 1.01 | No | … | M049123 | WD |
| 7 | 00:24:05.794 | -72:04:57.13 | 18.26 | 20.85 | WD | 1.07 | No | … | … | Binary (WD-MS) |
| 10 | 00:24:06.489 | -72:04:52.27 | 18.35 | 18.07 | Gap | 0.59 | No | Yes | W75?, PC1-V36, DM-3, M058539 | Binary (??-Stripped SG) |
| 15 | 00:24:06.563 | -72:05:04.38 | 18.63 | 18.03 | Gap | 1.29 | No | … | M047149 | Binary? (WD-SG)ccThe binary status of this system is not certain due to the possibility of a chance superposition. |
| 17 | 00:24:06.390 | -72:05:07.37 | 18.77 | 18.61 | Gap | 1.20 | No | … | M044437 | Binary? (WD-SG)ccThe binary status of this system is not certain due to the possibility of a chance superposition.; CV? |
| 20 | 00:24:05.992 | -72:04:56.11 | 18.99 | 19.94 | Gap | 1.07 | Yes | … | V2, X19, W30, PV1-V53, M054898 | CV (WD-MS) |
| 27 | 00:24:06.850 | -72:04:53.35 | 19.41 | 20.66 | Gap | 0.75 | No | … | M057483 | SMC Interloper |
| 999 | 00:24:04.009 | -72:04:51.24 | 17.61 | 15.72 | BS | … | … | … | M059651aaThe master image of McLaughlin et al. (2006) is saturated and/or confused in the vicinity of this object. | BS |
| 6 | 00:24:08.459 | -72:04:50.58 | 18.15 | … | NoOpt | … | No | … | … | … |
| 8 | 00:24:04.912 | -72:04:51.67 | 18.27 | … | NoOpt | … | No | … | … | … |
| 9 | 00:24:07.443 | -72:05:07.43 | 18.33 | 21.10 | WD | 1.43 | No | … | … | … |
| 12 | 00:24:07.919 | -72:04:52.99 | 18.41 | 15.87 | BS | 0.48 | Yes | Yes | M057848 | … |
| 13 | 00:24:04.890 | -72:05:03.61 | 18.46 | 21.36 | WD | 1.24 | No | … | … | … |
| 14 | 00:24:05.554 | -72:04:53.94 | 18.51 | 16.15 | BS | 0.44 | No | Yes | DM-9, M056964 | … |
| 16 | 00:24:06.511 | -72:04:50.28 | 18.76 | 16.34 | BS | 0.43 | Yes | Yes | M060466bbThis object has a near neighbour that was not detected in McLaughlin et al. (2006). | … |
| 18 | 00:24:05.266 | -72:04:59.02 | 18.99 | 21.74 | WD | 1.00 | No | … | … | … |
| 23 | 00:24:06.398 | -72:04:53.92 | 19.10 | 16.26 | BS | 1.34 | No | Yes | DM-5,M056966bbThis object has a near neighbour that was not detected in McLaughlin et al. (2006). | … |
| 24 | 00:24:06.122 | -72:04:51.84 | 19.14 | … | NoOpt | … | No | … | … | … |
| 25 | 00:24:08.023 | -72:05:06.30 | 19.18 | … | NoOpt | … | No | … | … | … |
| 26 | 00:24:07.456 | -72:04:57.08 | 19.25 | … | NoOpt | … | No | … | … | … |
| 29 | 00:24:07.933 | -72:04:57.06 | 19.48 | 22.14 | WD | 1.18 | No | … | M053994 | … |
| 30 | 00:24:07.024 | -72:04:49.13 | 19.51 | 21.93 | WD | 0.63 | No | … | … | … |
| 31 | 00:24:04.246 | -72:04:51.39 | 19.58 | 22.29 | WD | 0.75 | No | … | … | … |
| 32 | 00:24:03.646 | -72:05:04.15 | 19.59 | … | NoOpt | … | No | … | … | … |
| 33 | 00:24:05.986 | -72:04:58.37 | 19.62 | … | NoOpt | … | No | … | … | … |
| 36 | 00:24:04.171 | -72:05:02.45 | 19.71 | … | NoOpt | … | No | … | … | … |
| 37 | 00:24:05.234 | -72:05:02.06 | 19.72 | … | NoOpt | … | No | … | … | … |
| 38 | 00:24:07.375 | -72:04:51.13 | 19.77 | 22.33 | WD | 0.82 | No | … | … | … |
| 42 | 00:24:05.982 | -72:04:55.34 | 19.99 | … | NoOpt | … | No | … | … | … |
| 46 | 00:24:07.228 | -72:05:01.21 | 20.16 | … | NoOpt | … | No | … | … | … |
| 47 | 00:24:04.623 | -72:04:47.95 | 20.20 | … | NoOpt | … | No | … | … | … |
| 49 | 00:24:06.085 | -72:05:06.72 | 20.27 | … | NoOpt | … | No | … | … | … |
| 52 | 00:24:05.964 | -72:04:48.94 | 20.40 | 16.73 | BS | 0.52 | No | Yes | M061787aaThe master image of McLaughlin et al. (2006) is saturated and/or confused in the vicinity of this object. | … |
| 54 | 00:24:05.736 | -72:04:53.31 | 20.47 | 16.80 | BS | 0.27 | No | Yes | M057553 | … |
| 59 | 00:24:07.383 | -72:05:05.76 | 20.55 | … | NoOpt | … | No | … | … | … |
| 66 | 00:24:04.299 | -72:05:05.01 | 20.68 | … | NoOpt | … | No | … | … | … |
| 67 | 00:24:04.096 | -72:04:51.27 | 20.69 | … | NoOpt | … | No | … | … | … |
| 73 | 00:24:08.222 | -72:04:52.19 | 20.86 | … | NoOpt | … | No | … | … | … |
| 78 | 00:24:04.374 | -72:04:58.26 | 20.99 | … | NoOpt | … | No | … | … | … |
| 79 | 00:24:08.240 | -72:04:53.58 | 21.00 | … | NoOpt | … | No | … | … | … |
| 81 | 00:24:06.308 | -72:05:05.27 | 21.05 | … | NoOpt | … | No | … | … | … |
| 82 | 00:24:06.800 | -72:05:00.12 | 21.06 | … | NoOpt | … | No | … | … | … |
| 84 | 00:24:07.678 | -72:04:55.88 | 21.09 | … | NoOpt | … | No | … | … | … |
| 85 | 00:24:06.341 | -72:04:51.16 | 21.17 | … | NoOpt | … | No | … | … | … |
Note. — Column definitions:
(1) Spectrosopic identification number; c.f. Figure 1
(2) Right ascension (J2000); boresight corrected to match positions in Heinke et al. (2005).
(3) Declination (J2000); boresight corrected to match positions in Heinke et al. (2005).
(4) STIS/FUV-MAMA/F25QTZ magnitude (STMAG system).
(5) WFPC2/PC/F336W magnitude (STMAG system).
(6) CMD-based classification; see Section 2.3 and Figure 3.
(7) Offset between FUV and F336W position in STIS/FUV-MAMA pixels (1 pix 0.025″).
(8) Variable in FUV photometry? (See Paper I for details.)
(9) Proper motion consistent with cluster membership? (Only if available in McLaughlin et al. [2006].)
(10) Alternative names are taken from the following catalogues:
AKO n = Star n in Aurière, Koch-Miramond & Ortolani (1989);
Vn = Variable star n as defined by Paresce, De Marchi & Ferraro (1992) and Paresce & De Marchi(1994)
Wn = Star n in Grindlay et al. (2001a) and Heinke et al. (2005);
PC1-Vn = Variable star n on the PC1 chip in Albrow et al. (2001);
Mn = Star n in the master catalogue of McLaughlin et al. (2006);
DM-n = Star 104-n in De Marco et al. (2005).
(11) Final classification based on FUV spectrum and FUV-NIR SED (Section 4). Notation as in text, except G=subgiant.