The oldest X-ray supernovae: X-ray emission from 1941C, 1959D, 1968D
Abstract
We have studied the X-ray emission from four historical Type-II supernovae (the newly-recovered 1941C in NGC 4631 and 1959D in NGC 7331; and 1968D, 1980K in NGC 6946), using Chandra ACIS-S imaging. In particular, the first three are the oldest ever found in the X-ray band, and provide constraints on the properties of the stellar wind and circumstellar matter encountered by the expanding shock at more advanced stages in the transition towards the remnant phase. We estimate emitted luminosities erg s-1 for SN 1941C, a few erg s-1 for SN 1959D, erg s-1 for SN 1968D, and erg s-1 for SN 1980K, in the – keV band. X-ray spectral fits to SN 1968D suggest the presence of a harder component, possibly a power law with photon index , contributing erg s-1 in the – keV band. We speculate that it may be evidence of non-thermal emission from a Crab-like young pulsar.
Subject headings:
circumstellar matter — supernova remnants — supernovae: individual (SN 1941C, SN 1959D, SN 1968D, SN 1980K) – X-rays: general — X-rays: individual (SN 1941C, SN 1959D, SN 1968D, SN 1980K)1. Introduction
Circumstellar interaction models (Fransson et al., 1996; Immler & Lewin, 2003) predict two characteristic phases in the evolution of a core-collapse supernova (SN) over timescales of a few decades. In the first few years, the outgoing shock front is expanding through the material deposited by stellar winds from the progenitor star. During this phase, the radio and X-ray emission decline at a rate with – (Immler & Lewin, 2003; Immler & Kuntz, 2005; Stockdale et al., 2006). After a few decades, the shock reaches the boundary with the interstellar medium (SN remnant phase), and the luminosity decline flattens. Thus, studying the evolution of an ageing SN, as it evolves towards the remnant stage, can provide information on the final few thousand years of evolution of the progenitor star. Characteristic temperatures of the shocked gas are – keV, leading to emission in the soft X-ray band.
Soft thermal emission may not be the only source of X-rays in an ageing SN. A large fraction of core-collapse SNe (about 87% for a solar metallicity and a Salpeter initial mass function; Heger et al. 2003) is expected to leave behind a spinning, isolated neutron star. Observations of known pulsars show that a fraction of the rotational energy loss is converted into X-ray radiation (Becker & Trumper, 1997; Possenti et al., 2002) making many neutron stars visible as young X-ray pulsars, after the central region becomes optically thin (a few decades; Chevalier & Fransson 1994). If most pulsars had millisecond periods at birth, they would constitute a substantial fraction of the population of X-ray point sources in star-forming galaxies (Perna & Stella, 2004). Conversely, limits on the X-ray luminosities of a sizeble sample of young pulsars can be used to constrain their initial , and hence the distribution of their spin periods at birth (Perna et al., 2008). Since very young SNe have a substantial optical depth, for these studies it is especially important to gather a sample of ageing SNe, and measure or constrain the X-ray luminosity of the pulsars possibly created in those events.
Only 35 core-collapse SNe have been found in X-rays so far111http://lheawww.gsfc.nasa.gov/users/immler/supernovae_list.html; and there is still a big gap between the oldest historical SNe and the youngest remnants. In this Letter we report our study of X-ray emission from four historical SNe, using Chandra X-ray Observatory data: SN 1941C, SN 1959D, SN 1968D and SN 1980K. The first 3 are the oldest ever found in the X-ray band.
| Galaxy | Distance | SN ID | RA | Dec | Obs ID | Date | Live time |
|---|---|---|---|---|---|---|---|
| (Mpc) | (ks) | ||||||
| NGC 4136 | 10 | 1941C | 12:09:21.01 | 29:54:32.5 | 2920 | 2002-03-07 | 18.5 |
| 2921 | 2002-06-08 | 19.7 | |||||
| NGC 7331 | 15 | 1959D | 22:37:01.82 | 34:25:08.3 | 2198 | 2001-01-27 | 29.5 |
| NGC 6946 | 6 | 1968D | 20:34:58.40 | 60:09:34.4 | 1043 | 2001-09-07 | 58.3 |
| 4404 | 2002-11-25 | 30.0 | |||||
| 4631 | 2004-10-22 | 29.7 | |||||
| 4632 | 2004-11-06 | 28.0 | |||||
| 4633 | 2004-12-03 | 26.6 |
2. Data analysis
We searched the Chandra public archive, and downloaded the observations that included in the field of view the location of historical core-collapse SNe older than 1970G (the oldest X-ray SN listed in Immler’s catalog, which had overlooked SN 1968D; see Section 3.3). We limited our search to host galaxies at distances Mpc. The optical position of the SNe was taken from the CfA List of Supernovae222http://cfa-www.harvard.edu/iau/lists/Supernovae.html, the Asiago Catalogue333http://web.pd.astro.it/supern/snean.txt and the Sternberg Catalogue (Tsvetkov et al., 2004). We estimate that optical positions have uncertainties between 1″and 2″. We used the Chandra Interactive Analysis of Observations (CIAO) software package (Version 3.4) to extract and examine the images in the full – keV band, as well as in narrower bands. In particular, we used the wavdetect source finding routine. We found point-like X-ray sources associated with the SN position in three cases: SN 1941C in NGC 4136; SN 1959D in NGC 7331; and SN 1968D in NGC 6946, where we also recovered SN 1980K. We then studied those systems in more detail.
NGC 4136 was observed by Chandra/ACIS-S twice: on 2002 March 07 (ObsID 2920), for a live time of 18.5 ks, and on 2002 June 08 (ObsID 2921), for a live time of 19.7 ks. The level-2 event files in the public archive were created in 2006 with the standard data processing version DS7.6.8 (i.e., with recent calibration data), and did not require reprocessing or astrometric corrections. We defined a circular source region with radius 25 (comprising 95% of the source counts at 2 keV, on axis), centered on the X-ray source, within 1″ from the approximative optical position of SN 1941C. There are no other X-ray sources in a radius of 25″, so a chance coincidence is very unlikely. We extracted the background from an annulus of radii 4″ and 10″. We used the CIAO task psextract to create the source file, and mkacisrmf for the response. We recalculated the auxiliary response file with mkarf. Considering the small number of detected counts, and the proximity of the two observations compared with the age of the SN, we coadded the two spectra for subsequent flux estimates, using a local code (Page et al., 2003).
NGC 7331 was observed by Chandra/ACIS-S on 2001 January 27 (ObsID 2198), for a live time of 29.5 ks. The level-2 event file from the archive was created with the standard data processing version DS7.6.8 and did not require reprocessing. There is a faint source at significance at the position of SN 1959D ( 1″ from the optical position) and no other sources within 10″. We centered our source and background extraction regions around the X-ray position, and applied the CIAO tasks mentioned above.
NGC 6946 was observed by Chandra/ACIS-S on 5 occasions between 2001 September 07 and 2004 December 03 (see Table 1 for details). The combined live time is 172.6 ks. The level-2 event files in the archive were produced with recent versions of the calibration files (DS 7.6.7.1 and DS7.6.8) and did not need reprocessing. A moderately bright source is detected at high significance at the position of SN 1968D in each of the observations; SN 1980K is found in the last four observations (it is outside the field of view in the first one). We extracted the source spectra, with associated background, response and auxiliary response files, as explained above. We then studied both the individual spectra and a coadded one from all observations.
Finally, after we extracted all the spectra, we used XSPEC Version 12 (Arnaud, 1996) to do spectral fitting (when possible) or estimate flux rates in different bands.
| Parameter | Model 1 | Model 2 | Model 3 |
| Value | Value | Value | |
| aaFrom Kalberla et al. (2005). Units of cm-2. | |||
| bbPhoton index. | - | ||
| ccUnits of photons keV-1 cm-2 s-1, at 1 keV. | - | ||
| (keV) | - | ||
| - | |||
| ddRaymond-Smith model normalization , where is the angular size distance to the source (cm), is the electron density (cm-3), and is the hydrogen density (cm-3). | - | ||
| C-stat/dof | |||
| /dof | |||
| eeObserved flux in the – keV band; units of erg cm-2 s-1. | |||
| ffUnabsorbed luminosity in the – keV band; units of erg s-1. | |||
| ggUnabsorbed luminosity in the – keV band; units of erg s-1. | |||
| hhUnabsorbed luminosity in the – keV band; units of erg s-1. |
3. Results
3.1. SN 1941C
SN 1941C is a Type-II SN (no further sub-classification available) discovered on 1941 April 16 (Jones, 1941) in the face-on SBc galaxy NGC 4136. Chandra observed it yr later. From the combined 38-ks observation, we estimate a count rate of ct s-1 in the – keV band. With only net counts, we cannot do much spectral fitting; however, we have enough counts to find that the emission is not entirely in the soft band. We estimate a count rate of in the – keV band (i.e., about 6 out of 25 background-subtracted counts). Assuming a fixed line-of-sight absorption of cm-2 (Kalberla et al., 2005), and using Cash statistics (Cash, 1979), we find that the X-ray colors are roughly consistent with a thermal plasma at keV (with a 90% confidence limit of keV), or with a power-law spectrum with photon index .
The distance to the host galaxy is Mpc (Tully, 1988), or Mpc (Gusev et al., 2003). For the thermal-plasma model, the unabsorbed luminosity of SN 1941C in the – keV band is erg s-1, where . For the power-law model, the unabsorbed luminosity is erg s-1 in the – keV band, and erg s-1 in the – keV band.
3.2. SN 1959D
SN 1959D is a Type-IIL SN discovered on 1959 June 28 (Humason, 1959) in the Sbc galaxy NC 7331 ( Mpc: Hughes et al. 1998). Chandra observed it at an age of yr. We found an excess of ACIS-S counts at the SN position: 7 total cts in the – keV band from the source extraction region, compared with an average local background of cts. It is the only point-like X-ray excess in a radius 10″ around the optical position. The background emission is mostly from diffuse hot gas, because the SN is relatively close to the star-forming galactic center. We used the Bayesian method of Kraft et al. (1991) to determine whether this could be considered a statistically-significant detection. We obtain from their tables that the 90% confidence limit is between 1.5 and 10.5 net counts. Hence, we conclude that a source coincident with the SN position is formally detected at the 90% level. A longer observation is clearly needed to test this speculative result.
Assuming line-of-sight cm-2 (Kalberla et al., 2005), and a power-law spectrum with , 5 net counts ( ct s-1) correspond to an indicative emitted luminosity erg s-1 in the – keV band. Using the 90% confidence limit from Bayesian statistics, the X-ray luminosity is constrained between – erg s-1. For an optically-thin thermal spectrum at keV, the corresponding luminosity range is – erg s-1.
3.3. SN 1968D and SN 1980K
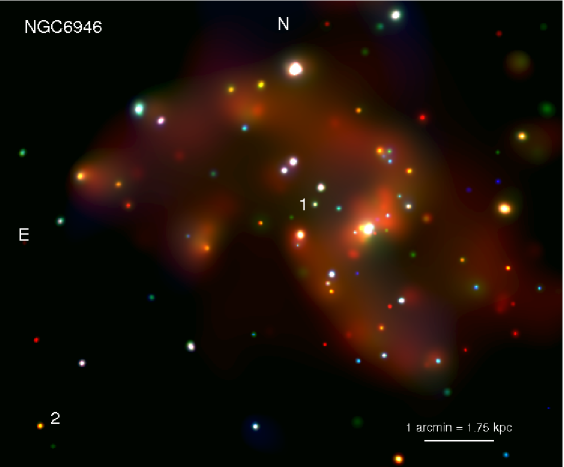
Discovered on 1968 February 29 (Dunlap, 1968; Wild, 1968), the Type-II SN 1968D is hosted by the SABcd galaxy NGC 6946. Located at a distance of Mpc (Karachentsev et al., 2000; Eastman et al., 1996), NGC 6946 has produced 9 SNe (mostly of Type II) between 1917 and 2008—the highest number in a single galaxy. Five of them occurred before 1970; of these, only SN 1968D is detected in the X-ray band (earlier SNe have also larger uncertainties in their optical positions). SN 1968D is among the brightest X-ray sources in the galaxy (Figure 1). It was first recovered by Holt et al. (2003) (see also Schlegel 2006), although it was overlooked by Immler & Kuntz (2005) and was not included in Immler’s online catalog.
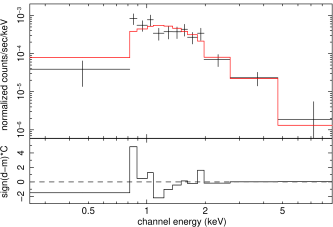
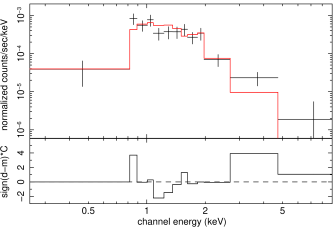
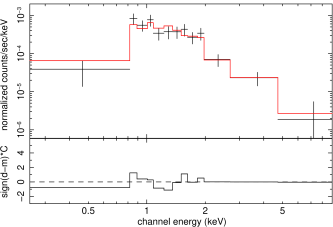
We studied the X-ray colors and fluxes from each of the five Chandra observations, and then coadded the individual spectra to achieve sufficient signal-to-noise for spectral fitting. This is justified by the short time interval between the observations, compared with the age of the SN. The coadded spectrum has 120 total counts in the – keV band, and net counts. We rebinned the spectrum to have 9 counts per channel and used the Cash statistic to fit the spectrum (but we also verified that fits based on the statistic give almost identical results). We used a power-law model, an optically-thin thermal plasma model, and both components simultaneously (Table 2), leaving the neutral column density free to vary. All three models give statistically acceptable fits. However, the power-law model underestimates the soft emission and requires an unphysically steep photon index. On the other hand, the thermal-plasma model slightly underestimates the emission above 2 keV. Thus, it is plausible that the X-ray emission is a combination of a non-thermal and a thermal component (Figure 2). In this case, we found the best-fit parameters keV for the gas temperature, and ct s-1 for the power-law photon index. All models suggest that the absorbing column density is substantially larger than the Galactic line-of-sight column (Table 2); the emission is completely absorbed at energies keV. Such large absorption leads to uncertainties in the estimate of the emitted luminosity. We infer – erg s-1 in the – keV band, and erg s-1 in the – keV band, from the power-law component.
We find some marginal variability but not a statistically-significant trend in the net count rate over the 5 observations (Table 3). The average observed flux from the first two datasets (from 2001–2002) is slightly higher than the average observed flux from the last three, but we cannot attribute this variability to a long-term decline, because of the large uncertainties.
NGC 6946 contains various other ageing core-collapse SNe. We did not find any evidence of SN 1917A and SN 1948B. However, we have recovered SN 1980K, previously detected by Einstein a month after the explosion (Canizares et al., 1982), and by ROSAT 12 years later (Schlegel, 1994). An X-ray study of SN 1980K is also independently presented by Fridriksson et al. (2008). It has an optically-thin thermal spectrum with keV and an average emitted X-ray luminosity erg s-1, in the – keV band (in fact, it has no detected emission above 2 keV). This is consistent with a value of erg s-1 in the same band, estimated from the ROSAT data (Schlegel, 1994), after rescaling to the same adopted distance. We leave a more detailed discussion to a separate work.
| Rate ( ACIS-S ct s-1) | ||||||
|---|---|---|---|---|---|---|
| Date | SN age | – keV | – keV | – keV | – keV | – keV |
| (days) | expected from best fit | |||||
| 2001-09-07 | 12244 | |||||
| 2002-11-25 | 12688 | |||||
| 2004-10-22 | 13385 | |||||
| 2004-11-06 | 13400 | |||||
| 2004-12-03 | 13427 | |||||
4. Discussion
Our main result is the X-ray discovery of at least one, and probably two historical SNe, and a detailed study of another one, at ages between – yr. This is thought to be the characteristic age at which the outgoing shock reaches the interstellar medium, that is when the SN becomes a SN remnant (Immler & Lewin, 2003). Before this study, SN 1968D and SN 1970G were the oldest confirmed detections (Holt et al., 2003; Immler & Kuntz, 2005): we have now pushed the X-ray record to SN 1941C. (SN 1923A has the overall record, having been detected in the 6-cm radio band 75 years later, but is not visible in X-rays; (Stockdale et al., 2006)). Of the three new sources, only SN 1968D had enough counts for spectral fitting. However, all three detections will be useful for deeper follow-up observations and multiband comparisons, and will provide constraining datapoints to model the luminosity decline in years to come. There are 25 historical core-collapse SNe older than SN 1970G at distances Mpc: 16 of them are undetected in X-rays, with erg s-1; 3 are detected, as discussed in this paper; the remaining 6 have not been observed by Chandra or XMM-Newton yet (apart from snapshots, too short to provide meaningful constraints). We estimate emitted luminosities erg s-1 for SN 1941C, a few erg s-1 for SN 1959D, and erg s-1 for SN 1968D, in the – keV band. We have also recovered another SN in NGC 6946, 1980K, visible in the Chandra observations from 2002–2004, at a luminosity erg s-1, in the – keV band (Soria et al., in prep.; see also Fridriksson et al 2008).
The optically-thin thermal-plasma emission from an ageing SN comes from the shocked gas between the reverse shock and the outgoing shell of ejecta. The X-ray luminosity constrains the mass-loss rate of the progenitor, via the relation , where is the mean mass per particle, is the cooling function at temperature , the mass-loss rate of the progenitor, the stellar wind speed and the speed of the outgoing shock (Immler et al., 2002; Immler & Lewin, 2003). Hence, the X-ray luminosity of a SN at an age depends on the wind properties of the progenitor at an age before the explosion. For our fitted luminosity of SN 1941C, using the numerical values from Immler & Kuntz (2005), we infer a mass-loss rate yr-1 at yr before the SN. For SN 1968D (Table 2), the inferred mass-loss rate is yr-1 at yr before the SN; for SN 1980K, yr-1 at a time yr. More likely, these should be considered as an order of magnitude estimates. The X-ray luminosity and mass-loss rate of SN 1968D suggest that this SN is evolving to a remnant similar to Cas A (Dunne et al., 2003; Hwang et al., 2004). The similarity between SN 1968D and Cas A was also noted from radio observations (Hyman et al., 1995).
In Type-II SNe, the synchrotron radio emission is produced by electrons accelerated at the outgoing shock front, where the ionized circumstellar wind is compressed, and the magnetic field locked in it is amplified (Chevalier, 1982a, b; Weiler et al., 1986, 1992). Thus, the radio luminosity is also a function of (Weiler et al., 1986). However, a single radio measurement at late times is generally not sufficient to determine the mass-loss rate; one has to know other parameters such as the density profile of the ejecta and the optical depth and flux at early times (e.g., 1 day after the explosion). Of the four X-ray SNe discussed here, 1980K is the only one for which a detailed radio lightcurve is available (Montes et al., 1998). From a detailed modelling of their data, Montes et al. (1998) infer a mass-loss rate yr-1 for the first 10 yrs after the SN, possibly declining to yr-1 after that. This is in good agreement with the X-ray estimate.
We found no published radio fluxes or limits for SN 1941C. There are three upper limits for SN 1959D, at – yrs after the explosion (Eck et al., 2002), and a radio detection for SN 1968D, yrs after the event (Hyman et al., 1995). In the absence of early-time data or detailed radio lightcurves, it may still be possible to estimate , by using characteristic parameters from another SN assumed as a standard template; for example, Eck et al. (2002) suggest an empirical formula based on the behaviour of SN 1979C. Using their formula, the stellar mass-loss rate for SN 1959D would be yr-1, and yr-1 for SN 1968D, an order of magnitude less than estimated from the X-ray luminosity. However, we suspect that Eck’s scaling may under-estimate some mass-loss rates. For instance, the same relation gives yr-1 for SN 1980K, three times less than calculated from detailed radio modelling; for SN 1970G, Eck’s formula implies yr-1 while the X-ray estimate is – yr-1 (Immler & Kuntz, 2005). A more accurate estimate of the mass-loss rate is important not only to determine the type of progenitor star, but also to constrain the time of transition between the SN and SN remnant phase: the outgoing shock overtakes the stellar wind bubble and reaches the interstellar medium after a characteristic time yr (Weiler et al., 1986). We leave a more detailed comparison of radio- and X-ray-inferred rates in SN 1980K and other X-ray SNe to further work.
The presence of a power-law-like emission component above 2 keV in SN 1968D suggests that there may be a contribution from a young pulsar and its wind nebula. We estimate an average power-law luminosity erg s-1, in the – keV band. Interestingly, this is comparable to the luminosity of Crab-like systems (Possenti et al., 2002), and in particular the Crab itself and PSR B054069 (Serafimovich et al., 2004). Therefore, deep X-ray observations of SNe older than about 30 years are optimally suited for the discovery of very young pulsars, and hence to constrain the statistics of pulsar formation, as well as the distribution of their spins at birth.
References
- Arnaud (1996) Arnaud, K. A. 1996, in ASP Conf. Ser., Vol. 101, Astronomical Data Analysis Software and Systems V, ed. G. H. Jacoby & J. Barnes (San Francisco: ASP), 17
- Becker & Trumper (1997) Becker, W., & Trumper, J. 1997, A&A, 326, 682
- Canizares et al. (1982) Canizares, C. R., Kriss, G. A., & Feigelson, E. D. 1982, ApJ, 253, L17
- Cash (1979) Cash, W. 1979, ApJ, 228, 939
- Chevalier (1982a) Chevalier, R. 1982, ApJ, 259, 302
- Chevalier (1982b) Chevalier, R. 1982, ApJ, 259, L85
- Chevalier & Fransson (1994) Chevalier, R., & Fransson, C. 1994, ApJ, 420, 268
- Dunlap (1968) Dunlap, J. R. 1968, IAUC 2057
- Dunne et al. (2003) Dunne, L., Eales, S., Ivison, R., Morgan, H., & Edmunds, M. 2003, Nat., 424, 285
- Eastman et al. (1996) Eastman, R. G., Schmidt, B. P., & Kirshner, R. 1996, ApJ, 466, 911
- Eck et al. (2002) Eck, C. R., Cowan, J. J., & Branch, D. 2002, ApJ, 573, 306
- Fransson et al. (1996) Fransson, C., Lundqvist, P., & Chevalier, R. A. 1996, ApJ, 461, 993
- Fridriksson et al. (2008) Fridriksson, J. K., Homan, J., Lewin, W. H. G., Kong, A. K. H., & Pooley, D. 2008, ApJS, in press (arXiv:0804.1411)
- Gusev et al. (2003) Gusev, A. S., Zasov, A. V., & Kaisin, S. S. 2003, AstL, 29, 363
- Hyman et al. (1995) Hyman, S. D., van Dyk, S. D., Weiler, K. W., & Sramek, R. A. 1995, ApJ, 443L, 77
- Heger et al. (2003) Heger, A., Fryer, C. L., Woosley, S. E., Langer, N., & Hartmann, D. H. 2003, ApJ, 591, 288
- Holt et al. (2003) Holt, S. S., Schlegel, E. M., Hwang, U., & Petre, R. 2003, ApJ, 588, 792
- Hughes et al. (1998) Hughes, S. M. G., et al. 1998, ApJ, 501, 32
- Humason (1959) Humason, M. L 1959, IAUC 1682
- Hwang et al. (2004) Hwang, U., et al. 2004, ApJ, 615L, 117
- Immler et al. (2002) Immler, S., Wilson, A. S., & Terashima, Y. 2002, ApJ, 573, L27
- Immler & Lewin (2003) Immler, S., & Lewin, W. H. G. 2003, in Supernovae and Gamma-Ray Bursters, ed. K. Weiler (Berlin: Springer), 91
- Immler & Kuntz (2005) Immler, S., & Kuntz, K. D. 2005, ApJ, 632, L99
- Jones (1941) Jones, R. 1941, IAUC 866
- Kalberla et al. (2005) Kalberla, P. M. W., Burton, W. B., Hartmann, D., Arnal, E. M., Bajaja, E., Morras, R., & Poppel, W. G. L. 2005, A&A, 440, 775
- Karachentsev et al. (2000) Karachentsev, I. D., Sharina, M. E., & Huchtmeier, W. K. 2000, A&A, 362, 544
- Kraft et al. (1991) Kraft, R. P., Burrows, D. N., & Nousek, J. A. 1991, ApJ, 374, 344
- Montes et al. (1998) Montes, M. J., van Dyk, S. D., Weiler, K. W., Sramek, R. A., & Panagia, N. 1998, ApJ, 506, 874
- Page et al. (2003) Page, M. J., Davis, S. W., & Salvi, N. J. 2003, MNRAS, 343, 1241
- Perna & Stella (2004) Perna, R., & Stella, L. 2004, ApJ, 615, 222
- Perna et al. (2008) Perna, R., Soria, R., Pooley, D., & Stella, L. 2008, MNRAS, 384, 1638
- Possenti et al. (2002) Possenti, A., Cerutti, R., Colpi, M. & Mereghetti, S. 2002, A&A, 387, 993
- Schlegel (1994) Schlegel, E. M. 1994, AJ, 108, 1893
- Schlegel (2006) Schlegel, E. M. 2006, in Populations of High-Energy Sources in Galaxies, proceedings of the 230th Symposium of the IAU (Dublin, Ireland, Aug 2005), eds. E. J. A. Meurs and G. Fabbiano (Cambridge: University Press), 252
- Serafimovich et al. (2004) Serafimovich, N. I., Shibanov, Y. A., Lundqvist, P., & Sollerman, J. 2004, A&A, 425, 1041
- Stockdale et al. (2006) Stockdale, C. J., Maddox, L. A., Cowan, J. J., Prestwich, A., Kilgard, R., & Immler, S. 2006, AJ, 131, 889
- Tully (1988) Tully, R. B. 1988, Nearby Galaxies Catalogue (Cambridge University: Cambridge)
- Tsvetkov et al. (2004) Tsvetkov, D. Y., Pavlyuk, N. N., & Bartunov, O. S. 2004, Astron. Lett., 30, 729
- Weiler et al. (1986) Weiler, K. W., Sramek, R. A., Panagia, N., van der Hulst, J. M., & Salvati, M. 1986, ApJ, 301, 790
- Weiler et al. (1992) Weiler, K. W., van Dyk, S. D., Panagia, N., & Sramek, R. A. 1992, ApJ, 398, 248
- Wild (1968) Wild, P. 1968, IAUC 2057