Galaxies behind Lensing Clusters: Contrast with Field Search Results
Abstract
We conduct a search for dropout galaxies behind 11 massive lensing clusters using 21 arcmin2 of deep HST NICMOS, ACS, and WFPC2 image data. In total, over this entire area, we find only one robust -dropout candidate (previously reported around Abell 1689). Four less robust -dropout and -dropout candidates are also found. The nature of the four weaker candidates could not be precisely determined due to the limited depth of the available optical data, but detailed simulations suggest that all four could be low-redshift interlopers. We compare these numbers with what we might expect using the UV luminosity function (LF) determined from field searches. We predict 2.7 -dropouts and 0.3 -dropouts over our cluster search area, in reasonable agreement with our observational results, given the small numbers. The number of candidates we find in the present search are much lower than has been reported in several previous studies of the prevalence of galaxies behind lensing clusters. To understand these differences, we examined candidates in other studies and conclude that only a small fraction are likely to be galaxies. Our findings support models that show that gravitational lensing from clusters is of the most value for detecting galaxies at magnitudes brighter than L∗ () where the LF is expected to be very steep. Use of these clusters to constrain the faint-end slope or determine the full LF is likely of less value due to the shallower effective slope measured for the LF at fainter magnitudes, as well as significant uncertainties introduced from modelling both the gravitational lensing and incompleteness.
Subject headings:
galaxies: evolution — galaxies: high-redshift1. Introduction
Because of the great distances and extreme faintness of galaxies at , as well as the high sky backgrounds, detection of galaxies at such high redshifts remains extremely challenging. It is not surprising that the number of robust 7 candidates is still very small (see, e.g., Bouwens & Illingworth 2006; Bouwens et al. 2008; Oesch et al. 2008). Gravitational lensing by galaxy clusters has been highlighted as an efficient way of improving this situation, due to the significant areas on the sky behind these clusters with sizeable magnification factors to amplify light from faint sources. However, this advantage is offset by the greatly reduced source plane volume in the highly magnified regions.
Because of the trade-off between depth and area, the utility of clusters for these searches depends strongly on the slope of the luminosity function (e.g., Broadhurst et al. 1995). If the effective slope of the LF () is greater than 1, the gain in depth more than compensates for the loss in area, increasing the overall number of sources (e.g., Broadhurst et al. 1995) over that found in the field. Such steep slopes are found at magnitudes brightward of (corresponding to H27 AB mag for galaxies). By contrast, at fainter magnitudes (H27 for galaxies) the effective slope of the LF is not quite so steep (e.g., the faint-end slope for the Bouwens et al. 2007 LF corresponds to ). This trade-off between depth and area is such that the surface density of dropouts is lower behind clusters than in the field at faint magnitudes. Overall these considerations suggest that the most significant advantages will be achieved at bright magnitudes (L∗) where the LF is very steep. Shallow searches over many clusters, in particular, would seem to be the most rewarding.
| Area | 5 Depthaa limits assume a -diameter aperture for ACS/WFPC2 and -diameter aperture for NICMOS. | NICMOS | |||||
|---|---|---|---|---|---|---|---|
| Name | (arcmin2) | OpticalbbThe depth of the deepest single-band optical () image available over the cluster. Note that some of the clusters listed here have very deep data in bands (particularly MS1358, CL0024, Abell 2218, Abell 1689, Abell 1703), so the effective depth of the combined optical data is often 0.4 mag deeper than tabulated here. | orbits | RefccReferences: [1] Richard et al. 2008, [2] Bradley et al. 2008. | |||
| MS1358 | 1.4 | 28.0 | 27.5 | 26.8 | 26.7 | 18 | [1] |
| CL0024 | 1.4 | 27.8 | 27.4 | 26.8 | 26.7 | 18 | [1] |
| Abell 2218 | 1.2 | 27.9 | 27.6 | 26.8 | 26.7 | 17 | [1] |
| Abell 2219 | 1.4 | 27.5 | 27.2 | 26.8 | 26.7 | 18 | [1] |
| Abell 2390 | 1.5 | 26.6ddThe optical data available over these four clusters are from WFPC2 and are only moderately deep. As a result, we might expect a small number of low redshift interlopers to make it into selections (§4) conducted over each of these clusters. Not surprisingly, a substantial fraction of the weaker candidates in our own selection, and that of Richard et al. (2008) are found over these four clusters. | 26.9 | 26.8 | 26.7 | 18 | [1] |
| Abell 2667 | 1.5 | 26.5ddThe optical data available over these four clusters are from WFPC2 and are only moderately deep. As a result, we might expect a small number of low redshift interlopers to make it into selections (§4) conducted over each of these clusters. Not surprisingly, a substantial fraction of the weaker candidates in our own selection, and that of Richard et al. (2008) are found over these four clusters. | 26.9 | 26.8 | 26.7 | 18 | [1] |
| Abell 1689 | 5.7 | 28.1 | 26.8 | 26.4 | — | 19 | [2] |
| Abell 1703 | 3.1 | 27.9 | 26.7 | 26.0 | — | 6 | — |
| 1E0657-56eeThe “Bullet” cluster | 2.7 | 27.6 | 27.2 | 26.0 | — | 4 | — |
| Abell 1835 | 0.7 | 27.1ddThe optical data available over these four clusters are from WFPC2 and are only moderately deep. As a result, we might expect a small number of low redshift interlopers to make it into selections (§4) conducted over each of these clusters. Not surprisingly, a substantial fraction of the weaker candidates in our own selection, and that of Richard et al. (2008) are found over these four clusters. | 27.2 | — | 26.7 | 4 | — |
| AC114 | 0.7 | 27.1ddThe optical data available over these four clusters are from WFPC2 and are only moderately deep. As a result, we might expect a small number of low redshift interlopers to make it into selections (§4) conducted over each of these clusters. Not surprisingly, a substantial fraction of the weaker candidates in our own selection, and that of Richard et al. (2008) are found over these four clusters. | 27.2 | — | 26.7 | 4 | — |
| Total | 21.3 | 144 | |||||
Here we assess the promise of clusters for studying galaxies by conducting a careful search for high redshift galaxies in all the currently available HST NICMOS imaging data over 11 massive low-redshift galaxy clusters. Bradley et al. (2008) have already conducted such a search around Abell 1689 and reported one highly robust galaxy. Richard et al. (2006) examined 2 clusters and reported 13 candidates, while Richard et al. (2008) have examined 6 clusters and reported 12 candidates. The present paper represents an independent assessment of the prevalence of these sources behind massive low-redshift clusters. We take advantage of 21 arcmin2 of very deep NICMOS data behind 11 lensing clusters with optical ACS+WFPC2 coverage, 7 of which were already considered in the Bradley et al. (2008) and Richard et al. (2008) papers. For our search, we will utilize many of the same photometric techniques we have employed over the past few years to identify large samples of 4-8 dropouts in the field (Bouwens et al. 2006; Bouwens et al. 2007; Bouwens et al. 2004; Bouwens et al. 2008).
We begin this paper with a summary of the observational data available to search for galaxies behind galaxy clusters (§2). In §3, we describe our techniques for constructing source catalogs and doing the photometry (§3). In §4, we summarize the results of our selection and discuss sources of contamination. In §5, we compare our results with (1) what we would expect based upon the LF derived in the field and (2) the search results from other teams. We then conclude by discussing the implications of this study (§6). In the Appendix, we provide an assessment of the candidates reported by Richard et al. (2008). In particular, we assess the merits of searching for galaxies behind clusters versus searching for these galaxies in the field (§6). We assume , , throughout. Although these parameters are slightly different from those determined from the WMAP five-year results (Dunkley et al. 2008), they allow for convenient comparison with other recent results expressed in a similar manner. The HST filters F555W, F606W, F625W, F702W, F775W, F814W, F850LP, F110W, and F160W will be denoted as , , , , , , , , and , respectively. We will express all magnitudes in the AB system (Oke & Gunn 1983).
2. Observational Data
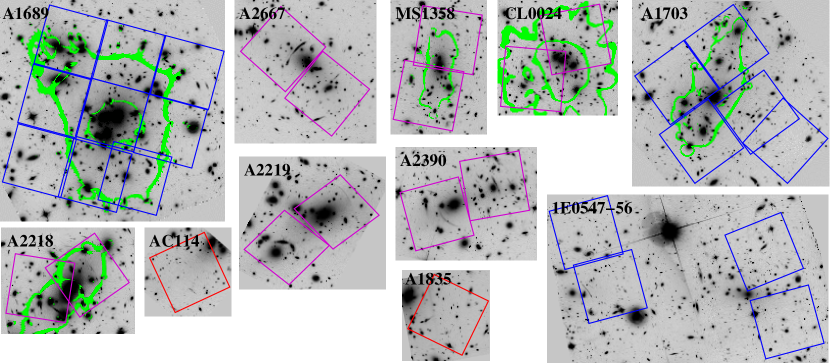
We conduct searches for dropout galaxies over the 11 low-redshift galaxy clusters with deep near-IR NICMOS and optical ACS coverage (Table 1). The near-IR data here were taken with the goal of finding galaxies. The NICMOS coverage of the first six clusters considered here (CL0024, MS1358, Abell 2218, Abell 2219, Abell 2390, Abell 2667) extends over arcmin2 (12 NIC3 pointings) and includes very deep imaging in both the and bands (Richard et al. 2008). The NICMOS coverage of three other clusters considered here (i.e., Abell 1689, Abell 1703, and 1E0657-56) is somewhat shallower in general, extends over 10 arcmin2 (17 NIC3 pointings), and is mainly in the band. The final two clusters considered here (Abell 1835 and AC114) only have deep near-IR NICMOS data in the band and over one 0.8 arcmin2 NIC3 pointing per cluster. The layout of our NICMOS search fields is illustrated graphically in Figure 1.
Deep optical imaging data are necessary for the selection of galaxies and can be a significant limitation, if not available. MS1358, CL0024, Abell 1689, Abell 1703, and Abell 2218 all possess useful optical data, with orbits in each of the ACS , , and bands and orbits in the ACS band. The optical coverage of Abell 2219, Abell 2390, Abell 2667, 1E0657-56, Abell 1835, and AC114 is generally shallower in depth and primarily with WFPC2, though 4 orbits of ACS -band coverage are available for each.
All the available ACS and NICMOS data over these clusters are processed into image mosaics using the ACS GTO pipeline “apsis” (Blakeslee et al. 2003) and NICMOS pipeline “nicred.py” (Magee et al. 2007). Reductions of the WFPC2 data are obtained from the Canadian Astronomy Data Centre. All reductions are registered onto the same frame as the NICMOS data.
3. Sample Construction
(a) Catalog Generation: Our procedure for generating source catalogs and doing photometry is identical to that performed in Bouwens et al. (2008). Briefly, we run SExtractor (Bertin & Arnouts 1996) in double-image mode to do object detection and photometry. For the detection image, we use the square root of the image (Szalay et al. 1999), which we construct from the NICMOS and images for our dropout selection and the NICMOS band image for our dropout selection. Our photometry is then conducted on our ACS, WFPC2, and NICMOS images, which are point-spread function matched to the NICMOS image. Colors are measured in small-scalable (Kron 1980) apertures, assuming a Kron (1980) factor of 1.2. These fluxes are then corrected to total magnitudes using the light within a larger Kron (1980) aperture (adopting a Kron factor of 2.5). These latter corrections are made using the square root of the image to improve the S/N. Figure 5 of Coe et al. (2006) provides a graphical description of a similar multi-stage procedure for measuring colors and total magnitudes. Typical aperture diameters are 0.3′′ and 0.6′′ for color and total magnitude measurements, respectively.
(b) Selection Criteria: We use the same selection criteria for identifying star-forming galaxies at that we used in our previous work on the identification of such galaxies in field data sets like GOODS or the HUDF (e.g., Bouwens et al. 2008). Specifically, we require a -dropout candidate to satisfy the criterion where represents the logical AND symbol. -dropout candidates are expected to satisfy the criterion . In cases of a non-detection in the dropout band, we set the flux in the dropout band to be equal to the upper limit. We require each candidate to be completely undetected () in all passbands blueward of the dropout band. We also demand that each candidate be detected at in the band in a -diameter aperture to eliminate spurious sources.
Our selection criteria are modified slightly for clusters that do not have NICMOS imaging in both the and bands. For clusters with only band imaging, we apply a criterion to select 7 -dropouts and for clusters with only band imaging, we apply a criterion to identify possible star-forming galaxies at . Both criteria should be successful in identifying candidate galaxies (albeit with a higher contamination level than selections relying on both and data).
| Object ID | R.A. | Dec | aaThis colour corresponds to for Abell 1689, for Abell 2390, and for Abell 2667. | bbThis colour corresponds to for Abell 1689 and for Abell 2390 and Abell 2667. | |||
|---|---|---|---|---|---|---|---|
| -dropouts | |||||||
| A1689-zD1ccA1689-zD1 is our most robust candidate and was previously presented in Bradley et al. (2008). | 13:11:29.73 | 01:19:20.9 | 2.5ddLower limits on the measured colors are limits. | 2.5ddLower limits on the measured colors are limits. | 2.2ddLower limits on the measured colors are limits. | 0.60.2 | 24.60.1 |
| A2390-zD1eeNo deep optical data are available for the four candidates: A2390-zD1, A2667-zD1, A2667-zD2, and A2390-JD1 (see Table 1). We consider all four to be relatively weak -dropout candidates. | 21:53:34.09 | 17:41:41.1 | 1.7ddLower limits on the measured colors are limits. | 1.5ddLower limits on the measured colors are limits. | 1.10.8 | 0.80.2 | 25.2 |
| A2667-zD1eeNo deep optical data are available for the four candidates: A2390-zD1, A2667-zD1, A2667-zD2, and A2390-JD1 (see Table 1). We consider all four to be relatively weak -dropout candidates. | 23:51:40.06 | 26:05:13.8 | 0.9ddLower limits on the measured colors are limits. | 0.4ddLower limits on the measured colors are limits. | 1.2ddLower limits on the measured colors are limits. | 0.00.3 | 26.10.2 |
| A2667-zD2eeNo deep optical data are available for the four candidates: A2390-zD1, A2667-zD1, A2667-zD2, and A2390-JD1 (see Table 1). We consider all four to be relatively weak -dropout candidates. | 23:51:36.85 | 26:05:21.4 | — | — | 0.90.4 | 0.00.3 | 25.60.2 |
| -dropouts | |||||||
| A2390-JD1e,ge,gfootnotemark: | 21:53:34.12 | 17:41:44.2 | 1.2d,fd,ffootnotemark: | 1.1d,fd,ffootnotemark: | 1.3d,fd,ffootnotemark: | 1.9 | 26.00.2ggWhile this source is formally a detection in our reductions (and using our photometric procedures), there is some chance it may still be spurious. |
4. Results
After careful application of our selection criteria to all 11 clusters under study here, we identify 4 -dropout candidates and 1 -dropout candidate. We also uncover a small number of candidates that appeared to be promising candidates (e.g., the candidates at 00:26:37.90, 17:09:10.4 or 00:26:35.11, 17:10:10.3 behind CL0024), but which show modest (2) detections in passbands blueward of and therefore were excluded.
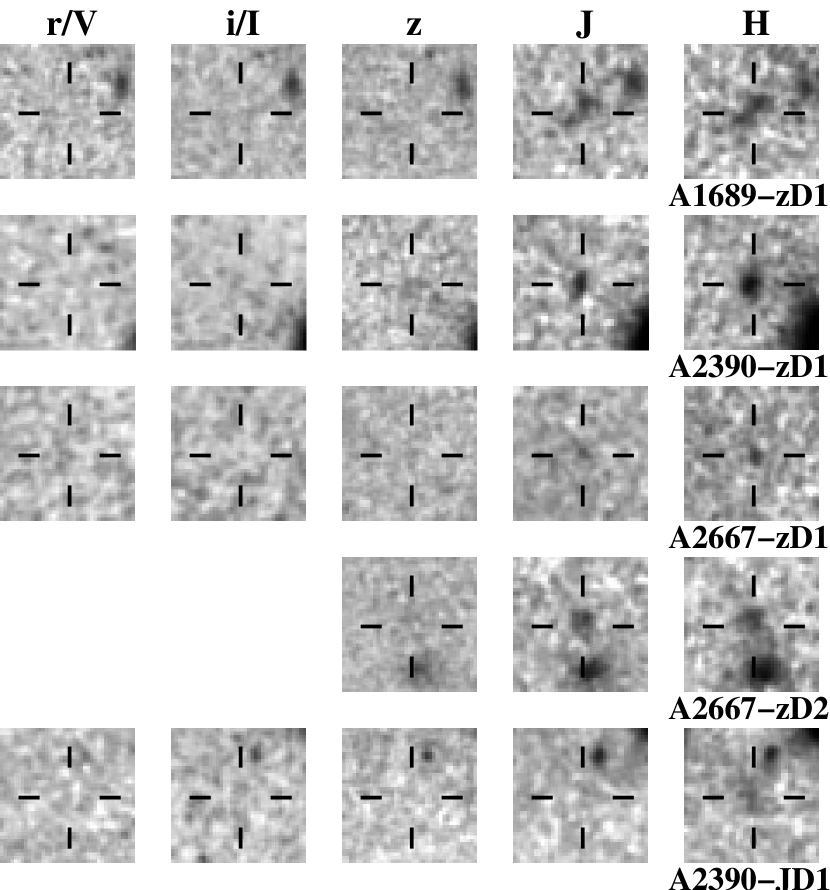
Postage stamps of the four candidate star-forming galaxies at are provided in Figure 2. Other properties are given in Table 2. Our candidate in Abell 1689 has already been reported upon before by Bradley et al. (2008) and is by far the strongest candidate. The SED derived from the very deep optical, NICMOS, and IRAC data can only be successfully fit by the SED of a star-forming galaxy at (Bradley et al. 2008).
Possible Contamination of our Selection by Lower-Redshift Galaxies: The four new sources in our selection are much less robust candidates. All are in clusters for which the optical data is much shallower. The , , or WFPC2 coverage over Abell 2390 and Abell 2667 reaches to only and (, 0.3”-diameter aperture) over Abell 2390 and 2667, respectively. These WFPC2 data are mag shallower than the ACS data available over 5 other clusters studied here (Table 1). This will result in a much higher contamination rate from low-redshift galaxies scattering into our color selection due to noise.
To estimate the expected contamination level, we start with a selection of intermediate magnitude galaxies in the HUDF NICMOS field (Thompson et al. 2005) and add noise to the fluxes to match the errors for sources in our search fields. On average, we find low-redshift contaminant over Abell 2390 and such sources over Abell 2667 in these simulations. This is comparable to the observed numbers and suggests that A2390-zD1, A2667-zD1, A2667-zD2, and A2390-JD1 may be low-redshift interlopers. As an alternate estimate of the contamination level, we start with the catalog of sources in the three clusters with the deepest ACS and NICMOS data (Abell 2218, MS1358, CL0024) and add noise (again to match the flux errors for sources behind Abell 2390 and Abell 2667). On average, we predict low-redshift contaminants over Abell 2390 and low-redshift contaminations over Abell 2667. Again these numbers are comparable to the observed number of candidates over these clusters and suggest that all four candidates behind these clusters may be interlopers. The modest differences in the predicted number of contaminants for the two methods is consistent with what one would expect from small number statistics.
Surface Density of Robust Candidates Behind Massive Galaxy Clusters: We tabulate the surface density of robust candidates found behind clusters as a function of magnitudes in Table 3. Also included in this table are the surface densities found in the field (Bouwens et al. 2008; R.J. Bouwens et al. 2008). The surface density of candidates behind clusters appears to be substantially larger than in the field at bright magnitudes (i.e., or 5L∗). This is exactly what we expect as a result of the slope of the LF at bright magnitudes. Interestingly, current observations do not provide any evidence for an enhancement in the surface density of sources between and . This is despite the expected steep slope of the LF at such magnitudes. This could reflect the small numbers of sources involved here and point to the need for imaging more clusters to improve the overall statistics (see also §6 and R.J. Bouwens et al. 2008, in prep).
At AB mag we are probing faintward of and likely reaching the regime where the effective slope of the LF is only moderately steep (i.e., : Bouwens et al. 2007). For such slopes, the trade-off between depth and area is such that the surface density of dropouts behind clusters will be lower than observed in the field.
5. Discussion
5.1. Comparison with Model Expectations
We can compare the number of galaxy candidates found in our search with that expected based on determinations of the luminosity function (LF) at from the field (Bouwens et al. 2008). For this calculation, we need lensing models for the clusters under study. We have such lensing models for 5 of the search clusters under study here, namely Abell 1689, Abell 1703, Abell 2218, CL0024, MS1358. These models are described in Limousin et al. (2007), Limousin et al. (2008), Elíasdóttir et al. (2007), Jee et al. (2007), and Franx et al. (1997), respectively. We will scale our expectations from those clusters to our entire sample.
Predicted Number of Candidates: Starting with the Bouwens et al. (2008) model for the sizes, colors, and LF for galaxies at (Appendix B from that work), we generate very high-resolution mock images (pixel size ) of galaxies in a source plane and then remap these images to the image plane using available lensing models for these clusters. We then add these simulated fields to the real data and attempt to recover these sources using our cataloguing and selection procedures (§3). Generating these mock fields 20 times for each cluster and using our selection procedure to identify and dropouts, we estimate that we would expect to find 2.7 dropouts over all of our search fields. If we repeat this procedure for -dropouts assuming an extrapolation of the Bouwens et al. (2008) LF results to , 0.3 dropouts are expected. We find only modest variations in the number of dropouts expected behind clusters with similar depths and survey areas (e.g., 0.2 predicted behind Abell 2218 vs. 0.3 predicted behind MS1358). Similarly, use of slightly different lensing models for the clusters only appears to have a modest effect on the numbers (e.g., use of an updated version of the Broadhurst et al. 2005 model only increases the predicted numbers behind Abell 1689 by 20% over that predicted by the Limousin et al. 2007 model).
Comparisons against the Number of Observed Candidates: The above predictions are quite consistent with the 1 robust -dropout candidate, 3 other possible -dropout candidates, and 1 possible -dropout candidate discussed in §4, particularly given the small numbers and uncertain contamination levels. Because of the difficulty in interpreting the search results over the clusters with the shallower optical data (given the likely significant contamination levels), it also makes sense to restrict our comparison to only those clusters with the deepest data (i.e., excluding Abell 1835, Abell 2390, Abell 2667, and AC114 from this comparison). Using only clusters with the deepest optical data, we predict 2.0 -dropouts and 0.2 -dropouts in total. Again this is in reasonable agreement with the 1 robust -dropout we find over this more restricted search area, given the small number statistics. For both this comparison and the previous one, our search results are clearly consistent with our predictions and therefore with the Bouwens et al. (2008) LF derived in the field. From this exercise, it is also quite clear that galaxy searches (using a small number of clusters) provide only a very weak constraint on the volume density of lower luminosity galaxies. For our search the uncertainty in the volume density of these sources is dex [factor of four] based on our sample size of one.
| Surface | Search Area | ||
|---|---|---|---|
| Magnitude | Density | per candidate | |
| Location | RangeaaWithout any magnification from gravitational lensing and adopting the Bouwens et al. (2008) determination for at , corresponds to luminosities , corresponds to luminosities and , and corresponds to luminosities and . | (arcmin-2) | (arcmin2)bbThis column is the reciprocal of the previous column. |
| Cluster | ccBased on the NICMOS data over all 11 galaxy cluster fields considered in this paper | 21 | |
| Cluster | 0.11ddBased on the NICMOS data over Abell 1835, Abell 2218, Abell 2219, Abell 2390, Abell 2667, MS1358, CL0024, and AC114 | 9 | |
| Cluster | —eeNear-IR data over cluster fields are not deep enough to probe this regime well. Nonetheless, we expect the surface density of dropouts behind clusters to be lower than observed in the field, since at AB mag we are probing faintward of and likely reaching the regime where the effective slope of the LF is only moderately steep (i.e., : Bouwens et al. 2007). For such a slope, the trade-off between depth and area is such that the surface density of dropouts is lower behind clusters. | — | |
| Field | 0.03ffThe colours tabulated here are relative to the -band, not the -band, and hence are , , and . | 36 | |
| Field | ffBased on the Bouwens et al. (2008) and R.J. Bouwens et al. (2008, in prep) search results for dropouts in the field. The R.J. Bouwens et al. (2008, in prep) search takes advantage of more than 20 arcmin2 additional search area with NICMOS not considered by Bouwens et al. (2008). | 13 | |
| Field | ggBased on data from the HUDF Thompson field (Thompson et al. 2005), HUDF-NICPAR1, and HUDF-NICPAR2 fields (Bouwens et al. 2008) | 2 |
5.2. Comparison with Previous Results
Richard et al. (2006) reported finding 13 candidates (1st+2nd category) in 12 arcmin2 of ISAAC data behind 2 lensing clusters, while Richard et al. (2008) reported 12 other candidates in 9 arcmin2 of NICMOS data behind six other clusters.
The Richard et al. (2006) search results are significantly different from our results (13 candidates to over 12 arcmin2 vs. the one robust candidate we find over 21 arcmin2). As we discuss in detail in Appendix C of Bouwens et al. (2008), % of their candidates appear to be spurious, since none of the eleven candidates in their selection with substantially deeper (1-2 mag) NICMOS+IRAC coverage are significantly (2) detected.
The prevalence of 7 galaxies implied by the Richard et al. (2008) search results is also much greater than what we find in our searches. Since these candidates are reported over a subset of the clusters used in the current search, the differences are puzzling. To understand the possible differences, we examined the Richard et al. (2008) sources in our own reductions of the same HST data using our photometric procedures. We find that 2 of their 12 candidates appear to be plausible galaxies given our photometry. The other sources are likely contaminants (a detailed discussion of all 12 Richard et al. 2008 candidates can be found in Appendix A). The two good candidates also satisfy our -dropout selection criteria (but are blended with foreground galaxies in our search). One of these two candidates does not have particularly deep optical coverage, so there is a reasonable chance that it is at lower redshift.
A comparison of our sample with the Richard et al. (2008) sample suggests that our selection may suffer from some incompleteness. The observed level of incompleteness is not surprising and is consistent with what we expect from blending with foreground sources (35%). Moreover, since this same incompleteness is implicitly included in the predictions we make in §5.1 to compare with the observations, the conclusions that we draw based upon those comparisons should be fair.111Even if we include the two best candidates from the Richard et al. (2008) selection in our sample, the total number of strong candidates is still very consistent with the predictions we make in §5.1 from the Bouwens et al. (2008) field LFs. Moreover, for the clusters with the deepest optical data (i.e., excluding AC114, Abell 1835, Abell 2390 and Abell 2667), only 2.2 candidates are predicted (§5.1) which is quite consistent with the 2 found (i.e., A1689-zD1 and A2219-z1).
| NICMOS | Candidates | Orbits per | ||
|---|---|---|---|---|
| Location | #aaNumber of strong candidates | Orbits | per Orbit | CandidatebbReciprocal of the previous column |
| Cluster (ShallowccSearch results for shallow near-IR data with depths less than 27 AB mag (i.e., orbits). 27 AB mag corresponds to at (Bouwens et al. 2008).)eeAll 11 clusters considered here. | 1 | 144 | 0.007 | 144 |
| Cluster (DeepddSearch results for deep near-IR data, with depths greater than 27 AB mag (i.e., orbits). 27 AB mag corresponds to at (Bouwens et al. 2008).)ffNo very deep (i.e., reaching 27 AB mag at ) near-IR data are available over clusters, but it is expected that the search efficiency will decrease significantly at fainter magnitudes since we will be probing faintward of where the faint-end slope is likely only moderately steep (§6). | 0 | — | — | — |
| Field (ShallowccSearch results for shallow near-IR data with depths less than 27 AB mag (i.e., orbits). 27 AB mag corresponds to at (Bouwens et al. 2008).)ggBased upon the NICMOS data considered in the Bouwens et al. (2008) and R.J. Bouwens et al. (2008, in prep) searches | 3 | 450 | 0.007 | 150 |
| Field (DeepddSearch results for deep near-IR data, with depths greater than 27 AB mag (i.e., orbits). 27 AB mag corresponds to at (Bouwens et al. 2008).)ggBased upon the NICMOS data considered in the Bouwens et al. (2008) and R.J. Bouwens et al. (2008, in prep) searches | 6 | 600 | 0.010 | 100 |
| Field (BothhhSearch results for both shallow and deep near-IR data.) | 9 | 1050 | 117 |
6. Implications
The purpose of the present study is to increase the sample of candidate 7 galaxies and to assess the potential of gravitational lensing by galaxy clusters to identify and quantify the properties of galaxies at . Lensing will increase the depth of the survey by the magnification factors, but decrease the search area by the same factor. If the effective slope of the LF () is greater than 1, the gain in depth more than compensates for the loss in area, increasing the overall number of sources (e.g., Broadhurst et al. 1995). We would expect this effect to increase the numbers at bright magnitudes where the effective slope of the LF is very steep due to an apparent cut-off at the bright end (i.e., ), but to decrease the numbers at fainter magnitudes () where the faint-end slope is shallower than this (i.e., 1: e.g., Bouwens et al. 2007).
Our simulations (§5.1) show the expected gains at the bright end of the LF for searches behind clusters (see Table 4). We expect three galaxies over the present set of cluster data (144 NICMOS orbits) using the observed LF of Bouwens et al. (2008). The 48 NICMOS orbits/galaxy in the clusters for bright sources contrasts with the 120 NICMOS orbits/galaxy needed in the field (nine galaxies are found in 1050 orbits of NICMOS data over the GOODS fields: R.J. Bouwens et al. 2008, in prep). Nearly identical search procedures and selection criteria are used in both the cluster and field searches. Interestingly, the expected gains at bright magnitudes in clusters are not reflected in the observational results above, if we only include our most robust candidate (for 144 NICMOS orbits/galaxy). This could easily arise because of small number statistics. Any gains in using clusters are likely to disappear at lower luminosities faintward of the LF knee, since the slope is not steep enough, as noted above.
Of course, lensing clusters can be used to potentially detect objects much fainter than in a field sample, thereby possibly extending the LF function to fainter limits. Unfortunately, both small number statistics and the challenges of modelling clusters make this very difficult, and likely not to be a very practical approach. This is because a substantial sample of objects is needed to faint limits to accurately determine the LF, as well as extremely accurate models of both lensing by the foreground cluster and incompleteness suffered by the lensed high-redshift population. Determining either of these latter two quantities well (and without any systematics) is a great challenge. As a result, it can be difficult to even measure quantities like the faint-end slope of the UV LF at 4, 5, and 6 from current samples of , , and dropouts behind lensing clusters (where the samples are much larger: see R.J. Bouwens et al. 2008, in prep).
Our findings also underline the importance of having very deep optical data below the Lyman break for identifying high-z dropout galaxies. Without such data, it is essentially impossible to distinguish bona-fide galaxies from the large number of low-redshift galaxy interlopers that may scatter into samples as a result of noise – as we found for the four weaker dropout candidates in our selection (§4). Unfortunately, obtaining sufficiently deep optical data can be expensive and often requires as much time as is spent obtaining the near-IR data.
References
- Bartelmann et al. (1995) Bartelmann, M., Steinmetz, M., & Weiss, A. 1995, A&A, 297, 1
- Bertin and Arnouts (1996) Bertin, E. and Arnouts, S. 1996, A&AS, 117, 39
- Blakeslee et al. (2003) Blakeslee, J. P., Anderson, K. R., Meurer, G. R., Benítez, N., & Magee, D. 2003a, ASP Conf. Ser. 295: Astronomical Data Analysis Software and Systems XII, 12, 257
- Bouwens et al. (2004) Bouwens, R. J., et al. 2004, ApJ, 616, L79
- Bouwens & Illingworth (2006) Bouwens, R. J., & Illingworth, G. D. 2006, Nature, 443, 189
- Bouwens et al. (2006) Bouwens, R.J., Illingworth, G.D., Blakeslee, J.P., & Franx, M. 2006, ApJ, 653, 53
- Bouwens et al. (2007) Bouwens, R. J., Illingworth, G. D., Franx, M., & Ford, H. 2007, ApJ, 670, 928
- (8) Bouwens, R.J., Illingworth, G.D., Franx, M., Ford, H. 2008, ApJ, in press, arXiv:0803.0548
- (9) Bradley, L.D., et al. 2008, ApJ, 678, 647
- Broadhurst et al. (1995) Broadhurst, T. J., Taylor, A. N., & Peacock, J. A. 1995, ApJ, 438, 49
- Broadhurst et al. (2005) Broadhurst, T., et al. 2005, ApJ, 621, 53
- Coe et al. (2006) Coe, D., Benítez, N., Sánchez, S. F., Jee, M., Bouwens, R., & Ford, H. 2006, AJ, 132, 926
- Dunkley et al. (2008) Dunkley, J., et al. 2008, ApJS, submitted, arXiv:0803.0586
- Elíasdóttir et al. (2007) Elíasdóttir, Á., et al. 2007, arXiv:0710.5636
- Franx et al. (1997) Franx, M., Illingworth, G. D., Kelson, D. D., van Dokkum, P. G., & Tran, K.-V. 1997, ApJ, 486, L75
- Jee et al. (2007) Jee, M. J., et al. 2007, ApJ, 661, 728
- Kron (1980) Kron, R. G. 1980, ApJS, 43, 305
- Lehnert & Bremer (2003) Lehnert, M. D. & Bremer, M. 2003, ApJ, 593, 630
- Limousin et al. (2007) Limousin, M., et al. 2007, ApJ, 668, 643
- Limousin et al. (2008) Limousin, M., et al. 2008, arXiv:0802.4292
- Magee et al. (2007) Magee, D. K., Bouwens, R. J., & Illingworth, G. D. 2007, Astronomical Data Analysis Software and Systems XVI, 376, 261
- Meneghetti et al. (2007) Meneghetti, M., Bartelmann, M., Jenkins, A., & Frenk, C. 2007, MNRAS, 381, 17
- Oesch et al. (2008) Oesch, P. A., et al. 2008, ApJ, submitted, arXiv:0804.4874
- Oke & Gunn (1983) Oke, J. B., & Gunn, J. E. 1983, ApJ, 266, 713
- Richard et al. (2006) Richard, J., Pelló, R., Schaerer, D., Le Borgne, J.-F., & Kneib, J.-P. 2006, A&A, 456, 861
- Richard et al. (2008) Richard, J., Stark, D. P., Ellis, R. S., George, M. R., Egami, E., Kneib, J.-P., & Smith, G. P. 2008, ApJ, submitted, arXiv:0803.4391
- Stanway et al. (2005) Stanway, E. R., McMahon, R. G., & Bunker, A. J. 2005, MNRAS, 359, 1184
- Szalay et al. (1999) Szalay, A. S., Connolly, A. J., & Szokoly, G. P. 1999, AJ, 117, 68
- Thompson et al. (2005) Thompson, R. I., et al. 2005, AJ, 130, 1
Appendix A A. Independent Assessment of the 7 candidates in Richard et al. (2008)
Richard et al. (2008) also conducted a search for 7 galaxy candidates behind 6 of the 11 galaxy clusters considered in this study (i.e., CL0024, CL1358, Abell 2218, Abell 2219, Abell 2390, Abell 2667). They reported finding 10 promising -dropout candidates and 2 promising -dropout candidates. Surprisingly, none of the 12 candidates in the Richard et al. (2008) sample make it into our own 7 dropout selections (§4) – nor do our candidates appear in their selection – even though our color selection criteria are essentially identical (and their search data a subset of ours).
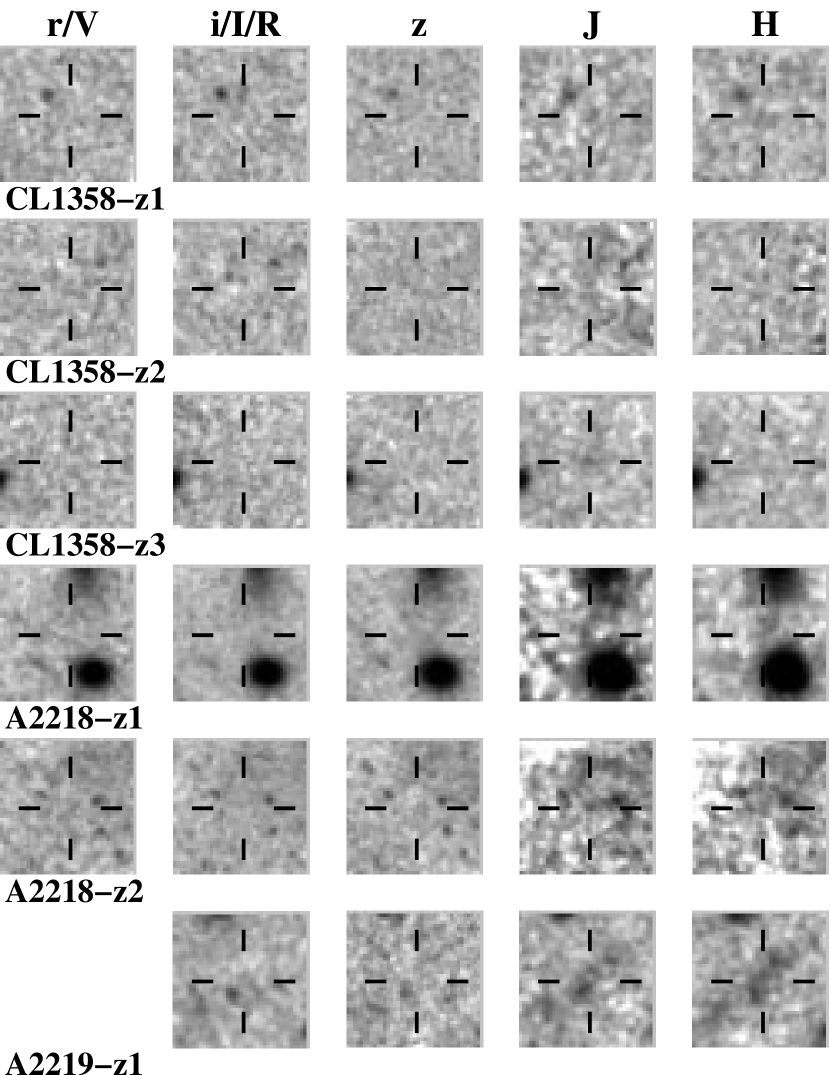
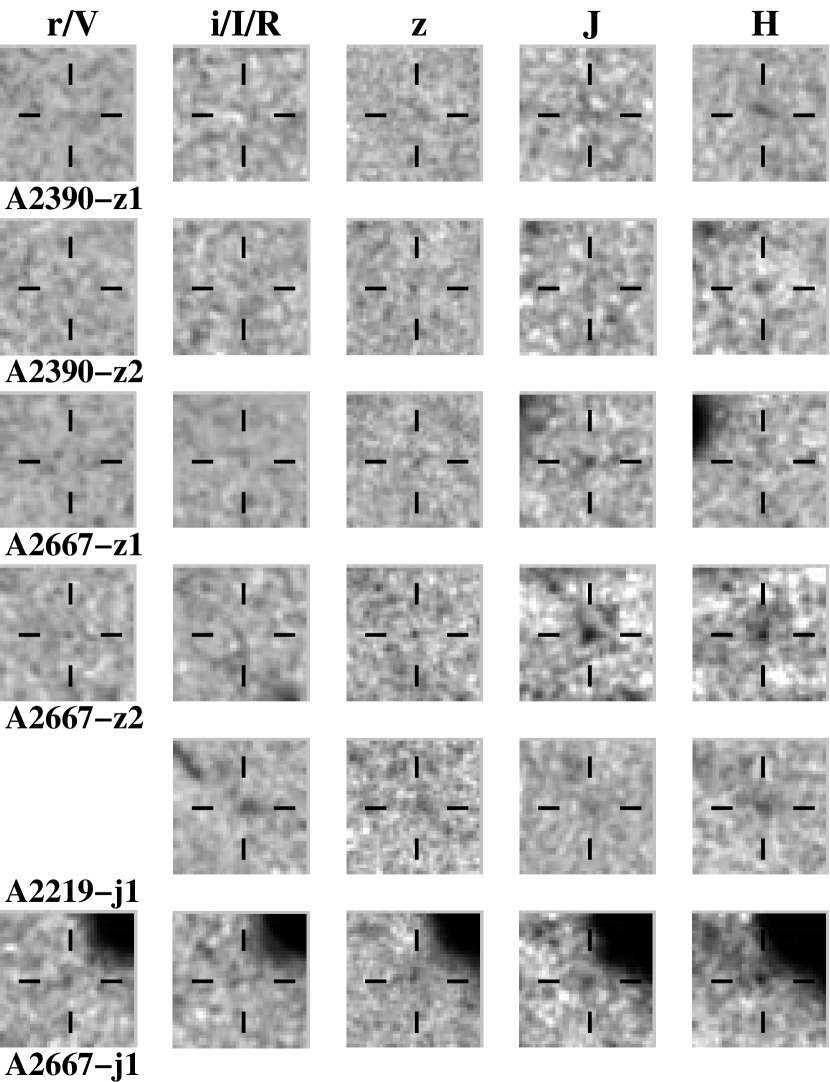
To understand the reason for these differences, we performed photometry on the sources using the same -diameter (for ACS+WFPC2) and -diameter (for NICMOS) apertures employed by Richard et al. (2008) for their photometry. We then corrected the magnitudes we measured from the ACS+WFPC2 or NICMOS data by 0.3 mag and 0.6 mag, respectively (again following the methodology of Richard et al. 2008). For the four Richard et al. (2008) candidates where light from the central cluster galaxy would contaminate the photometry (i.e., A2218-z2, A2390-z2, A2667-z2, A2667-j1), we explicitly fit the isophotes to the central galaxy and subtracted them off. A summary of our photometry of the 12 Richard et al. (2008) candidates is presented in Table 5. We present images of the 12 7 candidates from the Richard et al. (2008) selection in Figure 3.
Of the 12 candidates, two (i.e., A2219-z1 and A2667-z2) seem like plausible galaxies (A2219-z1 being the stronger of the two). Both candidates satisfy our selection criteria (but were blended with foreground galaxies in our catalogs and therefore not included in our candidate lists). The other ten candidates appear unlikely to correspond to high-redshift sources, given our photometry (although in the case of A2667-z1 it is difficult to rule out the source being at ). Ascertaining the precise redshift of A2667-z2 is difficult given the limited depth of the optical data around Abell 2667. Without deeper optical data, it is essentially impossible to know which candidates correspond to high-redshift galaxies and which are lower redshift contaminants. Note that we encountered similar difficulties in ascertaining the nature of the 4 weaker 7 candidates found in our selection behind Abell 2390 and Abell 2667 (neither of which has particularly deep optical coverage). Our simulations and tests (§4) suggested that substantial contamination by low redshift galaxies is quite likely.
In addition to the above comments about specific candidates in the Richard et al. (2008) selection, we also have several general concerns about the properties of this -dropout selection. Our first concern regards the color distribution of this selection. The colors are mag bluer on average than what we find in the field for our -dropout sample (Bouwens et al. 2008: Figure A1). They are also mag bluer than what one would expect for a young star-forming galaxy population (as observed at : e.g., Lehnert & Bremer 2003; Stanway et al. 2005; Bouwens et al. 2006). It is hard to understand why -dropouts from the Richard et al. (2008) selection would be so much bluer than these expectations unless the candidates had strong Ly emission in the band. However, such an explanation would appear to be ruled out by the follow-up spectroscopy that Richard et al. (2008) conduct that find no such emission for the 7 -dropout candidates they observe.
Second, we find it worrisome that almost all (8 out of 10) of their -dropout candidates only satisfy their color criterion by a small margin ( mag) whereas in the Bouwens et al. (2008) field sample, almost half of the -dropouts satisfy the color criterion by a wide margin (i.e., mag). One would expect the situation to be quite opposite here, as a result of the much flatter number counts expected behind galaxy clusters (the number of bright sources in cluster fields would increase due to magnification by the cluster and the number of faint sources would decrease because of the loss of area). This should result in a larger fraction of sources satisfying the selection criterion by a wide margin, not a smaller fraction.
| 0.6′′-diameter apertureaaFollowing the Richard et al. (2008) procedure, we have corrected the magnitudes we measure in a -diameter and -diameter aperture by 0.3 mag and 0.6 mag, respectively, for the WFPC2+ACS and NICMOS data (see Appendix A). | |||||
|---|---|---|---|---|---|
| Object ID | bbThis colour corresponds to for CL1358 and Abell 2218, for Abell 2390, and for Abell 2667. | ccThis colour corresponds to for CL1358 and Abell 2218, for Abell 2219, and for Abell 2390 and Abell 2667. | |||
| -dropouts | |||||
| CL1358-z1ddThese sources are not detected at high significance (i.e., ) in either the or bands in our NICMOS reductions. One possible reason that our calculated significance levels may be different from Richard et al. (2008) is that we account for sensitivity variations across the NIC3 detector in our weight maps (the sensitivities vary by factors of 2 from region to region). | 1.9 | 1.7 | 0.8 | 27.60.7 | 27.80.7 |
| CL1358-z2ddThese sources are not detected at high significance (i.e., ) in either the or bands in our NICMOS reductions. One possible reason that our calculated significance levels may be different from Richard et al. (2008) is that we account for sensitivity variations across the NIC3 detector in our weight maps (the sensitivities vary by factors of 2 from region to region). | — | — | — | 28.0 | 28.1 |
| CL1358-z3ddThese sources are not detected at high significance (i.e., ) in either the or bands in our NICMOS reductions. One possible reason that our calculated significance levels may be different from Richard et al. (2008) is that we account for sensitivity variations across the NIC3 detector in our weight maps (the sensitivities vary by factors of 2 from region to region). | 2.2 | 2.0 | 1.2 | 27.20.4 | 28.3 |
| A2218-z1e,fe,ffootnotemark: | 2.00.7 | 1.8 | 1.4 | 26.70.2 | 27.60.4 |
| A2218-z2eeThese candidates lie close enough to bright sources, as to make unambiguous detection and robust measurement quite difficult. | 0.90.7 | 0.9 | 0.51.0 | 27.40.5 | 26.90.4 |
| A2219-z1 (lower left)ggA2219-z1 appears to be a blend of two sources (see Figure 3). While the lower left source is clearly a low redshift source, the upper right source seems to be a plausible candidate. | — | 1.60.2 | 0.50.3 | 26.00.2 | 26.00.2 |
| A2219-z1 (upper right)ggA2219-z1 appears to be a blend of two sources (see Figure 3). While the lower left source is clearly a low redshift source, the upper right source seems to be a plausible candidate. | — | 3.0 | 1.00.5 | 26.40.3 | 26.30.2 |
| A2390-z1hhThe colours we measure for these sources appear too blue to correspond to dropout galaxies at . | 1.5 | 1.6 | 0.00.4 | 26.80.3 | 26.60.2 |
| A2390-z2hhThe colours we measure for these sources appear too blue to correspond to dropout galaxies at . | 1.4 | 1.3 | 0.40.7 | 27.40.6 | 26.70.3 |
| A2667-z1f,if,ifootnotemark: | 2.1 | 1.4 | 0.50.4 | 26.60.3 | 27.50.6 |
| A2667-z2iiThese candidates have colours that are consistent with those of galaxies at . However, it is difficult to be sure given the limited depth of the optical data over Abell 2667 (Table 1: §4). | 2.10.7 | 2.0 | 0.90.3 | 25.60.1 | 25.90.1 |
| -dropouts | |||||
| A2219-j1jjThese sources are detected at 2 at optical wavelengths in our reductions, strongly suggesting that they do not correspond to star-forming galaxies at . Richard et al. (2008) also note this fact and concede that these two sources are not particularly compelling candidates. | — | 2.00.3kkThe colours tabulated here are relative to the -band, not the -band, and hence are , , and . | 1.20.5kkThe colours tabulated here are relative to the -band, not the -band, and hence are , , and . | 26.70.2 | 26.00.2 |
| A2667-j1jjThese sources are detected at 2 at optical wavelengths in our reductions, strongly suggesting that they do not correspond to star-forming galaxies at . Richard et al. (2008) also note this fact and concede that these two sources are not particularly compelling candidates. | 0.80.4kkThe colours tabulated here are relative to the -band, not the -band, and hence are , , and . | 1.3kkThe colours tabulated here are relative to the -band, not the -band, and hence are , , and . | 0.40.4kkThe colours tabulated here are relative to the -band, not the -band, and hence are , , and . | 27.81.0 | 26.40.2 |