Scaling of Rough Surfaces: Effects of Surface Diffusion on Growth and Roughness Exponents
Abstract
Random deposition model with surface diffusion over several next nearest neighbours is studied. The results agree with the results obtained by Family for the case of nearest neighbour diffusion [F. Family, J. Phys. A 19(8), L441, 1986]. However for larger diffusion steps, the growth exponent and the roughness exponent show interesting dependence on diffusion length.
I Introduction
The growth of rough surfaces and interfaces plays a major role in numerous phenomena of scientific interest and practical importance. There are many important aspects to the growth of surfaces. Growing surfaces can evolve into many forms. Flat, faceted, cusped and disorderly surfaces are familiar forms. In addition, surfaces may also develop grooves, solid or hollow whiskers, platelets, dendrites and other interesting structures. The problem of understanding the physical processes that control these morphologies is a major challenge with important practical implications. The processes taking place in, on, and around disorderly interfaces are also of interest for describing several microscopic phenomena. A comprehensive study of growth surfaces is necessary to understand the internal structure of a wide range of objects. The morphology, structure, other physical and chemical properties of growing interfaces have been a subject of great interest in recent years. The study of these properties finds applications in various physical, chemical and biological systems and processes such as film growth by vapour deposition thorn77 ; mess85 ; meak87 ; kar89 ; bales89 , bacterial growthfuji89 ; mat89 ; viscek90 , propagation of reaction fronts in catalyzed reactions albano97 , propagation of forest fires clar96 etc.
Most of the simple models like Eden growth models eden , ballistic deposition models vold , solid-on-solid models burton52 , reactive interface models kang93 , directed polymers karzhang87 , polynuclear growthfran74 ; kash77 ; gil84 , directed percolationkin83 etc. were originally developed to simulate natural processes as diverse as growth of cell colonies, sedimentation of colloids and crystallization of polymers. Some models were also developed theoretically such as surface growth with weak nonlinearity gate88 and surface growth with noise correlations medina89 . Computer simulations have played a major role in the development of better understanding of surface growth phenomena under both equilibrium and non-equilibrium conditions.
The simplest surface growth model is the random deposition model where particles fall vertically on randomly chosen sites and are deposited on top of the respective columns barabasi . The roughness of the interface increases indefinitely without any saturation. A modification of this model to better describe surface growth phenomenon, namely, random deposition model with surface diffusion was introduced by Family family86 . Here, the particles diffuse or relax to the nearest neighbouring site. The roughness of the interface increases initially and then saturates following dynamic scaling relations.
In this present work, we report the results of our study of generalized random deposition models with surface diffusion for different diffusion lengths. In each of our models, the saturation widths and scaling exponents show a characteristic dependence on the diffusion or relaxation length.
II Random deposition with surface diffusion
A quantitative investigation of surface growth involves study of interface width , characterizing the roughness of the interface, as a function of system size and the growth time . is defined by the root-mean-square (rms) fluctuation of the height of the interface. According to the dynamic scaling relationfamily85 , the interface width satisfies,
| (1) |
where and is a scaling function satisfying and for small . Thus, for intermediate times , where is a model-dependent saturation time, the interface width for a fixed system size has a power law dependence on ,
| (2) |
And for , it saturates to a time-independent value, , which scales with the system size as
| (3) |
The asymptotic scaling properties of the surface fluctuations of a given growth model are characterized completely by the growth exponent and roughness exponent described above.
The model of random deposition with surface diffusion was introduced by Familyfamily86 , in which a particle dropped in column sticks to the top of the column , or depending on which of the three columns has the smallest height. In case, , and columns have equal heights, then the particle sticks to the top of either or column, with equal probability. In the said study, it was claimed that there is no dependence of exponents on diffusion length. In the same paper, the growth exponent was found to converge to a value of asymptotically with increase in system size and the roughness exponent was estimated to be . It may be noted that the simulations were performed for relatively small system sizes between and .
In our present work, we study three variants of random deposition models with surface diffusion. Each of these models reduce to Family’s model for single step diffusion (). For larger system sizes between and , we observe significant and characteristic dependence of various exponents on the allowed number of diffusion steps .
II.1 Description of the models
The models studied in this work can be described as follows.
Model A: In this deposition model, particles are allowed to fall sequentially, one at a time, on randomly chosen sites on the growing surface and are deposited on top of the selected columns. After this deposition, the particle remains at this site if it is the only minimum among N-nearest neighbours on both sides. Otherwise, the particle diffuses to the nearest local minimum within the prescribed neighbourhood. If the nearest minima on two sides are equidistant from the selected site, the particle moves to either of these sites with equal probability.
However, in all of the models studied in this article, the particle cannot jump over any local maximum to reach a local minimum within the prescribed neighbourhood.

Model B: This model differs from Model A, in diffusion of the particle to the farthest local minimum within the prescribed neighbourhood. If the farthest minima on two sides are equidistant from the selected site, the particle moves to either of these sites with equal probability.

Model C: In this model, the particle moves to a minimum within N-nearest neighbours on both sides if this minimum is unique, otherwise, the particle moves randomly to one of the several minima with equal probability.

In all the above variants of random deposition model with surface diffusion, two random number generators were used, one for selecting the site on the growing surface and, another for depositing the particle with equal probability when there are multiple minima. These two random number generators are completely independent and uncorrelated to each other. These random number generators are based on linear congruential method knuth ; sedge .
III Results
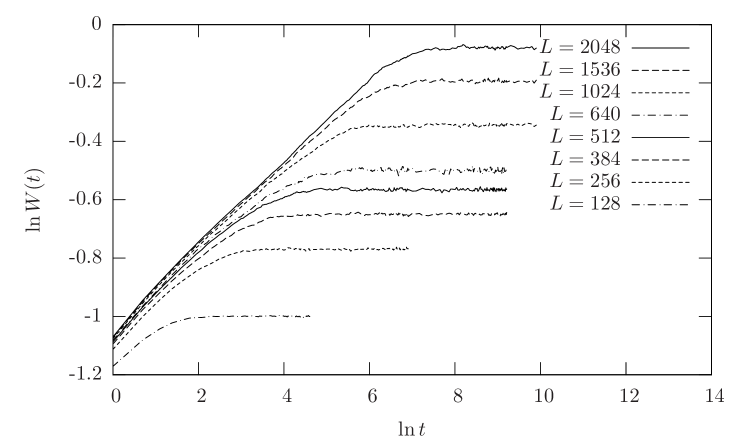
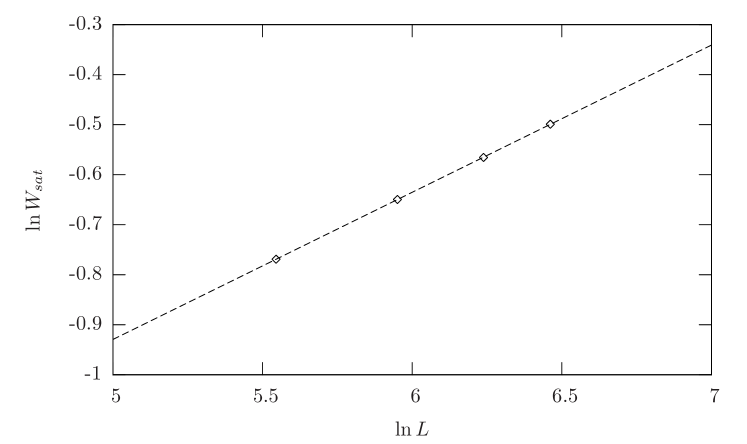
The interface widths were computed for different time-steps and for different system sizes between and . When presented graphically in log-log scale, these graphs show distinct growth and saturation regions. One such graph for Model A, for system sizes between and with diffusion step is shown in Fig.4. The saturation widths for various system sizes and diffusion lengths were calculated for all the models by means of a straight line fit of versus . One such characteristic linear fit for finding the roughness exponent is shown for Model A with diffusion step in Fig.5. The related data for the same is shown in Table 1.
| L | ||
|---|---|---|
| 256 | 5.5452 | -0.7690 |
| 384 | 5.9506 | -0.6496 |
| 512 | 6.2383 | -0.5656 |
| 640 | 6.4615 | -0.4991 |
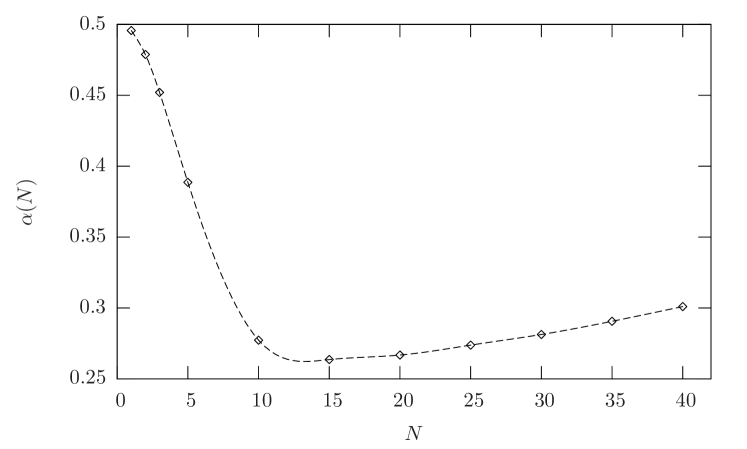
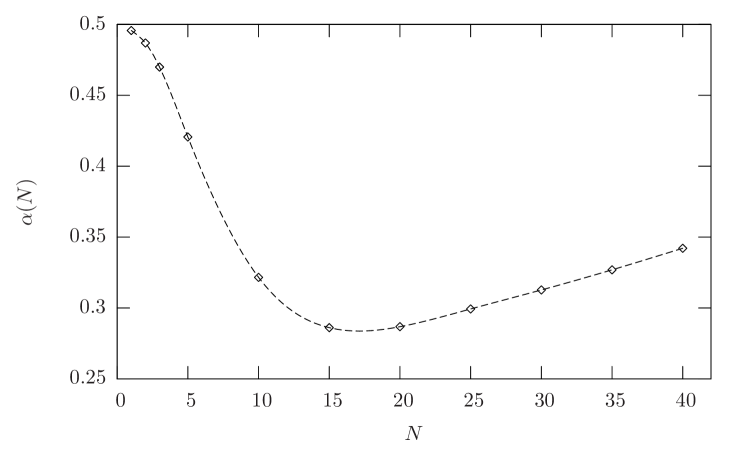
The roughness exponent shows an interesting dependence on the number of diffusion steps in all of the models studied. It shows a sharp decrease initially reaching a minimum around . With further increase in diffusion steps, it increases slowly. The relevant data is given in Table 2 and the dependence is shown in Fig.6, 7 and 8.
| N | Model A | Model B | Model C |
|---|---|---|---|
| 1 | 0.4957 | 0.4957 | 0.4957 |
| 2 | 0.4910 | 0.4788 | 0.4869 |
| 3 | 0.4802 | 0.4520 | 0.4699 |
| 5 | 0.4446 | 0.3886 | 0.4206 |
| 10 | 0.3412 | 0.2733 | 0.3216 |
| 15 | 0.2942 | 0.2636 | 0.2861 |
| 20 | 0.2968 | 0.2668 | 0.2868 |
| 25 | 0.3106 | 0.2738 | 0.2993 |
| 30 | 0.3258 | 0.2813 | 0.3127 |
| 35 | 0.3425 | 0.2906 | 0.3269 |
| 40 | 0.3606 | 0.3010 | 0.3421 |

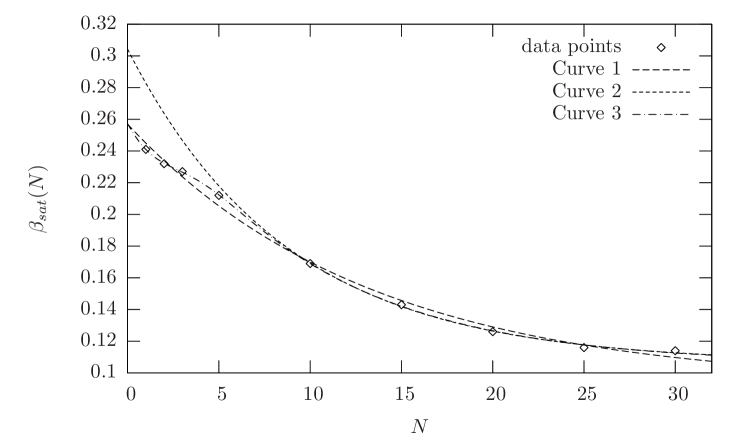
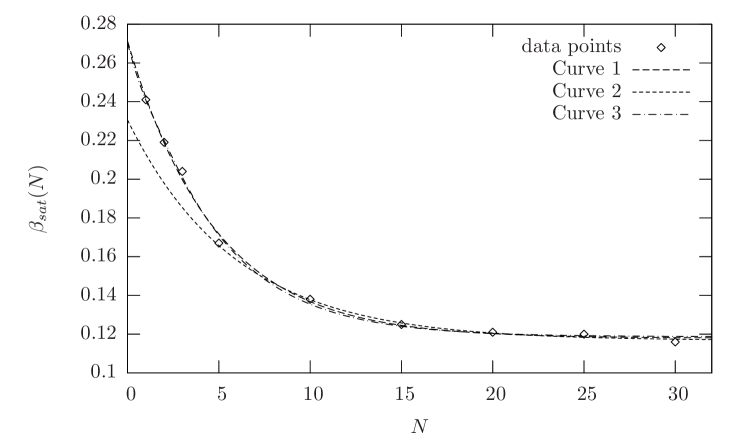
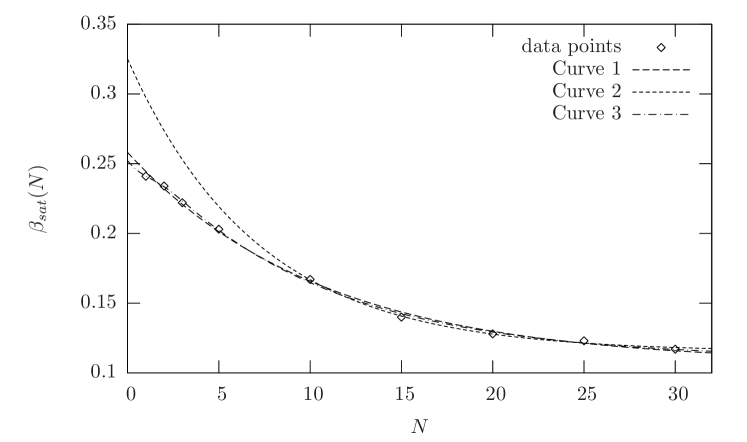
The growth exponent was calculated from the slope of the growth region in versus graph. With increase in system size, the growth exponent approaches a saturation value . It is further observed that this saturation value also shows a strong dependence on the number of diffusion steps . With increase in , asymptotically approaches a steady value . The relevant data showing this behaviour is given in Table 3 and the dependence is shown in Fig.9, 10 and 11.
To study the saturation behaviour with , two empirical forms of dependence were assumed and data were fitted to these non-linear forms.
| (4) |
| (5) |
where for the corresponding expression. The values estimated for ’s are shown in Table 4. Both the above forms show saturation with increase in diffusion length. As the fit with single exponential function, Eq.(4) was not very faithful over the entire range of values of diffusion length, particularly for Model A, a fit was also made to include data only corresponding to higher values of diffusion length. The empirical form of Eq.(5) however, shows an improved fit for Model A over the entire range of data points.
| N | Model A | Model B | Model C |
|---|---|---|---|
| 1 | 0.241 | 0.241 | 0.241 |
| 2 | 0.232 | 0.219 | 0.234 |
| 3 | 0.227 | 0.204 | 0.222 |
| 5 | 0.212 | 0.167 | 0.203 |
| 10 | 0.169 | 0.132 | 0.167 |
| 15 | 0.143 | 0.125 | 0.140 |
| 20 | 0.126 | 0.121 | 0.128 |
| 25 | 0.116 | 0.119 | 0.123 |
| 30 | 0.114 | 0.116 | 0.117 |
| Fitted curves for | Model A | Model B | Model C | |
|---|---|---|---|---|
| different models | ||||
| All data fitted to Eq.(4) | 0.0925 | 0.1179 | 0.1069 | |
| (Curve 1) | 0.1644 | 0.1532 | 0.1511 | |
| Large diffusion length | 0.1063 | 0.1167 | 0.1151 | |
| data fitted to Eq.(4) | 0.1979 | 0.1138 | 0.2099 | |
| (Curve 2) | ||||
| All data fitted to Eq.(5) | 0.1056 | 0.1187 | 0.1100 | |
| (Curve 3) | 0.1912 | 0.1636 | 0.1555 | |
| 0.0396 | 0.0123 | 0.0135 |
IV Conclusion
It was claimed in the study by Family family86 that the saturation widths and the exponents were independent of the diffusion length. However, in our study, we have found that both the growth exponent and the roughness exponent depend on the diffusion length. It may be noted that in the said reference, the simulations were carried out for relatively small system sizes between and . The study was therefore limited to smaller diffusion lengths, and perhaps the dependence on number of diffusion steps was missed.
When the system size is large, the extent of diffusion of a deposited particle is limited only by the diffusion length. As the diffusion length is increased, faster and more uniform smoothening of the interface is observed. As a result, decreases with both system size and time , thereby decreasing the exponents and . As a mechanism we propose that, as the diffusion length is further increased, the most jagged boundaries have smoothened to give a series of wide shallow valleys separated by crests. When the diffusion length becomes comparable to the width of these shallow valleys, a depositing particle has a higher probability of encountering the boundary of these valleys, i.e., the crests, before reaching the diffusion limit. As none of the models studied here allow surmounting any hill or crest while approaching a minimum on the other side, the diffusion of a particle gets restricted if it encounters a valley boundary before reaching its diffusion limit. This happens predominantly when the valley width is comparable with the diffusion length. In these cases, the dynamics is dominated by the existence of valley boundaries rather than the diffusion length. This is observed as a saturation in the growth exponent and decrease in roughness exponent followed by a slow increase. This behaviour needs to be investigated in further detail.
References
- (1) J. A. Thornton, Ann. Rev. Mater. Sci. 7, 239 (1977).
- (2) R. Messier and J. E. Yehoda, J. Appl. Phys. 58, 3739 (1985).
- (3) P. Meakin, J. Phys. A 20(16), L1113 (1987).
- (4) R. P. U. Karunasiri, R. Bruinsma and J. Rudnick, Phys. Rev. Lett. 62(7), 788 (1989); Erratum: Phys. Rev. Lett. 62(23), 2767 (1989).
- (5) G. S. Bales and A. Zangwill, Phy. Rev. Lett. 63(6), 692 (1989).
- (6) H. Fujikawa and M. J. Matsushita, J. Phys. Soc. Japan 58, 3875 (1989).
- (7) T. Matsuyama, M. Sogawa and Y. Nakagawa, FEMS Microbiology Lett. 61(3), 243 (1989)
- (8) T. Viscek, M. Cserzo and V. K. Horvath, Physica A 167(2), 315 (1990).
- (9) E. V. Albano, Phy. Rev. E 55, 7144 (1997).
- (10) S. Clar, B. Drossel and F. Schwabl, J. Phys.: Condens. Matter 8(37), 6803, (1996).
- (11) M. Eden, Symposium on Information Theory in Biology, Pergamon press, New York (1958); M. Eden, Proc. 4th Berkeley Symposium on Mathematics Statistics and Probability, Vol 4 (1961).
- (12) M. J. Vold, J. Colloid Sci. 14(2),168 (1959); J. Phys. Chem. 63(10), 1608 (1959); J. Phys. Chem. 64(11), 1616 (1960).
- (13) W. K. Burton, N. Cabrere and F. C. Frank, Phil. Trans. Roy. A Soc 243(10) , 299 (1951).
- (14) H. C. Kang and W. H. Weinberg, Phys. Rev. E 47(3), 1604 (1993).
- (15) M. Kardar and Y. C. Zhang, Phy. Rev. Lett. 58(20), 2087 (1987).
- (16) F. C. Frank, J. Crystal Growth 22(3), 233 (1974).
- (17) D. Kashchiev, J. Crystal Growth 40(1), 29 (1977).
- (18) G. H. Gilmer, J. Crystal Growth 49(3), 465 (1984).
- (19) W. Kinzel, Percolation Structures and Processes, eds. G. Deutcher, R. Zellen and J. Adler, (Hilger, Bristol),(1983).
- (20) D. J. Gates and M. Westcott, Proc. Roy. Soc. 416(1851), 443 (1988); Proc. Roy. Soc. 416(1851), 463 (1988).
- (21) E. Medina, T. Hwa, M. Kardar and Y. C. Zhang, Phys. Rev. A 39(6), 3053 (1989).
- (22) A. L. Barabasi and H. E. Stanley, Fractal Concepts in Surface Growth, Cambridge University Press (1995).
- (23) F. Family, J. Phys. A 19(8), L441 (1986).
- (24) F. Family and T. Viscek, J. Phys. A 18(2), L75 (1985).
- (25) D. E. Knuth, The Art of Computer Programming, Volume 2, Seminumerical Algorithms, Addison-Wesley, Reading Mass. (1981).
- (26) R. Sedgewick, Algorithms in C++, Addison-Wesley, Reading Mass. (1992).