Spectroscopic Confirmation of Faint Lyman Break Galaxies at Redshifts Four and Five in the Hubble Ultra Deep Field
Abstract
We present the faintest spectroscopically confirmed sample of Lyman break galaxies to date. The sample is based on slitless grism spectra of the Hubble Ultra Deep Field region from the GRAPES (Grism ACS Program for Extragalactic Science) and PEARS (Probing Evolution and Reionization Spectroscopically) projects, using the G800L grism on the HST Advanced Camera for Surveys. We report here confirmations of 39 galaxies, pre-selected as candidate Lyman break galaxies using photometric selection criteria. We compare a “traditional” V-dropout selection to a more liberal one (with ), and find that the traditional criteria are about complete and reliable. We also study the Lyman- emission properties of our sample. We find that Lyman- emission is detected in of the sample, and that our broad-band color selected sample includes of previously published line-selected Lyman- sources. Finally, we examine our stacked 2D spectra. We demonstrate that strong, spatially extended () Lyman- emission is not a generic property of these Lyman break galaxies, but that a modest extension of the Lyman- photosphere (compared to the starlight) may be present in those galaxies with prominent Lyman- emission.
1 Introduction
Star forming galaxies in the early universe have been found in large numbers both by looking for strong Lyman breaks, and by looking for Lyman- line emission. Galaxies found by these two methods differ greatly in their typical properties. This may indicate physically distinct galaxy populations, or selection effects inherent in the search methods, or a combination of the two. To help address these issues, we here examine the selection of Lyman break galaxies in the Hubble Ultra Deep Field (HUDF). The depth of the HUDF images means that Lyman- emitting galaxies with fluxes typical of present surveys should all be detected (down to flux ), even if they have no continuum emission at all. We combine these deep HUDF images with the deepest slitless spectra ever obtained, from the GRAPES and PEARS projects (see below). These slitless spectra allow us to look for prominent Lyman- line emission, with or without pre-selection for a Lyman break. We study the continuum properties of a set of Lyman- selected galaxies, to see what fraction pass our Lyman break crieteria. Conversely, we also study the emission line properties of a Lyman break selected sample. Moreover, we examine spectra for Lyman break samples selected with two sets of photometric criteria, one “traditional” and the other more inclusive.
The Grism ACS Program for Extragalactic Science (GRAPES) project and Probing Evolution And Reionization Spectroscopically (PEARS) project are slitless spectroscopic surveys that exploit the potential of the G800L grism on the Hubble Space Telescope’s Advanced Camera for Surveys (ACS) to achieve the most sensitive unbiased spectroscopy yet at red optical wavelengths (). Two primary factors enhance our sensitivity relative to ground-based spectrographs. First, high redshift galaxies are typically compact (e.g., Ferguson et al 2004; Pirzkal et al 2007; Hathi, Malhotra, & Rhoads 2008), so that the sensitivity of ground-based observations is hampered by atmospheric blurring of the galaxy images (and also usually by slit losses). Second, the OH emission line forest in the night sky spectrum raises the background level for ground-based observations, introducing random noise (and often systematic residuals as well) in red-light spectra of high redshift galaxies from the ground. Our HST spectra are free of both effects. Moreover, because the ACS grism is a slitless spectrograph, we obtain spectra of every source in our field of view, with no preselection required.
GRAPES was targeted in the HUDF region, to complement the HUDF direct images, which are in turn the deepest optical imaging to date (Beckwith et al. 2006). The GRAPES survey, and in particular our data analysis methods, are described in more detail by Pirzkal et al. (2004). PEARS (further described in Malhotra et al 2008) included an additional forty orbits of G800L integration on the HUDF, essentially doubling the integration time. A primary scientific goal of both surveys is to study the properties of Lyman break galaxies using spectroscopically confirmed samples at unprecedented sensitivity. We are pursuing this effort through a targeted look at Lyman break candidates identified in the HUDF using both an dropout criterion (Malhotra et al 2005) and a dropout criterion (this paper).
We refer to ACS filters by names of roughly corresponding ground-based filters: F435W B; F606W V; F775W i; and F850LP z. Throughout this paper we use the current concordance cosmology (, , ; see Spergel et al. 2003, 2007). We use AB magnitudes, so that magnitude zero corresponds to .
2 The Samples
We consider both Lyman break and Lyman- emission selected samples. For Lyman- selection, we use the previously published sample from Pirzkal et al (2007; hereafter P07), which in turn is based on the HUDF emission line catalog of Xu et al (2007). This sample contains 9 Lyman--emitting galaxies, spanning redshifts , line fluxes , and continuum magnitudes .
For Lyman break selection, we derive new samples based on HUDF photometric pre-selection combined with GRAPES/PEARS grism spectroscopy. Because we have spectra for all objects in our sample, we can examine a more inclusive set of Lyman break galaxy candidates than is practical for photometric studies. We examined as candidate LBGs all objects having , and . The magnitude cut prevents the sample from being swamped by galaxies too faint for accurate photometry or spectroscopy. We inspected visually the GRAPES and PEARS spectra of all objects passing these selection cuts, and retained in our final sample those objects whose spectra support a Lyman break identification.
| Object ID | RA | Dec | mag | Redshift | Grade | |||
|---|---|---|---|---|---|---|---|---|
| 119 | 53.1660037 | -27.8238734 | 27.51 | 2.14 | -0.62 | 28.97 | 4.88 | 2.5 |
| 201 | 53.1649949 | -27.8224088 | 27.59 | 1.23 | -0.24 | 32.92 | 4.60 | 2 |
| 478 | 53.1733579 | -27.8182711 | 27.06 | 1.11 | -0.06 | 30.65 | 4.52 | 2 |
| 546 | 53.158038 | -27.8179411 | 27.86 | 3.13 | 0.79 | 31.52 | 5.42 | 2.5 |
| 577 | 53.1614532 | -27.8174379 | 27.08 | 1.01 | 0.09 | 30.55 | 3.8 | 2.5 |
| 646 | 53.1660559 | -27.8167778 | 27.44 | 2.22 | 0.24 | 30.18 | 4.9 | 2 |
| 712 | 53.1783554 | -27.8162519 | 27.26 | 2.32 | 0.13 | 32.4 | 5.12 | 1.8 |
| 1115 | 53.1722726 | -27.8119732 | 26.40 | 1.85 | 0.17 | 28.89 | 4.72 | 1.8 |
| 1392 | 53.1563588 | -27.8095883 | 27.75 | 3.96 | -1.05 | 30.75 | 4.90 | 1 |
| 2408 | 53.1885357 | -27.8034637 | 26.76 | 1.77 | 0.14 | 31.82 | 4.86 | 2 |
| 2599 | 53.1626689 | -27.8022982 | 27.00 | 1.76 | -0.07 | 29.75 | 4.88 | 2 |
| 2736 | 53.1499325 | -27.8017358 | 26.94 | 1.39 | 0.11 | 32.27 | 4.56 | 2 |
| 2881 | 53.1415872 | -27.8005681 | 25.84 | 1.78 | 0.18 | 29.79 | 4.56 | 2 |
| 2894 | 53.1462482 | -27.8008077 | 27.58 | 2.57 | -0.10 | 29.85 | 5.3 | 2 |
| 2898 | 53.1798203 | -27.8008748 | 27.06 | 1.79 | -0.32 | 29.50 | 4.67 | 2.3 |
| 3094 | 53.1514271 | -27.7997637 | 25.72 | 1.18 | 0.02 | 29.57 | 4.62 | 1 |
| 3250 | 53.1326676 | -27.7989430 | 27.14 | 3.74 | -0.29 | 30.12 | 4.90 | 2.3 |
| 3968 | 53.1833331 | -27.7959556 | 27.56 | 3.35 | -0.82 | 31.55 | 4.7 | 2 |
| 5183 | 53.1437786 | -27.7908654 | 27.38 | 0.91 | -0.57 | 32.92 | 4.62 | 1 |
| 5225 | 53.1385743 | -27.7902115 | 25.83 | 1.52 | 0.04 | 27.87 | 5.42 | 2 |
| 5296 | 53.1907601 | -27.7903482 | 27.08 | 2.71 | 0.29 | 31.78 | 5.14 | 2.2 |
| 5307 | 53.1908538 | -27.7903656 | 27.15 | 2.53 | 0.38 | 30.39 | 5.14 | 2.2 |
| 5788 | 53.1456573 | -27.7882186 | 27.46 | 4.32 | 0.50 | 30.27 | 5.1 | 2 |
| 6066 | 53.1845519 | -27.7869713 | 26.11 | 0.93 | 0.01 | 29.12 | 4.42 | 1 |
| 6139 | 53.1581263 | -27.7863866 | 25.49 | 1.37 | -0.11 | 31.51 | 4.68 | 1.2 |
| 6515 | 53.1273697 | -27.7851656 | 27.15 | 1.25 | -0.24 | 29.75 | 4.75 | 1 |
| 6681 | 53.1926615 | -27.7841483 | 27.10 | 2.25 | 0.41 | 28.81 | 5.08 | 1.3 |
| 7050 | 53.1510392 | -27.7828658 | 27.36 | 4.13 | 0.50 | 30.44 | 5.45 | 2.2 |
| 7352 | 53.1376954 | -27.7812680 | 26.87 | 2.88 | -0.02 | 29.37 | 5.04 | 2.5 |
| 8301 | 53.1671692 | -27.7745246 | 27.18 | 2.91 | 0.22 | 32.47 | 5.0 | 2 |
| 8664 | 53.1890652 | -27.7770042 | 26.77 | 2.08 | 0.08 | 29.9 | 4.9 | 1.3 |
| 8682 | 53.1888007 | -27.7770931 | 25.62 | 1.94 | 0.06 | 28.70 | 5.08 | 2 |
| 8896 | 53.1900052 | -27.7790544 | 26.92 | 1.56 | 0.09 | 31.30 | 4.33 | 2 |
| 9040 | 53.1711852 | -27.7784585 | 25.97 | 3.42 | -0.49 | 28.3 | 4.55 | 2 |
| 9057 | 53.1829957 | -27.7804592 | 26.90 | 0.91 | -0.02 | 31.84 | 4.17 | 2 |
| 9275 | 53.1531485 | -27.766181 | 25.83 | 1.26 | 0.14 | 28.93 | 5.12 | 2 |
| 9777 | 53.1702387 | -27.7628552 | 26.17 | 1.95 | 0.85 | 30.20 | 5.41 | 2.5 |
| 9983 | 53.1671627 | -27.7598546 | 25.62 | 1.79 | 0.17 | 32.27 | 4.82 | 2 |
| 20191 | 53.1725558 | -27.8137100 | 25.73 | 1.41 | 0.09 | 31.48 | 4.62 | 1 |
Note. — Properties of V dropout sources from GRAPES + UDF data. “ID” is the HUDF catalog number, since we used the HUDF catalog as the master object list for GRAPES. The “Grade” column indicates the quality of a candidate as assessed by visual inspection of the GRAPES and PEARS spectra. Objects assigned grade 1 are very secure Lyman break galaxies, while those assigned grade 2 are probable LBGs. Some objects are assigned non-integer grades between these possibilities. We also identified “grade 3” objects, for which our data could neither confirm nor refute a photometrically identified Lyman break candidate, and “rejected” objects, shown not to be Lyman break objects by their grism spectra. We do not tabulate these lower category sources.
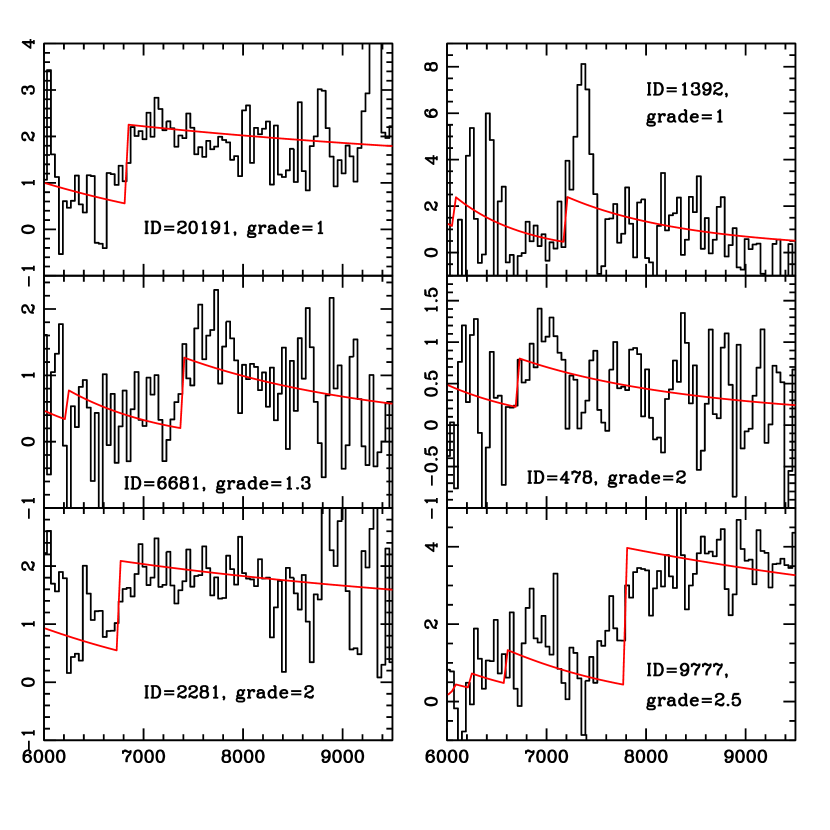
To determine redshifts, we fitted our spectra with a model consisting of a power law continuum attenuated by Lyman- forest absorption, which we modeled using the formalism of Madau (1995). We thus fitted three parameters to each spectrum: the flux normalization, spectral slope, and redshift. In cases with strong Lyman- line emission, the fitted slope is strongly biased towards blue values, since we do not expliclitly fit emission lines.
We then assessed the best fitting model for each spectrum and assigned a grade to each. These grades were based on the of the fit, the signal to noise in the spectrum, and a visual inspection of the fit. Grade 1 was given to the highest quality fits, where the LBG identification and redshift are very secure. Grade 2 was given to reasonably secure Lyman break objects. Grade 3 was given to sources that remain possible Lyman break objects but that cannot be confirmed, whether because the signal-to-noise was insufficient, or because the spectra suffered from contamination. Finally, grade 4 was assigned to photometric candidates that were refuted by the grism spectra. We assigned fractional grades to a modest number of galaxies where it seemed warranted.
In total, we considered 216 candidates fulfilling the photometric selection criteria. A few additional objects were examined in the early stages of the project, resulting in the inclusion in the final sample of two V dropouts (IDs 546 and 1392) having . In total, we classified 39 objects as “good” (1 grade 2.5) Lyman break objects, 86 as refuted (grade 4) objects, and 94 as grade 3 (“unidentified”). Representative spectra for grades from 1 to 2.5 are shown in figure 1. The brightest confirmed Lyman break galaxies have . The fraction of grade 3 (“unidentified”) sources rises steadily from 0 at to 100% at . A very rough linear fit is . Among those sources adequately classified using the grism spectra, the fraction confirmed as Lyman break galaxies rises weakly towards fainter magnitudes, from at to at . To understand this, consider the primary contaminants of the photometrically selected Lyman break candidate lists. These are red stars in our Galaxy, and early type galaxies at intermediate redshifts. While the number-magnitude relation for Lyman break galaxies is steeply rising around , the number-magnitude relations for both contaminants are much flatter, and therefore the LBG fraction rises at the faint end.
The V dropout sample includes a range of morphologies, from simple, compact galaxies to extended sources with tails and/or multiple peaks (e.g., HUDF 5225; Rhoads et al 2005). Detailed morphological analysis of these and other high redshift UDF sources has been discussed by Pirzkal et al (2005, 2006).
3 Discussion
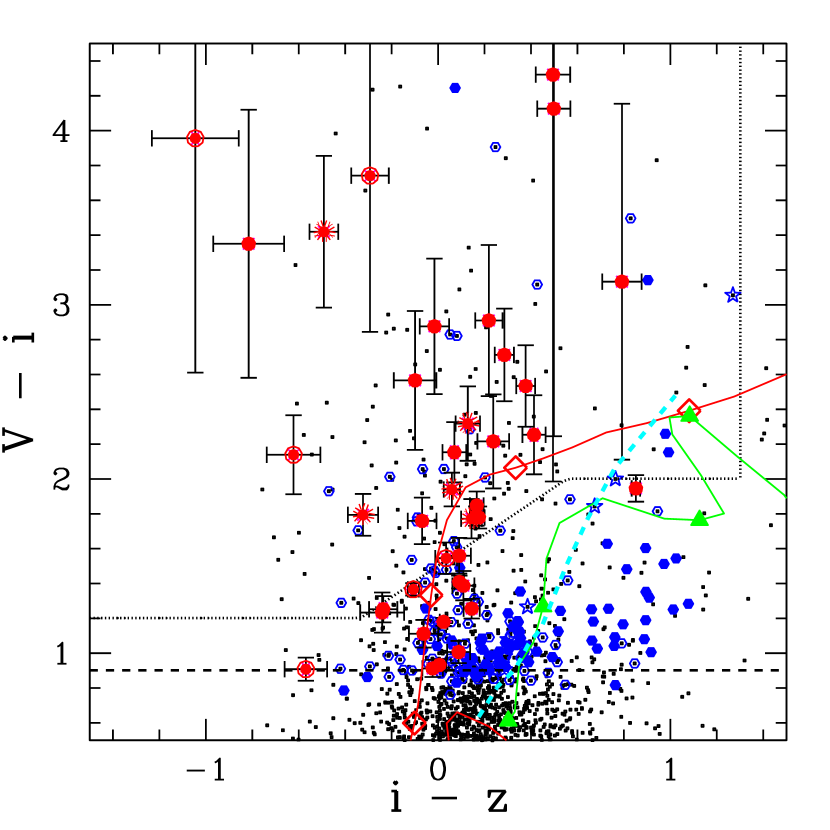
We compared our sample with the set of objects selected by the V dropout selection criteria that Giavalisco et al (2004) developed for the GOODS project. Those criteria are
| (1) |
We used the same magnitude cut when applying equation 1. Figure 2 illustrates both selection criteria in the color-color plane.
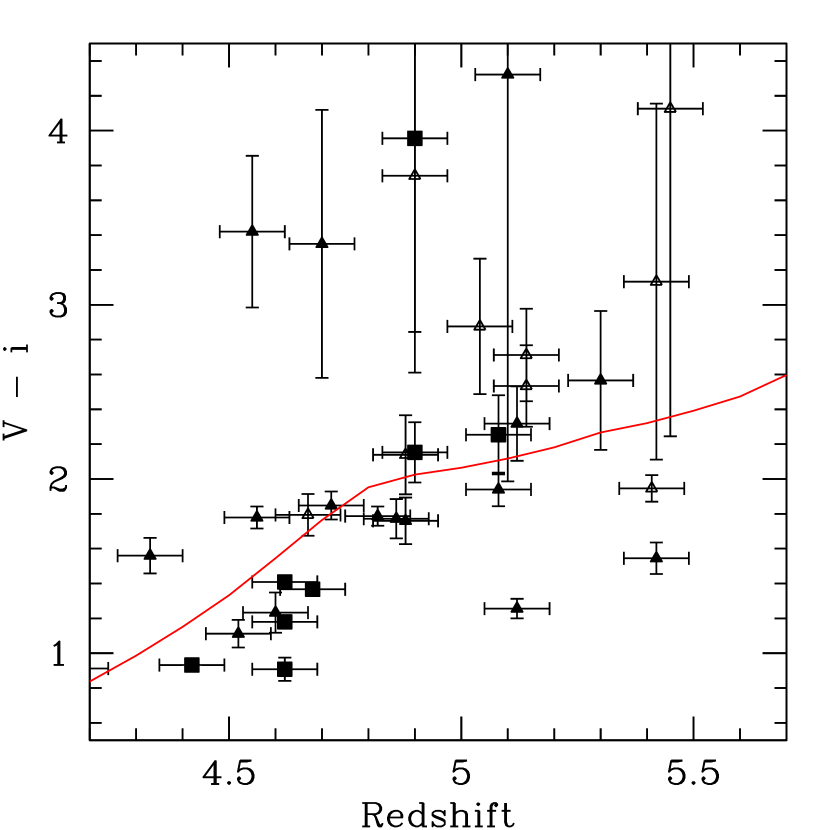
Of the 39 good Lyman break galaxies, 25 meet the Giavalisco et al selection criteria directly (eq. 1). One of these lies within of the selection region boundary, as do five objects that would narrowly fail the Giavalisco et al criteria. Thus, the photometric V-dropout criteria have a completeness of compared to the simple cut of our spectroscopic sample. Most of the confirmed V-dropout LBGs missed by eq. 1 appear to be LBGs at a slightly lower redshift: Our color-redshift calculations indicate that a star forming galaxy should lie at to meet eq. 1, and to meet . These redshift boundaries will of course be blurred by variations in the galaxies’ stellar populations, dust content, and Lyman- line strength, all of which have some effect on galaxy colors. In practice, although only three of our spectroscopically measured redshifts actually fall at , there is a reasonable correlation between and redshift , and the inclusion of objects with does lower the mean redshift of the sample (see figure 4).
The reliability of the photometric criteria is broadly comparable. In total, we find 50 objects passing the criteria of eq. 1: The 25 confirmed Lyman break galaxies discussed above, plus 27 other sources not confirmed as Lyman break objects. Among these, 21 had inconclusive (grade 3) spectra, two are stars (grade-5), and only four are considered “refuted” with grade=4. Leaving aside the grade=3 sources, then, some of the objects that meet the photometric criteria are confirmed by inspection of their GRAPES/PEARS grism spectra. Combining this with the completeness would naively imply that V drop galaxy counts derived directly from eq. 1 are slightly underestimated, by a factor of .
The color criterion in eq. 1 seems unlikely to strongly affect which galaxies are included in the sample. The reddest galaxy actually selected still has . Thus, if there are redshift Lyman break objects with , they would have to form a disjoint population from the star-forming sample discussed in the present work. This cut does, however, help exclude L and T dwarfs from the sample.
A final point about sample selection is that Lyman break galaxies constitute only of those objects failing the Giavalisco et al criteria while still having and . Thus, for a purely photometric criterion, eq. 1 is quite good, and in the absence of spectra we could not advocate a simple selection. Expanding the selection region to include objects with and would be better than merely using alone (since the cut eliminates many interlopers and no confirmed objects in our sample). This would increase the sample’s completeness, but it would still reduce the overall reliability of the photometric selection when compared to the Giavaliso et al selection.
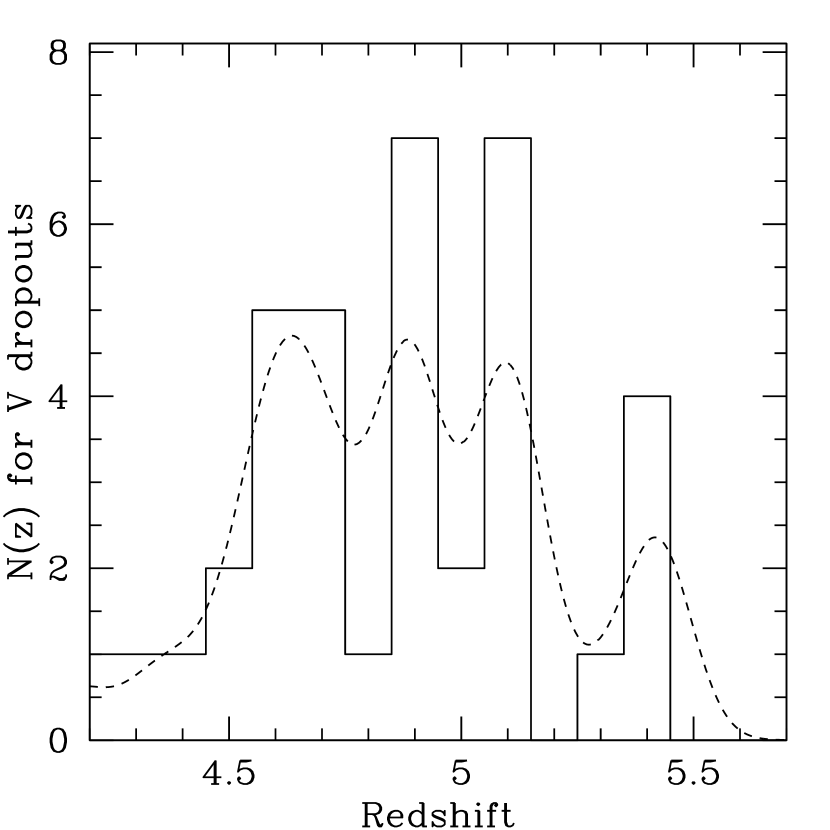
We show the redshift distribution of the V dropout sample in figure 3. The distribution shows no convincing structure beyond a broad maximum. In particular, we do not see any large scale overdensity akin to the one we reported at based on the GRAPES dropout sample (Malhotra et al 2005). The observed maximum spans , and can be understood by considering the redshift-dependence of the selection criteria. At , the color is not red enough for the selection. At , reduction of the -band flux by the Lyman- forest is becoming significant.
We should expect the observed colors of the Lyman break objects to grow redder with increasing redshift, as the Lyman- forest absorption shifts through the V bandpass. This effect is apparent in figure 4, though there is considerable scatter at each redshift.
3.1 Lyman- Emission Properties
With spectra of every Lyman break galaxy in the Hubble Ultra Deep Field, we can examine the statistics of Lyman- emission from galaxies in our sample. We have previously published lists of emission line objects in the field (Xu et al 2007; Straughn et al 2008) and a more specific study of the Lyman- galaxies, focussing on their ages, masses, and morphologies (Pirzkal et al 2007; hereafter P07).
Starting from the Lyman- galaxy sample of P07 and the V-dropout Lyman break galaxy sample in this work, we find that five (ID numbers 712, 5183, 5225, 6139, and 9040) have previously identified Lyman- emission lines. There are an additional four Lyman- emitting galaxies in the P07 sample. Three of these (ID numbers 631, 9340, and 9487) are too blue to be included in our sample, and the fourth (ID number 4442) is too faint for our criterion. The P07 sample was based essentially on an emission line search combined with a stringent upper limit on -band ( nm) flux. The completeness of the emission line search is treated in Xu et al (2007). That sample is expected to be quite complete for Lyman- galaxies that have , Å, , and . We conclude that of such Lyman- emitting galaxies also pass our V dropout criteria. While the remaining Lyman- galaxies are still well detected in the photometric catalog, many fail the dropout color criteria.
In addition to these previously identified Lyman- objects, we find good visual evidence for Lyman- emission in objects 1392, 2898, 3250, and 6515. Weaker evidence of a possible line is seen in 2408 and 8682. Object 119 also shows a clear emission line, which could be Lyman- at . However, this line was interpreted in Xu et al (2007) as [O III] 4959,5007. (The ambiguity is linked to the object’s faintness, , and we have assigned this object a grade of to reflect the uncertainty in its redshift.) The detection of new Lyman- emitters in the present paper is due to two factors. First, we have lower effective detection thresholds in line luminosity and/or equivalent width in the current work, because our line list includes objects identified by visual inspection of both 1-D and 2-D spectra in photometrically pre-selected high redshift galaxies. Thus, an emission line does not need as high a statistical significance to enter the present sample as was required in Xu et al (2007). Second, we are using not only the GRAPES data but also the PEARS-Deep data, nearly doubling the available data. This provides better statistical signal-to-noise ratio on most objects, and improved robustness to contamination by overlapping spectra thanks to the additional four position angles of data.
Combining all the detected Lyman- lines, we infer a Lyman- emission fraction in the range to for the V dropout sample.
There are two main ways in which HST grism searches can miss Lyman- emission from well detected galaxies. First, the emission line is always located at the same wavelength as the continuum break introduced by Lyman- forest absorption. This imposes a minimum observer-frame equivalent width that is comparable to the effective spectral resolution of the instrument. This spectral resolution, in turn, is set by the angular size of the target, given the slitless instrument.
Second, Lyman- emission could come from a “photosphere” that is more extended than the star-forming regions that dominate the UV continuum light. There is a plausible physical mechanism for such extended Lyman- emission, namely, resonant scattering of Lyman- photons by neutral hydrogen in and around the emitting galaxy. Moreover, observations of Lyman- “blobs” up to in size (e.g Steidel et al 2000) provide direct evidence that Lyman- can be scattered or emitted over wide spatial scales, at least in some rare objects. P07 report the effective radii in continuum emission for their sample of nine Lyman- galaxies. Among these, six have sizes corresponding to FWHM, and the remaining three have sizes near . If the typical Lyman- photosphere is larger (i.e. in extent), some Lyman- lines would be missed in the slitless HST spectra, because their large spatial extent would translate to very broad line widths. translates to , which in turn corresponds to a 400Å observed line width. Xu et al (2007) report a 70% detection completeness for 400Å lines, but this completeness drops (approximately linearly) to zero as the line width rises to 650Å (corresponding to size).
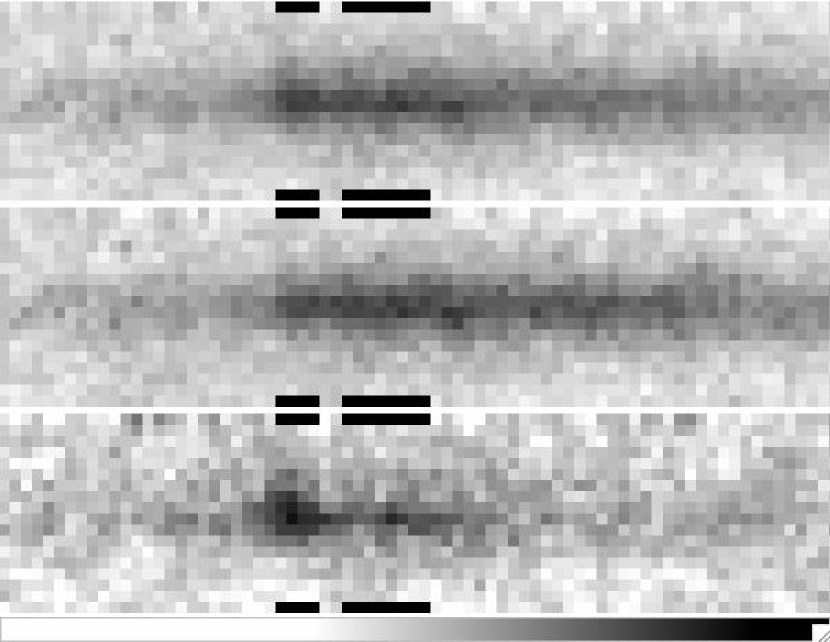
To address this possibility, we stacked the 2-dimensional grism images of all 39 V-dropout galaxies, shifting them in wavelength to align the expected location of any Lyman- emission in all spectra. All position angles were included in the average. The resulting average 2D spectrum is shown in figure 5. If spatially extended Lyman- flux is prevalent in our sample, we should expect to see a region of diffuse emission at the Lyman- wavelength. Moreover, the profile of this emission would be a fair representation of the “average” Lyman- emission morphology. In practice, we see no evidence for extended Lyman- emission in this figure. The continuum emission, a Lyman- break, and weak transmitted flux through the Lyman- forest region are all clearly detected. We also made a stack of the ten best Lyman- emitters, and a stack of all the remaining 29 objects. The “Lyman-stack” shows a clear emission line. Moreover, this line appears somewhat extended on visual inspection (figures 5 and 6). The difference is not highly significant, but a direct measurement of the spatial width of the spectrum yields FWHM=0.19” (or ) in the continuum region, and 0.26” (or ) in the line region.
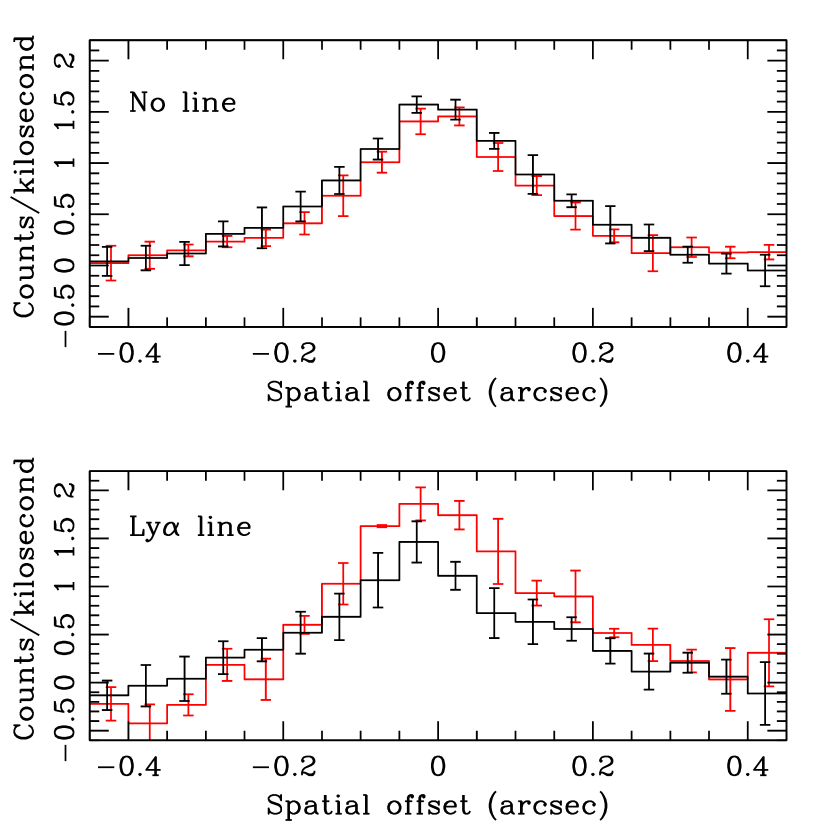
As a quantitative test for extended Lyman-, we have compared the spatial profile of the stacked spectrum (perpendicular to the dispersion direction) at both the Lyman- location and in the adjacent continuum region. We find that the two profiles are indistinguishable (figure 6) . Thus, while we cannot rule out extended Lyman- emission in a minority of cases, it is at most an exception to the rule, rather than a generic phenomenon in Lyman break galaxies. To place a quantitative upper limit on the flux in a spatially extended component, we first measure the noise level in the composite spectrum, which is about count/ksec/pixel. This corresponds to a flux level of in one ACS WFC pixel. If we co-add the results for a larger solid angle , we expect the limit to scale as . We define two sets of pixels, each consisting of two rectangular regions and so totaling , and each excluding a strip wide along the trace of the stacked spectrum. The first set of pixels is centered at the expected location of Lyman- emission, while the second is centered away, towards the red end of the spectrum. We take the total fluxes in these two sets of pixels, apply the wavelength-dependent sensitivity conversion factor, and compare the results. In the region where diffuse Lyman- might be expected, we find a formal flux excess of . This is comparable to the typical fluxes of ground-based narrowband Lyman- surveys.
4 Summary
We have examined GRAPES and PEARS spectra of 216 photometrically selected candidate Lyman break galaxies, and spectroscopically confirmed 39 of them. Our pre-selection used a wider range of color space () than more traditional “V-dropout” Lyman break color criteria, in order to assess the completeness of those criteria, along with their reliability. We find that 64% of our confirmed objects meet the traditional criteria. Among those galaxies passing the traditional criteria, and having adequate spectra for classification, we find that are confirmed as Lyman break galaxies. Our V drop sample includes 55% of Lyman- emitting galaxies previously identified in this redshift range using GRAPES data (Xu et al 2007, Pirzkal et al 2007). The “missing” Lyman- galaxies are either too blue in (in part due to the emission line in the V filter) or too faint in the continuum for our V dropout selection criteria. We also detect 4–7 additional Lyman- galaxies not included in the earlier samples. Our overall Lyman- detection fraction is comparable to that in spectroscopic followup of other Lyman break surveys (e.g., Steidel et al 2000). We have examined our stacked 2D spectra for evidence of the diffuse Lyman- emission that might result from resonant scattering of Lyman- photons in neutral hydrogen near young galaxies. In the overall stack of 39 galaxies, we find no significant evidence for such emission down to a upper limit of over an region. On the other hand, when we examine the composite spectrum of just those galaxies with individually identified Lyman- lines, we see a modestly broader spatial profile at the wavelength of Lyman- than in the adjacent continuum. This is consistent with the possibility that scattering of Lyman- photons results in a somewhat extended Lyman- photosphere in these objects.
References
- (1)
- (2) Beckwith, S. V. W., et al. 2006, AJ 132, 1729
- (3) Ferguson, H. C., et al. 2004, ApJ 600, L107
- (4) Giavalisco, M., et al. 2004, ApJ 600, L103
- (5) Hathi, N. P., Malhotra, S., & Rhoads, J. E. 2008, ApJ 673, 686
- (6)
- (7) Madau, P. 1995, ApJ 441, 18
- (8) Malhotra, S., et al. 2005, ApJ 626, 666
- (9) Malhotra, S., et al 2008, in preparation
- (10) Pickles, A. J. 1998, PASP, 110, 863
- (11) Pirzkal, N. et al. 2004, ApJS 154, 501
- (12) Pirzkal, N., Malhotra, S., Rhoads, J., & Xu, C. 2005, BAAS 207, 22.16
- (13) Pirzkal, N., Sahu, K. C., Burgasser, A., Moustakas, L. A., Xu, C., Malhotra, S., Rhoads, J. E., Koekemoer, A. M., Nelan, E. P., Windhorst, R. A., Panagia, N., Gronwall, C., Pasquali, A., & Walsh, J. R. 2005, ApJ 622, 319.
- (14) Pirzkal, N., Xu, C., Ferreras, I., Malhotra, S., Mobasher, B., Rhoads, J. E., Pasquali, A., Panagia, N., Koekemoer, A. M., Ferguson, H. C., & Gronwall, C. 2006, ApJ 636, 582.
- (15) Pirzkal, N., Malhotra, S., Rhoads, J. E., & Xu, C. 2007, ApJ 667, 49
- (16) Rhoads, J. E., et al. 2005, ApJ 621, 582
- (17) Spergel, D. N., et al. 2003, ApJS, 148, 175
- (18) Spergel, D. N., et al. 2007, ApJS, 170, 377
- (19) Steidel, C. C., Adelberger, K. L., Shapley, A. E., Pettini, M., Dickinson, M., & Giavalisco, M. 2000, ApJ 532, 170
- (20) Straughn, A., et al 2008, AJ, submitted.
- (21) Xu, C., et al 2007, AJ 134, 169
- (22)