Chromospheric Activity, Rotation, and Rotational Braking in M and L Dwarfs
Abstract
We present results from a high-resolution spectroscopic survey of 45 L dwarfs, which includes both very low-mass stars and brown dwarfs. Our spectra allow us to derive a significant number of new rotational velocities, and discover a slowly rotating (in projected velocity) L dwarf that allows more accurate measurement of spectroscopic rotations for these objects. We measure chromospheric activity (and often its variability) through the H emission line. Our primary new result is good evidence that magnetic braking dominates the angular momentum evolution of even brown dwarfs, although spindown times appear to increase as mass decreases. We confirm that activity decreases as effective temperature decreases, though a larger fraction of L dwarfs are active than has previously been reported. Essentially all active objects are also variable. We confirm the lack of a rotation-activity connection for L dwarfs. We find a minimum limit for rotational velocities that increases with later spectral types, rising from near zero in older mid-M stars to more than 20 km s-1 for mid-L objects. There is strong evidence that all L dwarfs are rapid rotators. We derive a braking law that can depend on either temperature or mass which can explain all the rotational results and provides an age dependence for the angular momentum evolution. It is clear that angular momentum loss mechanisms in smaller and cooler objects become more inefficient, starting at the fully convective boundary.
Subject headings:
stars: activity — stars: late-type — stars: low-mass, brown dwarfs — stars: rotation1. Introduction
The evolution of magnetic activity and angular momentum in low-mass stars and brown dwarfs provides fundamental insights into the nature of low-mass objects and fully convective dynamos. Rotation and activity in low-mass stars and brown dwarfs are discussed in the work by, for example, Mohanty & Basri, (2003); Liebert et al., (2003); West et al., (2004); Zapatero Osorio et al., (2006); Schmidt et al., (2007). In comparison to early-M stars, normalized activity does not weaken until spectral type mid-M; after that it diminishes, but flares are still observed in early L dwarfs. Among the M dwarfs, Mohanty & Basri, (2003) found evidence for a rotation-activity connection down to spectral type M8.5 but a sharp break in this connection in cooler objects than that.
The investigation of rotational evolution of low-mass stars and brown dwarfs is complicated by several effects. At young ages, they all contract gravitionally, leading to rotational spin-up. Thus objects of ages between 10-100 Myrs generally are rapidly rotating (e.g. Barnes,, 2003). On the ZAMS, stars do not significantly contract any further but instead suffer rotational braking through a magneto-thermal wind that is driven by magnetic activity (e.g. Mestel,, 1999). Among low-mass stars, this braking is strongest in early-M stars among which almost all have rotational velocities below the detection limit (Marcy & Chen,, 1992; Delfosse et al.,, 1998). Brown dwarfs don’t reach the ZAMS, but do finish most of their contraction after about a Gyr.
A very large fraction of early M stars are rotating too slowly to be detected by spectroscopic broadening. A sudden change in rotational braking appears around spectral type M3, in the sense that a large fraction of stars later than M3 are rapid rotators compared with early M stars. The rapidly rotating mid-M dwarfs are members of the young disk population while older mid-M stars tend to rotate more slowly (Delfosse et al.,, 1998). This means that rotational braking is still working in mid-M type stars, but that spindown times are longer than for the early-M dwarfs. An age-activity relation has recently been quantified by West et al., (2008), which could be related to rotational braking and a rotation-activity connection. The difference in rotational braking between early- and mid-M stars is possibly due to the fully convective nature of the latter – the threshold at which rapid rotation occurs coincides with the threshold to complete convection. If so, it is more likely a manifestation of field geometry than field strength, since fully convective stars produce fields at least as strong as partially convective stars (Reiners & Basri,, 2007).
Objects of spectral type M6.5 or later can either be stars at ages of several Gyrs, or they can be young brown dwarfs. As they age, brown dwarfs leave the M spectral range, evolving towards lower temperatures through the spectral types L and/or T (Burrows et al.,, 1997; Baraffe et al.,, 2003). During this evolution, they continuously contract, leading to constant rotational acceleration. The rotational evolution of brown dwarfs is not well known. Rotational velocities of young brown dwarfs were measured by Mohanty et al., (2005). The results from measuring rotational periods in young brown dwarfs are summarized in Herbst et al., (2007). Rotation in field late-M and L dwarfs was measured by Mohanty & Basri, (2003), and in objects down to spectral class T by Zapatero Osorio et al., (2006). In the latter work the authors provide a model for the rotational evolution of brown dwarfs based on gravitational contraction. This model explains the lack of slowly rotating late-L dwarfs by contraction during the lifetime of a brown dwarf.
In this paper, we provide measurements of rotation and chromospheric (H) activity in a substantial sample of 45 L dwarfs. We investigate activity among low-mass stars and brown dwarfs. We measure rotational velocities for our sample. Together with velocities taken from the literature, we can investigate a comprehensive sample of ultra-cool stars and brown dwarfs with measured rotation velocites. We use this sample to constrain the rotational evolution of brown dwarfs, and show that the present data indicates that wind-braking is still important in brown dwarfs.
2. Observations and Data Sample
To investigate rotation and activity in L dwarfs, we collected a large sample of high resolution L dwarf spectra. This sample consists of new spectra we took at HIRES/Keck and UVES/VLT, and of spectra taken from the UVES data archive which we reanalyze. We include in our analysis results on rotation and H emission adopted from the literature. Sample selection is based on brightness criteria to maximize the number of observed L dwarfs. This means that the sample is very heterogeneous and probably biased towards young (hence bright) targets. Sample data are shown in a spectral atlas covering the wavelength range 6400–10200 Å in Reiners et al., 2007b .
2.1. New Observations
The first part of our data set consists of 61 high resolution spectra of 45 L dwarfs; their exposure times and SNR as measured in the FeH band are shown in Table 1. All spectra cover the spectral range from H up to 1 m, including the Wing-Ford band of molecular FeH. 22 spectra were obtained by us with the HIRES spectrograph at Keck observatory. The three HIRES CCDs cover the spectral region from 5700 Å to 10 000 Å in one exposure. HIRES spectra were taken at a slit width of 1.15 ″, yielding a resolving power of . In addition to that, 39 spectra were taken with the UVES spectrograph at the VLT. 24 of them were observed in service mode for our program (PIDs 077.C-0449 and 078.C-0025); the remaining 15 are from the ESO science archive under PID 065.L-0199 (PI C.A.L. Bailer-Jones, see Bailer-Jones,, 2004). The UVES spectra from our program and the ones from the archive are taken with similar settings. Our new data are centered at 830 nm at a slit width of 1.2 ” (), archive data are centered at 837 nm with a slit width of 1.0 ” (). Both setups cover the wavelength region 6400–10 250 Å on two CCDs.
2.2. Data from the Literature
In our discussion of rotation and activity we enrich our sample with three high spectral resolution samples from the literature. Mohanty & Basri, (2003) give rotation velocities and H equivalent widths of mid- to late-M dwarfs and 13 L dwarfs. Their data were taken with the old HIRES CCD before the detector was upgraded to a 3-CCD array, hence the data does not cover the FeH band. Delfosse et al., (1998) measured rotation and H activity in a large sample of M-dwarfs. We use their results to compare activity between M and L dwarfs. Mohanty & Basri, (2003) and Delfosse et al., (1998) measured the projected rotation velocities with the cross-correlation technique using a slowly rotating mid-M star as a template. This method can be expected to be very accurate among the M dwarfs. For the L dwarfs, however, we suggest below that such a measurement can be affected by the mismatch of the template’s and the target’s spectral types.
Reiners & Basri, (2007) report rotation velocities, H activity and the magnetic flux for 22 M dwarfs. In the work presented here, we follow the same analysis strategies but without the measurement of magnetic flux, which becomes quite difficult for the L dwarfs in their heavily saturated FeH band. We include the sample from Reiners & Basri, (2007) in the comparison of the M dwarf and L dwarf rotation-activity connection.
3. Analysis
3.1. Stars with Li-absorption
Our spectral coverage includes the Li line at Å. We find Li absorption in three objects, 2MASS060239 (L1.0, km s-1, no H emission), 2MASS205702 (L1.5, km s-1, ), and we confirm its existence in 2MASS130525 (Kelu-1, L2.0, km s-1). At such low temperature, this means that the three objects are substellar and likely younger than a few hundred million years (Basri,, 2000). 2MASS205702 has a very low tangential velocity of km s-1 (Schmidt et al.,, 2007) consistent with youth (Chiba & Beers,, 2000). We see no Li absorption in any other target, among them 2MASS052314, a mid-type L-dwarf (L2.5) with very low tangential velocity ( km s-1), hence probably young. Lack of lithium is not firm evidence of a stellar nature; brown dwarfs above 60 jupiter masses will also deplete their lithium within a few hundred million years.
3.2. H Emission
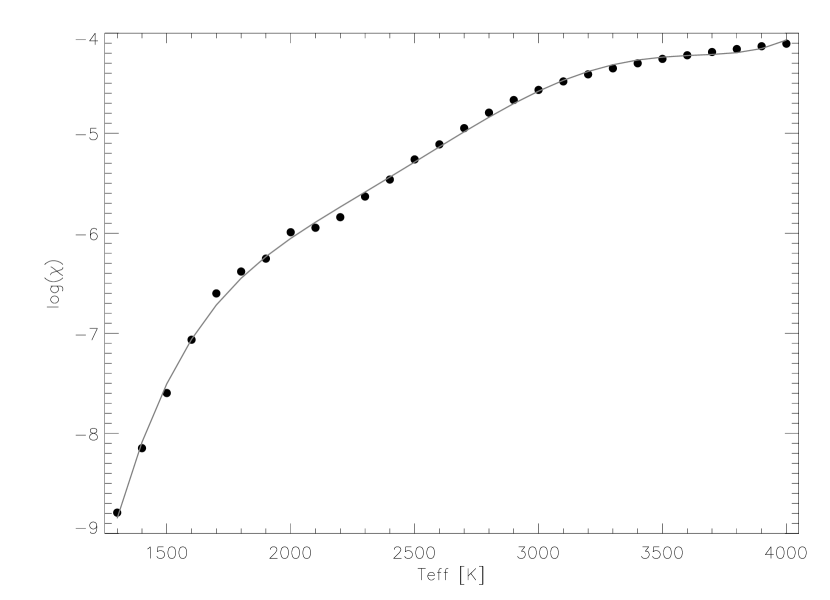
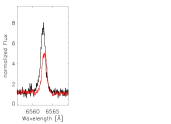
To measure the equivalent width in the H line against the continuum, we normalize the line at two footpoints blue- and redward of H. The footpoints are the median values at 6545 – 6559 Å on the left hand side, and at 6567 – 6580 Å on the right hand side of the H line. None of the emission lines found in our targets extends into the region used for normalization. The H equivalent width is then measured by integrating the flux from 6552 to 6572 Å. The uncertainty in our equivalent width measurement is approximately 0.2Å (see Mohanty & Basri,, 2003); we provide individual limits in Table Chromospheric Activity, Rotation, and Rotational Braking in M and L Dwarfs. We convert the measured H equivalent width into H flux by measuring the flux per unit equivalent width from the continuum flux in synthetic PHOENIX spectra (Allard et al.,, 2001, we used the DUSTY models). This is the same as using a “ factor” as done by Walcowicz et al., (2004) to translate equivalent widths into according to . Walcowicz et al., (2004) used observed spectra to calibrate and expressed it in terms of colors. Here, we use effective temperature from the models and measure the value of between 1200 and 4000 K. To find the temperature of our targets, we used the spectral types and calculated according to the conversion given in Golimowski et al., (2004). Our calibration of is plotted in Fig. 2 together with a fifth order polynomial fit (grey line)
| (1) |
The parameters of the fit are shown in Table 2. The equivalent widths and the values of for our sample L dwarfs are given in the last two columns of Table Chromospheric Activity, Rotation, and Rotational Braking in M and L Dwarfs.
3.3. Rotation Velocity
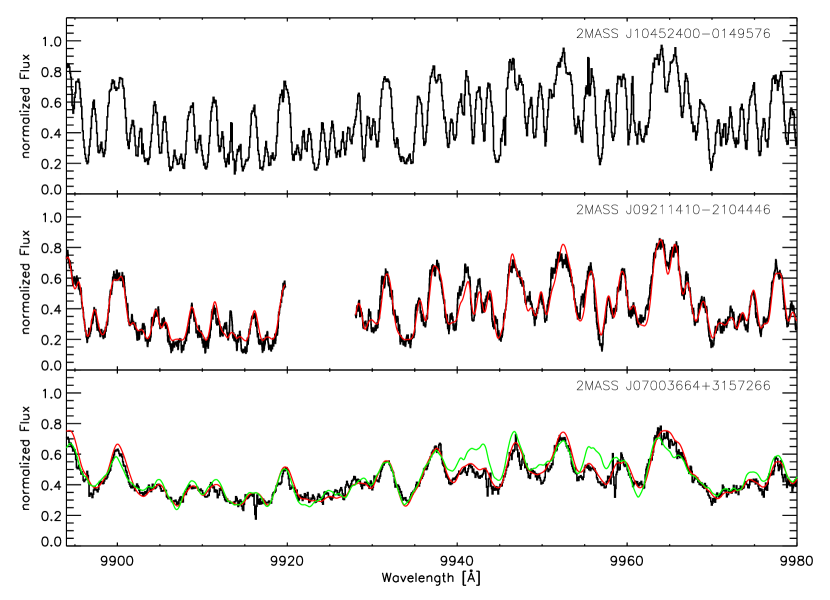
For the analysis of rotation velocities in our L dwarf sample, we follow the same strategy as in Reiners & Basri, (2007). We adjust the absorption depth in a template spectrum according to a curve-of-growth scaling procedure, and then artificially broaden this spectrum, searching for the best fit to the target spectrum. We employ the absorption band of FeH close to 1 m for the fitting procedure. As shown in Reiners & Basri, 2006b , this region is particularly rich in structure in ultra-cool stars and brown dwarfs, while it is also virtually free of telluric absorption. The absorption band of molecular FeH is not pressure-broadened and it is embedded in a relatively clear continuum, at least in the late M and early L dwarfs. This is a marked difference to most other spectral regions in M- and L-dwarf spectra, since most of their absorption features are either poor in structure (e.g., dense molecular bands of TiO and VO) or heavily pressure broadened (e.g., lines of alkali atoms), so that slow rotation is difficult to detect in them.
In Reiners & Basri, (2007), we used mid-M stars as templates to fit the FeH bands searching for rotational broadening. The depth of the absorption band of the M dwarf spectra was scaled using a curve-of-growth scaling (Reiners & Basri, 2006b, ). With this approach we do not need a slowly rotating template star of each spectral type, rather we require only one slowly- rotating template star. As a very first step, we applied the same fitting procedure using an M dwarf template to our L dwarf spectra. We found that the overall fit quality is still quite acceptable, and that the scaled M dwarf template already provides very useful results for the values of among the L dwarfs. However, the FeH band is already somewhat saturated at spectral type L0, and the scaling procedure becomes sensitive to the right choice of the maximum absorption depth and the placement of the continuum in the M dwarf spectrum. Thus, it is much better to use a spectrum of an L dwarf as a template instead of scaling the spectrum of an M dwarf showing much weaker FeH absorption.
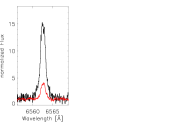
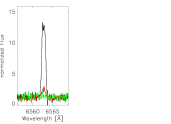
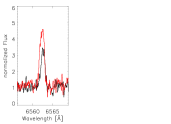
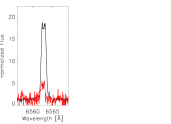
In our first attempt to derive projected rotation velocities using the M dwarf template, we found that among the 45 L dwarfs of our sample, one object showed much narrower lines than all the others. The L1.0 dwarf 2MASS104501 does not exhibit any sign of extra broadening when compared to a scaled spectrum of a slowly rotating M dwarf, i.e., it has a value of below our detection limit. We estimate our detection limit to be km s-1 as in Reiners & Basri, (2007). There we show that rotational broadening of km s-1 can marginally be detected in spectra of this quality (the detection limit is set by the spectral resolution of the data). We show a part of the FeH band in 2MASS104501 in the top panel of Fig. 1. Although many lines are strongly saturated, many sharp spectral features are still visible.
With a slowly rotating L dwarf in hand, our fitting process is more robust because it suffers much less from spectral mismatch. We measure in all other L dwarfs by fitting a scaled version of the spectrum of 2MASS104501 to the target spectra. To control instrumental effects, we took spectra of 2MASS104501 with both instruments, one with HIRES and one with UVES. In all L dwarfs shown in this paper, a good fit was achieved in the sense that the difference between the target spectrum and the artificially broadened and scaled template spectrum of 2MASS104501 was on the order of the noise in the data. Examples of the fit quality are shown in the center and bottom panels of Fig. 1. The rich structure of the FeH band also gives a good sense of the fit quality since remarkable features appear in all spectra even at high rotation.
Projected rotation velocities are given in the fourth column of Table Chromospheric Activity, Rotation, and Rotational Braking in M and L Dwarfs. We estimate our uncertainties to be of the same order as our detection limit in slow rotators, i.e., km s-1. This is probably too small in cases of very rapid rotation when the spectral features become smeared out. We checked the achieved fit quality in each object, from which we estimate a conservative relative uncertainty of % in the rapidly rotating L dwarfs. We do not provide the formal uncertainties from the (or 4) values because in most cases they lead to very low uncertainties (a few hundred m/s). This is because the main source of mismatch between data and fit is of a systematic nature rather than purely statistical. Our more conservative estimate relative uncertainty of is always well beyond the formal uncertainties. We note that even in the cases of strong saturation our scaling method provides a very good match to the data (see Fig. 1).
In three cases, the fitting process yields uncertainties larger than 10 %. The data of 2MASS0913+18 (L3.0) and 2MASS0825+21 (L7.5) suffer from low SNR. In the latter, fitting is particularly difficult because the FeH band becomes strongly saturated in the late L-dwarfs, and dust becomes an issue in such cool objects. This problem also arises in the (high SNR) spectrum of 2MASS0255+47 (L8.0). We estimate that the uncertainties in in these three objects are on a 20 %-level.
Our data set consists of three parts, (a) HIRES observations, (b) new UVES observations, and (c) UVES archive data. From our sample of 45 L dwarfs, 14 are contained in two of the three subsets, and one object (2MASS074620) was observed in all three campaigns. In almost all cases, the projected rotation velocities derived from different spectra very accurately match each other, i.e. the difference is lower than 2 km s-1. For the stars with more than one measurement, we give the mean of the different measurements in Table Chromospheric Activity, Rotation, and Rotational Braking in M and L Dwarfs. This is also the value used in Fig. 8.
The only exceptions with differences between different spectra appear for 2MASS150613 (L3, and km s-1), and for 2MASS150716 (L5, and km s-1).
For 2MASS150613 we possess one spectrum taken with HIRES (24 km s-1) and a second spectrum taken during our UVES campaign (15 km s-1). Both spectra have rather high SNR and we feel confident that the result from each individual fit are within the above mentioned uncertainties. Thus, the spectra yield significantly different results on rotational broadening on the order of 5 km s-1. A detailed inspection of both spectra reveals that indeed there is a visible difference between the two spectra taken within only four weeks. We believe that this difference is due to the excellent seeing conditions during the UVES observation of 2MASS150613 – the one yielding the slower rotation velocity. Seeing conditions were reported at a level below 0.6″during that observation, while the slitwidth was 1″, which is on the order of the seeing conditions we usually achieved. Assuming that for the full observation the star was perfectly positioned in the slit, the effective resolution of this exceptional observation would be almost a factor of two higher than expected, leading to narrower instrumental broadening and thus to a smaller rotational velocity. We think that the exceptional quality of the seeing can fully explain the difference compared to the result calculated from the HIRES spectrum.
In the second case of different ’s, 2MASS150716, we possess two UVES spectra, one from our observation and one from the archive. In this case, the two values ( and km s-1) are still marginally consistent and we see no obvious differences between the spectra. Hence the difference is probably of purely statistical nature (within the 1-sigma overlap of the error bars). Together with the 13 other objects in which the results from different spectra (and different instruments) are within only 2 km s-1, we feel very confident that instrumental effects play no major role, and that our results are indeed within the estimated uncertainties.
3.3.1 Comparison to literature
Bailer-Jones, (2004) measured the projected rotation velocity in a sample of L dwarfs by applying the cross correlation method (no measurements of the H line are given). We re-analyzed the data after reduction of the raw data that we took from the ESO science archive, applying the same strategy we used for our HIRES- and UVES-data. H measurements are given here for the first time. We first performed a cross-correlation analysis following the method employed by Bailer-Jones, (2004, we chose to use only the FeH band that was also contained in their analysis) in order to check differences due to our new reduction of the data. We find that our results from the cross- correlation analysis are fully consistent with the results given in Bailer-Jones, (2004).
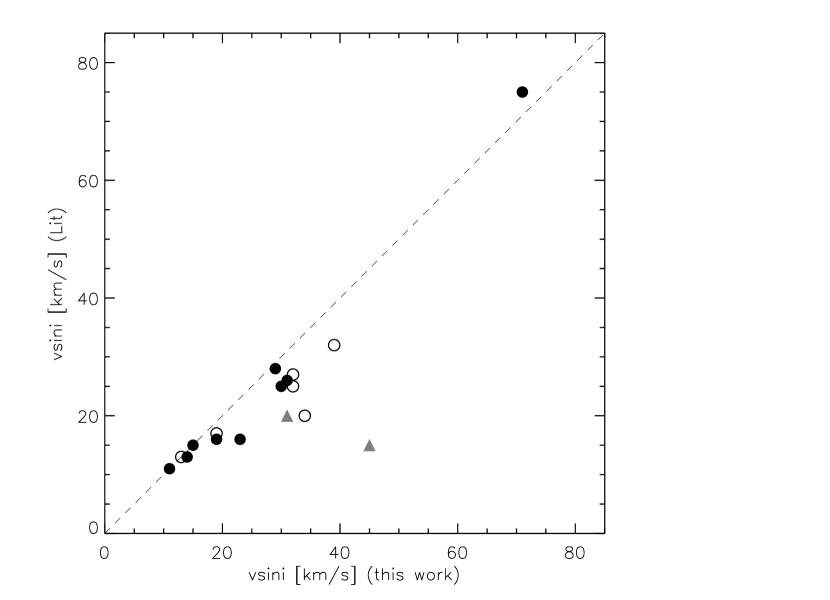
Next, we calculated the rotational velocities with our fitting procedure. We compare the new results to the ones from the analysis of Bailer-Jones, (2004) in Fig. 3. The results are comparable at slow rotation ( km s-1) and also in the most rapid rotator (80 km s-1). Between these points, between 20-45 km s-1, there are several objects for which the cross-correlation yields smaller rotation velocities than the direct fitting procedure does. We argue that our method yields the more reliable results and we attribute the differences to the two important improvements in our analysis: (a) we could use a slowly rotating L1 object as a template, and (b) we used a well-known spectral range with intrinsically narrow spectral lines in which we account for the scaled depth of all absorption lines.
Mohanty & Basri, (2003) measured activity and rotation in mid-M to L field dwarfs, and Zapatero Osorio et al., (2006) measure rotation in M, L and T dwarfs. We have 4 objects in common with the sample of Mohanty & Basri, (2003): 2MASS1439+19, 2MASS1305-25 (Kelu-1), 2MASS0004-40 (LHS102B), and 2MASS0255-47 (DENIS0255-4700, L8). Rotation velocities of the first three objects are consistent within the uncertainties. However, our result for the L8 object 2MASS0255-47 of km s-1 is much larger than the result reported in Mohanty & Basri, (2003) of km s-1. The sample of Zapatero Osorio et al., (2006) has three objects in common with our sample, 2MASS0036+18 (L3.5), and 2MASS2224-01 (L4.5), and also 2MASS0255-47. Again, the results for the two mid-type L dwarfs are consistent. However, Zapatero Osorio et al., (2006) also report km s-1 for 2MASS0255-47. This object is the coolest in our sample, and our template spectrum may not provide as good a match to the spectrum of 2MASS0255-47 as it does in earlier objects. In late-L dwarfs, the depth of the FeH band is much weaker than in earlier L dwarfs probably due to the presence of dust. In this case, it is difficult to disentagle the effects of saturation and rotational broadening. Nevertheless, a careful inspection of the fit quality in 2MASS0255-47 shows that in our data a clear minimum in appears around of 60–70 km s-1, and that km s-1 provides a much worse fit in the FeH band. Mohanty & Basri, (2003) and Zapatero Osorio et al., (2006) used templates of spectral types M5.5, M8, and T6.5 to determine . We believe that our analysis is probably more reliable because we tried to match the line depths according to the target spectrum, and because our template spectrum still is more similar to an L8 spectrum than mid-M or late-T dwarf spectra are.
Schweitzer et al., (2001) fitted model spectra to alkali lines of late-M and early-L dwarfs measuring , , and . Two of their targets are also in our sample. Schweitzer et al., (2001) measured km s-1 for 2MASS074620 for which we found km s-1. For 2MASS003618 they report km s-1, our value is km s-1. The two objects are also plotted in Fig. 3; a significant discrepancy exists between our values and the ones measured by Schweitzer et al., (2001). We believe that this is due to mismatches between the observed spectra and the models used in their analysis. Fitting the heavily broadened alkali lines in such cool objects is a problem, because pressure broadening as well as the influence of dust is not fully understood (see, e.g., Johnas et al.,, 2008; Reiners et al., 2007b, ).
4. Stars with Variable H Emission
The sample of high resolution spectra we analyze in this paper is taken from two different observatories obtained during several observing runs. The goal was to obtain as many high quality L dwarf spectra as possible, and to get multiple epochs in some of them. We can investigate time variability of objects for which we have multiple observations; 15 objects were observed more than once, one object was observed three times. In Table 3, we list observations of the 8 targets that show significant variability in H. This observed fraction implies that in this very heterogeneous sample the variability of L dwarfs is . Fig. 4 displays the most obvious cases of variable H emission, probably related to flaring.
5. Results
5.1. Activity
We plot the normalized H luminosities as a function of spectral types in Fig. 5. Results from our new observations are shown in the left panel. In the right panel, we show them together with the data from Delfosse et al., (1998), Reiners & Basri, (2007), and Mohanty & Basri, (2003). We have four objects in common with the sample of Mohanty & Basri, (2003), in none of the four did we detect H emission, while Mohanty & Basri, (2003) did detect H in 2MASS000440 (LHS 102B).
H emission appeared in 31 of the 61 spectra (51 %) that we took in 45 stars. 23 of the 45 () objects show H in emission in at least one spectrum. For one of them we also possess a spectrum in which H emission was below the detection level. In agreement with Mohanty & Basri, (2003), West et al., (2004), and Schmidt et al., (2007), we find that the normalized H luminosity is decreasing with later spectral type. This effect is likely due to the growing neutrality of cool dwarfs’ atmospheres (Mohanty et al.,, 2002). Nonetheless, activity and flaring events were also found in mid-type L-dwarfs: Mohanty & Basri, (2003) observed H emission in high resolution spectra of objects as late as L5 (contained in this analysis and included in the right panel of Fig. 5). Hall, (2002) and Liebert et al., (2003) found H emission in the L5 dwarfs 2MASS J1315309264951 and 2MASS J01443536071642, respectively. Other tracers also indicate that L dwarfs are capable of generating activity. For example, radio emission was detected in two L dwarfs, 2MASS052314 (L2.5) and 2MASS003618 (L3.5, Berger,, 2006).
In Fig. 6, we show the fraction of active objects per spectral type bin from L0 to L5. Our high resolution L dwarf data is combined with the sample of Mohanty & Basri, (2003), who used data of comparable quality around the H line. The total number of objects per spectral bin is indicated next to the points in the plot. Fig. 6 confirms that the (measured) fraction of active objects decreases towards cooler temperatures. This plot can be compared to Fig. 1 in West et al., (2004) and to Fig. 5 in Schmidt et al., (2007). In both papers low resolution data was used, and the detection limit of H emission is lower than in our data. Our results show fractions that are 10–20 % higher than the ones from West et al., (2004) and Schmidt et al., (2007) in all spectral bins. We conclude that low levels of H activity are probably generated by the majority of L-dwarfs, and with higher detection sensitivity the observed fraction of active stars becomes higher.
Mohanty & Basri, (2003) find a very sharp difference in activity between M stars up to spectral type M9 and cooler objects, i.e., normalized H luminosities drop about two orders of magnitude around a spectral type of M9 (see also Liebert et al.,, 2003). Our larger sample shows that this was a selectional bias and not a physical effect. We clearly see that gradually decreases from mid-M to mid-L spectral types, and that no sudden break occurs.
5.2. Activity and Age
In Sun-like stars, activity is strongest when stars are young and rotating most rapidly. During their evolution, rotation is braked and the level of activity decreases over time. Do the same mechanisms also work in mid-M and L-dwarfs, which are certainly fully convective? Much less is known about the mechanism generating the presumably required magnetic fields or the way they are converted into atmospheric heating via dissipative mechanisms, and then to a braking torque by a magnetic wind. In order to investigate the dependence of H emission on age, we employ the measurements of tangential velocity given in Schmidt et al., (2007). For objects of our sample that are contained in that work, we give the values of in the last column of Table Chromospheric Activity, Rotation, and Rotational Braking in M and L Dwarfs.
Although tangential velocity does not capture the full space motion, it is a convenient measure which provides a preliminary picture for the statistical investigation of a large sample. In general, young stars have very low total space velocity (e.g., Chiba & Beers,, 2000) and any detection of motion on the order of, say, 30 km s-1 indicates that the object is probably not a member of the young population. For a deeper investigation of the velocity distribution, we must measure radial velocities from our data and calculate space motions, which we plan to do in a separate paper.
We plot the distribution of tangential velocities in active and inactive (no H detection) objects in the left and right panels of Fig. 7, respectively. Both distributions cover the entire range between and 100 km s-1. The most obvious difference is that 6 objects with detected H emission have values of km s-1, while none of the “inactive” objects has such a low tangential velocity. The majority of the active objects are in the lower half of observed tangential velocities as well. We performed a -test on the two distributions asking whether both distributions could be due to the same underlying population. We find that the hypothesis of identical underlying distributions can be rejected only at a 1-level (the probability that two observations of the same distribution yield larger differences than our is 19 %). Thus, although the lack of “young” inactive stars is suggestive, it is not statistically significant in our sample.
Another way of investigating stellar activity is by measuring radio emission, which is believed to be generated through gyrosynchrotron emission in the presence of strong magnetic fields. Radio observations in L dwarfs were carried out by Berger, (2006), who found radio emission in the two L-dwarfs 2MASS052314 (L2.5) and 2MASS003618 (L3.5). Both objects are contained in our sample: 2MASS052314 is kinematically young and shows H emission, but we do not detect H emission in the kinematically old object 2MASS003618. The detection of radio and H emission in 2MASS052314 supports the idea that both are generated via the same mechanism but 2MASS003618 does not. Berger et al., (2005) investigated this object in a multi-wavelength campaign; they detected neither H nor X-ray emission. They concluded that the atmospheric conditions in L dwarfs are markedly different from early-type stars and even M dwarfs, which show a well-defined X-ray/radio correlation. Berger et al., (2005) also found a periodicity in the radio emission of 2MASS003618 of 3 h, which would mean a rotation velocity of km s-1 – we find km s-1. Given the large uncertainties in the radius determination, both values are still consistent with each other, but indicate that if the radio period is indeed due to rotation, the object is seen at high inclination.
5.3. Rotation
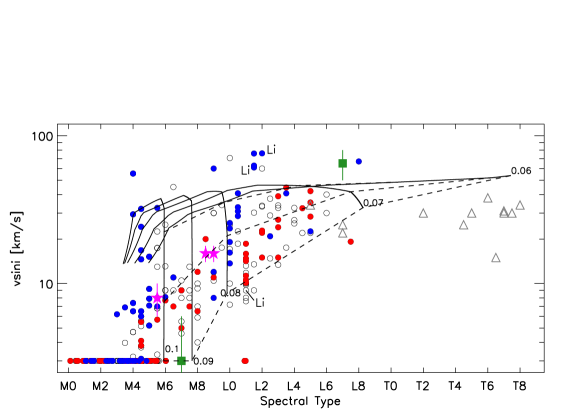
The projected rotation velocities of our sample are shown as a function of spectral type in Fig. 8. For 27 L dwarfs, is reported here for the first time. In Fig. 9 we show our data together with data available from the literature (Delfosse et al.,, 1998; Mohanty & Basri,, 2003; Reiners & Basri,, 2007). We augment the plot by results from Reiners & Basri, 2006a who investigated two presumably very old late M- and L-type subdwarfs, LSR 16100040 (d/sdM7) and 2MASS05328246 (sdL7, spectral types from Burgasser et al.,, 2007). No significant rotation was found in the M7 object LSR 16100040, but the L7 subdwarf 2MASS05328246 still shows very rapid rotation of km s-1. We plot these objects as squares (including uncertainties) in Fig. 9. Both results are consistent with the lower envelope of minimum rotation visible in that Figure, providing a strong argument for the lack (or weakening) of rotational braking in cooler objects, even if they are very old. At a minimum, therefore, spindown times become very long for very cool objects. We also add the three components of the triple system LHS 1070 (Reiners et al., 2007a, ). The system consists of two ultra-cool M8/M9 objects rotating at identical rotation speed and a more massive M5.5 component that rotates significantly more slowly. These three objects are plotted as stars.
We plot the “young” sample as blue symbols in Fig. 9, the “old” sample is shown with red symbols. Objects for which no age information is available are shown as open symbols. Clearly, the upper left quadrant of Fig. 9 is occupied by the “young” sample while near the envelope of minimum rotation velocity objects of the “old” sample predominate. The two presumably very old sub-dwarfs and the three components of LHS 1070 also follow this trend. There is no indication that our sample lacks old objects, and it shows that the lack of slowly rotating L dwarfs is real.
The lower envelope of (projected) rotation velocities describes minimum rotation close to zero at spectral type M5, km s-1 at L0, and around 20 km s-1 at spectral type L5. Zapatero Osorio et al., (2006) measured rotation velocities in T dwarfs at lower spectral resolution. Their data show the same trend of higher minimum rotation velocities at later spectral type. Among the T dwarfs, Zapatero Osorio et al., (2006) found projected rotation velocities around 30 km s-1. This result suggests that the envelope of lower limits to rotation may flatten in the T dwarfs, and the lack of more rapid rotators would be a change if confirmed in a larger sample. We are quite skeptical about a comparison of rotational velocities from very different spectral resolutions, however, and would not put much stock in either conclusion for now.
It is important to realize that although we can measure only the projected rotation velocity, real rotation velocities can only be higher – not lower. Hence the effect of detecting only rapid rotators among the L dwarfs is certainly not due to a projection effect. The only exceptionally slow object among the rapidly rotating L dwarfs is 2MASS104501. In that object, we did not detect any rotational broadening. We cannot say whether this is due to a projection effect or if 2MASS104501 is indeed a slow rotator. To find only one object at very low inclination, however, is fully consistent with the assumption that all L dwarfs in our sample are rapid rotators.
5.3.1 Rotational evolution of L dwarfs
L dwarfs significantly cool during their evolution, so that L dwarf evolutionary tracks in a rotation/temperature (or /spectral type) diagram do not translate into vertical lines (as for hotter stars with essentially constant temperature). Brown dwarfs gravitationally contract during their whole lifetime, and hence continuously diminish their moment of inertia, leading to rotational acceleration (although most of this occurs in the first Gyr).
Zapatero Osorio et al., (2006) have calculated the effects of acceleration by contraction and they find a picture that is qualitatively consistent with their rotation velocities. They do not allow for any wind braking; their calculations start at a rotation velocity of 9 km s-1 at an age of 1 Myr. In this scenario, low-mass objects are starting as slow rotators. They gain angular momentum through contraction and accelerate as they age. Thus, only very few (extremely young) slow rotators would be observed while many more rapid rotators could be expected among the (old) field objects. Slowly rotating L dwarfs would be young but of very low mass, which could explain the rising slope of minimum rotation velocity among the field objects. However, one feature of this scenario is that all old objects are more rapidly rotating! We can exclude this prediction from the fact that we observe rapid rotators to be preferentially young, and that the lower envelope of the slowest rotators per spectral type is occupied by old objects (Fig. 9).
If we assume that rotational braking in L dwarfs is similar to wind braking in more massive stars, the wind braking law in low-mass objects appears to be less effective than in early-M stars. The fact that in Fig. 9 rotational evolution apparently goes from young rapid rotators to old slow rotators strongly suggests net rotational braking instead of net acceleration. In the following, we search for a scenario to explain the main ingredients of Fig. 9. The main features are a) the shape of the lower envelope of minimum rotational velocities with higher minimum rotation at later spectral type, b) the distribution of rotation velocities among the young and the old populations, c) the rotation velocities of the three (coeval) members of LHS 1070, and d) the two presumably old sub-dwarfs. To explain the net rotational braking, we need to introduce a braking law, and the rising slope of minimum rotational velocities suggests that this braking law is mass-dependent.
For the form of the braking law, we follow the models of Chaboyer et al., (1995) and Sills et al., (2000). The angular momentum loss is assumed to be proportional to some power of the angular velocity (Mestel,, 1984; Kawaler,, 1988). This power law depends on the magnetic field geometry. Chaboyer et al., (1995) and Sills et al., (2000) give a prescription for the wind-braking law if the angular velocity is higher than a critical angular velocity (this was required mainly to explain angular momentum loss in the pre-main sequence, see Chaboyer et al.,, 1995, and references therein).
| (2) |
The critical velocity is thought to be the value where the rotation period becomes much smaller than the convective overturn time, i.e., . In early-M stars, this happens at relatively low rotation velocities on the order of a few km s-1. In late-M and L dwarfs, critical velocities are even lower because quickly grows larger at lower masses. Hence our objects are probably all rotating faster than critical. Sills et al., (2000) use a scaling of with mass as introduced by Krishnamurti et al., (1997):
| (3) |
with the convective overturn timescale. The mass dependence of angular momentum loss follows from observations in open clusters and could possibly be explained by mass-dependent magnetic topologies due to different magnetic field generation mechanisms. As a first approximation for the convective overturn timescale , we assume (cp Reiners & Basri,, 2007). We calculate rotational braking in low-mass objects taking into account contraction and a wind-braking law as introduced above. We take the radii from evolutionary tracks of Baraffe et al., (1998) and Chabrier et al., (2000), conversion from temperature to spectral type was done using the calibration of Golimowski et al., (2004). For our model, we assume that rotational evolution starts at an age of 5 Myr (about the age where disk-locking ends; Strom et al.,, 1989). All our test objects start with rotation velocities of 10 km s-1, which is motivated by the projected rotation velocities in low-mass stars and brown dwarfs observed during their T Tauri phase (Mohanty et al., (2005), see also Basri, (2002)). Calculating the rotational evolution for this simple case we indeed find more rapidly rotating stars at later spectral classes; at a given age, very low mass objects are not as strongly braked as the heavier objects. However, such braking would still be strong enough to decelerate all objects to essentially zero rotation after 10 Gyrs, which clearly is not observed.
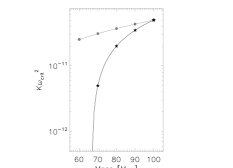
In order to reproduce the observed situation, we adjust the scaling of as a function of mass. In the framework of the wind-braking law, this can be achieved by scaling the convective overturn time (Eq. 3). We emphasize, however, that it is not necessarily the overturn time itself that governs the braking amplitude – it is rather the resulting effect on the net braking which is different (the value of may change as well). In the left panel of Fig. 9, we show such a scenario for rotational braking in ultracool dwarfs. Solid lines indicate cooling sequences for objects of 0.07–0.10 M☉. Dashed lines mark isochrones at 1 and 10 Gyr. The right panel in Fig. 9 shows our choice of as a function of mass. Asterisks show the values employed to calculate the evolutionary tracks in the left panel of Fig. 9. Grey points connected by a straight line indicate a scaling according to . Our scaling of follows the relation
| (4) |
The braking law used in Fig. 9 provides a remarkable similarity to the observed situation. Young low mass objects start at intermediate rotation rates and accelerate during the first few tens of millions of years. Then, mass dependent wind braking causes deceleration until they either lose most of their angular momentum at an age of several ten million years (stars more massive than 0.09 M☉), or the braking is so weak that until today even the oldest objects have not lost all their angular momentum (objects less massive than 0.09 M☉). From the evolutionary tracks, one can also predict ages and mass of the objects at least in a statistical sense. Without going into further detail we note that for the masses of the three members of LHS 1070 (stars in Fig. 9) relatively accurate predictions are achieved; masses from the orbital solution are 0.12 M☉ for component A (M5.5) and 0.079 M☉ for components B and C (Seifahrt et al.,, 2007).
In evaluating our braking law, we have not included the observations of in T dwarfs (triangles in Fig. 9). They appear to rotate somewhat more slowly than the late-L dwarfs. This can either be due to a different distribution of initial rotation velocities (i.e. differences during their formation mechanism), or due to stronger braking reappearing in the mass regime below 50–60 MJup. As mentioned above, we are also skeptical about a comparison between our data and the T dwarf velocities due to systematic differences in the data (resolution) and their analysis.
So far, we have described a braking law dependent on mass, which is the most fundamental stellar parameter. Atmospheric properties, however, are not necessarily connected to mass, but are more closely connected to temperature (and gravity). This is especially important in brown dwarfs, since effective temperature changes a lot during their evolution (while mass is a constant). Therefore, we consider the effect of choosing as a function of temperature. We searched for such a scaling law to see whether it could explain the observed distribution of rotational velocities. The best match we found is shown in Fig. 10; evolutionary tracks integrated over are shown in the left panel, and is shown in the right panel. This model also does a good job of reproducing the lower envelope of rotational velocities, and it does a slightly better job with the extrapolation to the T dwarfs (but see above). Such a braking law has an easy physical explanation in the growing atmospheric neutrality at very cool temperatures, and its effect on coronal heating through diminished ability of the atmosphere to produce magnetic dissipation (Mohanty et al.,, 2002). A scatter (we assumed one constant value) in the initial distribution of rotational velocities could generate the high rotation rates observed in some young objects. If the slower velocities in the T dwarfs were confirmed, slightly more efficient braking at cool temperatures would be needed.
The main result of this section is that rotational evolution according to a wind-braking law that scales with temperature can reproduce the main features of rotational braking in L dwarfs. A very similar result can be achieved with a law that depends on mass (through convective overturn time as a proxy, with unclear physical meaning). In both cases, very low-mass, cool objects must brake less efficiently. A very interesting consequence of both models is that the lower envelope of minimum rotation velocities is directly coupled to the age of the Galaxy: the objects simply haven’t had enough time to decelerate any further.
5.4. The Connection between Rotation and Activity
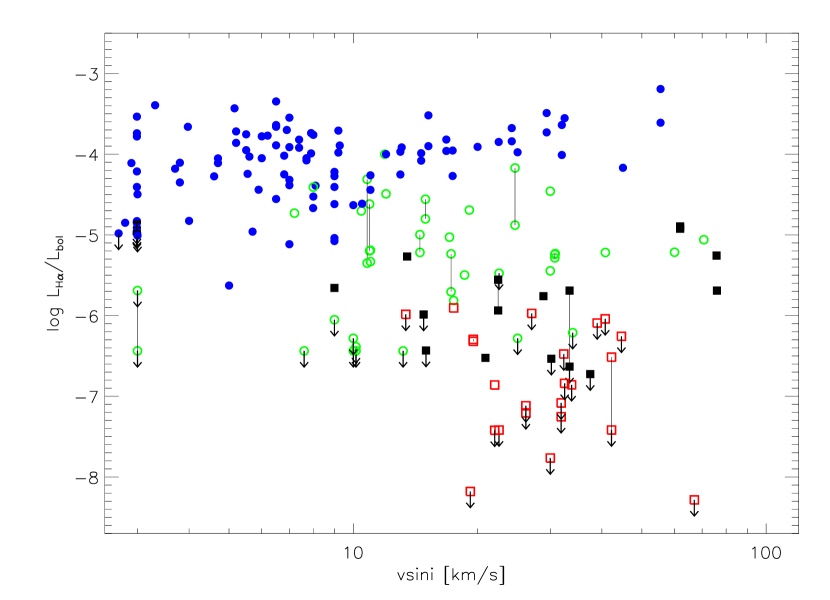
A breakdown of the rotation-activity connection known among solar-type stars was noted at spectral type M9 by Mohanty & Basri, (2003). They find a saturation-type rotation-activity connection among M dwarfs cooler than spectral type M4, and they report that such a relation no longer exists in their sample of L dwarfs. We can now verify this conclusion in our larger sample. In Fig. 11, we show normalized H luminosity as a function of for our sample. We use different symbols for different temperatures. Multiple observations of the same star are connected with solid lines and upper limits in are marked with downward arrows. A potential rotation-activity connection would best be visible among objects of similar spectral type. That means looking, for example, for open circles arranged in a pattern.
The well known rotation-activity relation among the M dwarfs (filled circles) shows a -shaped behavior: A large scatter appears in in stars below the rotational detection limit, while among the rapid rotators normalized H luminosity is always very high. Among the L dwarf subsamples, however, we do not observe anything similar. The three L dwarf subgroups are different in their mean level of normalized H luminosity, but they do not show any dependence on . We find no rotation-activity relation among the L dwarfs, in particular we do not see an obvious connection between rotation and activity within the plotted spectral type subgroups. One possibility is that since all the L dwarfs are rapidly rotating, they are all in the rotationally saturated regime for magnetic field, while the atmospheric heating decreases with temperature due to the neutrality effect.
An alternative way to search for a connection between rotation and activity is to compare the distributions of active and inactive stars as a function of rotation velocity. This is done in Fig. 12 where we plot the distribution among L dwarfs with detected H emission and without H detection in the left and right panels, respectively. We do not see an obvious difference between the two distributions. A -test shows that the probability to draw two samples from one and the same underlying distribution and finding differences larger than between the two observed here is 50 %. Thus, there is no indication for a difference between the two sub-samples. We conclude that rotation velocity is probably no longer connected to activity observed in H among the L dwarfs.
It is important to note that if L dwarfs are rotationally braked during their lifetime, but activity does not scale with rotation, this implies that no correlation between H and age can be expected due to rotational braking.
6. Summary
We have analyzed high resolution optical spectra of a comprehensive L dwarf sample. From 61 spectra of 45 objects we measured the projected rotation velocity and H emission as an indicator for chromospheric activity.
Half of our sample objects show activity in at least one spectrum. The logarithmic normalized H emission, , follows a smooth trend with lower activity at later spectral types. The decrease of chromospheric activity sets in around spectral type M5 (see also West et al.,, 2004); it connects smoothly to the average value of in early M dwarfs. The fraction of L dwarfs with detected H emission also decreases towards later spectral types. This is consistent with the results from West et al., (2004) and Schmidt et al., (2007), but our fraction is somewhat higher than theirs, probably because of the higher sensitivity of our data. Activity is observed in objects as late as L5. We did not find H emission in the 2 L dwarfs of very late spectral type.
For 15 objects we possess more than one spectrum; 8 of them show variable H emission. We consider this variability as a sign of robust flaring activity among L dwarfs. This means that flaring activity is a common process among (early) L dwarfs. The fraction of variable objects () among objects with more than one observation is almost identical to the fraction of active objects () in the full sample. Our data is consistent with the assumption that all active L dwarfs are variable.
Our rotation velocities add substantially to the available rotation measurements in brown dwarfs. Between spectral types M7 and L8, objects of later spectral type rotate faster than earlier-type objects. Minimum (projected) rotation velocities are about 5 km s-1 at spectral type L0 and about 20–30 km s-1 at spectral type L6. One L1 dwarf shows no measurable rotation, which we attribute to low inclination. This object allows us to measure rotations using a template spectrum of a non-rotating L dwarf.
We have excluded the possibility that the lack of slowly rotating rotating L dwarfs is an observational bias by investigating the age-distribution of the objects using primarily tangential velocities. We suggest that the distribution of rotation velocities is probably induced by mass-dependent rotational braking with weaker braking at lower temperatures. We find remarkably good agreement between the observed distribution of rotational velocities and predictions from a wind-braking model similar to models applied to higher mass stars (with the caveat that high initial angular momentum is required). In our model, braking scales with temperature, perhaps due to decreasing magnetic dissipation, although another mass-dependent law can work as well.
Another physical explanation that has been offered is the possibly changing magnetic topology in low mass objects. Durney et al., (1993) suggested that fully convective dynamos might produce predominantly small scale fields, leading to weaker rotational braking than large-scale fields generated in sun-like stars can produce. This suggestion has now run afoul of both observations (Donati et al.,, 2006) and theory (Dobler et al.,, 2006; Browning,, 2007). It does seem that something happens in angular momentum evolution near the fully convective boundary; that is where measurable Doppler rotation begins to reappear in a reasonable fraction of stars. The question is whether that is coincidental or not. The real effects of temperature-induced neutrality don’t kick in until several spectral sub-classes later, so it may be that there is more to the full picture than that.
We have searched for a rotation-activity connection among L dwarfs. While normalized H activity is decreasing with later spectral type, no trend with rotation is visible among subgroups of comparable spectral types. One reasonable explanation is that the field generation may be saturated because of the rapid rotations, or the conversion of fields to excess emission is different or more unstable. It is not yet clear how magnetic fields behave on L dwarfs, nor how they are converted into H, X-ray, or radio-emission excesses. This should be a fertile area for research in the next few years.
References
- Allard et al., (2001) Allard, F., Hauschildt, P.H., Alexander, D.R., Tamanai, A., & Schweitzer, A., 2001, ApJ, 556, 357
- Bailer-Jones, (2004) Bailer-Jones, C.A.L., 2004, A&A, 419, 703
- Baraffe et al., (1998) Baraffe, I., Chabrier, G., Allard, F., & Hauschildt, P.H., 1998, A&A, 337, 403
- Baraffe et al., (2003) Baraffe, I., Chabrier, G., Barman, T.S., Allard, F., & Hauschildt, P.H., 2003, A&A, 402, 701
- Barnes, (2003) Barnes, S.A., 2003, ApJ, 586, 464
- Barnes, (2007) Barnes, S.A., 2007, arXiv: 0704.3068
- Basri, (2000) Basri, G., 2000, ARA&A, 38, 485
- Basri, (2002) Basri, G., 2002, IUA Symp. 215, p. 248, eds. Maeder, A., & Eenens, P.
- Berger et al., (2005) Berger, E., et al., 2005, ApJ, 627, 960
- Berger, (2006) Berger, E., 2006, ApJ, 648, 629
- Browning, (2007) Browning, M.K., 2008, ApJ, 676, 1262
- Burgasser et al., (2007) Burgasser, A., Cruz, K.L., & Kirkpatrick, J.D., 2007, ApJ, 657, 494
- Burrows et al., (1997) Burrows, A., et al., 1997, ApJ, 491, 856
- Chabrier et al., (2000) Chabrier, G., Baraffe, I., Allard, F., & Hauschildt, P.H., 2000, ApJ, 542, 464
- Chaboyer et al., (1995) Chaboyer, B., Demarque, P., & Pinsonneault, M.H., 1995, ApJ, 441, 875
- Chiba & Beers, (2000) Chiba, M., & Beers, T.C., 2000, AJ, 119, 2843
- Delfosse et al., (1998) Delfosse, X., Forveille, T., Perrier, C., & Mayor, M., 1998, A&A, 331, 581
- Dobler et al., (2006) Dobler, W., Stix, M., Brandenburg, A., 2006, ApJ, 638, 336
- Donati et al., (2006) Donati, J.F., Forveille, T., Cameron, A.C., Barnes, J.R., Delfosse, X., Jardine, M.M., Valenti, J.A., 2006, Science, 311, 633
- Durney et al., (1993) Durney, B.R., DeYoung, B.S., Roxburgh, I.W., 1993, Sol. Phys., 145, 207
- Gizis et al., (2001) Gizis, J.E., Kirkpatrick, J.D., Wilson, J.C., 2001, AJ, 121, 2185
- Golimowski et al., (2004) Golimowski, D.A., Leggett, S.K., Marley, M.S., et al., 2004, AJ, 127, 3516
- Hall, (2002) Hall, P.B., 2002, ApJ, 564, L89
- Hallinan et al., (2006) Hallinan, G., Antonova, A., Doyle, J.G., Bourke, S., Brisken, W.F., & Golden, A., 2006, ApJ, 653, 690
- Herbst et al., (2007) Herbst, W., Eislöffel, J., Mundt, R., & Scholz, A., 2007, Protostars and Planets V, B. Reipurth, D. Jewitt, and K. Keil (eds.), University of Arizona Press, Tucson, 951 pp., 2007., p.297-311
- Johnas et al., (2008) Johnas, C.M.S., Helling, Ch., Dehn, M., Woitke, P., & Hauschildt, P.H., MNRAS, 385, L120
- Kawaler, (1988) Kawaler, S.D., 1988, ApJ, 333, 236
- Krishnamurti et al., (1997) Krishnamurti, A., Pinsonneault, M.H., Barnes, S., & Sofia, S., 1997, ApJ, 480, 303
- Liebert et al., (2003) Liebert, J., Kirkpatrick, J.D., Cruz, K.L., Reild, I.N., Burgasser, A., Tinney, C.G., & Gizis, J.E., 2003, AJ, 125, 343
- Marcy & Chen, (1992) Marcy, G.W., & Chen, G.H., 1992, ApJ, 390, 550
- Mestel, (1984) Mestel, 1984, in Third Cambridge Workshop on Cool Stars, Stellar Systems, and the Sun, ed. S.L. Baliunas & L. Hartmann (New York: Springer), 49
- Mestel, (1999) Mestel., L., 1999, Stellar Magnetism, International Series of Monographs on Physics 99, Oxford Science Publications
- Mohanty et al., (2002) Mohanty, S., Basri, G., Shu, F., Allard, F., & Chabrier, G. 2002, ApJ, 571, 469
- Mohanty & Basri, (2003) Mohanty, S., & Basri, G., 2003, ApJ, 583, 451
- Mohanty et al., (2004) Mohanty, S., Jayawardhana, R., & Basri, G., 2004, ApJ, 609, 885
- Mohanty et al., (2005) Mohanty, S., Jayawardhana, R., & Basri, G., 2005, ApJ, 626, 498
- (37) Reiners, A., & Basri, G., 2006a, AJ, 131, 1806
- (38) Reiners, A., & Basri, G., 2006b, ApJ, 644, 497
- Reiners & Basri, (2007) Reiners, A., & Basri, G., 2007, ApJ, 656, 1121
- (40) Reiners, A., Seifahrt, A., Siebenmorgen, R., Käufl, H.U., & Smette, Al., 2007a, A&A, 471, L5
- (41) Reiners, A., Homeier, D., Hauschildt, P.H., & Allard, F., 2007b, A&A, 473, 245
- Schweitzer et al., (2001) Schweitzer, A., Gizis, J.E., Hauschildt, P.H., Allard, F., & Reid, I.N., 2001, ApJ, 555, 368
- Seifahrt et al., (2007) Seifahrt, A., Röll, T., Neuhäuser, R., Reiners, A., Kerber, F., Käufl, H.U., Siebenmorgen, R., & Smette, A., A&A, in press, arXiv:0803.0628
- Schmidt et al., (2007) Schmidt, S.J., Cruz, K.L., Bongiorno, B.J., Liebert, J., & Reid, I.N., 2007, AJ, 133, 2248
- Sills et al., (2000) Sills, A., Pinsonneault, M.H., & Terndrup, D.M., 2000, ApJ, 534, 335
- Strom et al., (1989) Strom, K.M., Strom, S.E., Edwards, S., Cabrit, S., & Skrutskie, M.F., 1989, AJ, 97, 1451
- Walcowicz et al., (2004) Walkowicz, L.M., Hawley, S.L., & West, A.A., 2004, PASP, 116, 1105
- West et al., (2004) West, A.A., Hawley, S.L., Walkowicz, L.M., Covey, K.R., Silvestri, N.M., and 6 authors 2004, AJ, 128, 426
- West et al., (2008) West,A.A., Hawley, S.L., Bochanski, J.J., Covey, K.R., Reid, I.N., Dhtal, S., Hilton, E.J., Masuda, M., 2008, AJ, 135, 785
- Zapatero Osorio et al., (2006) Zapatero Osorio, M.R., Martín, E.L., Bouy, H., Tata, R., Deshpande, R., & Wainscoat, R.J., 2006, ApJ, 647, 1405
| Name | SpType | exp. time | S/N | |
|---|---|---|---|---|
| [mag] | [s] | |||
| Keck observations | ||||
| 2MASS J | L0.0 | 13.17 | 2700 | 20 |
| 2MASS J | L0.0 | 12.09 | 1200 | 20 |
| 2MASS J | L0.0 | 13.66 | 4200 | 15 |
| 2MASS J | L0.5 | 11.76 | 1800 | 25 |
| 2MASS J | L0.5 | 12.47 | 3600 | 30 |
| 2MASS J | L1.0 | 12.30 | 3000 | 15 |
| 2MASS J | L1.0 | 13.50 | 3600 | 15 |
| 2MASS J | L1.0 | 13.50 | 1800 | 15 |
| 2MASS J | L1.0 | 13.16 | 7200 | 20 |
| 2MASS J | L1.0 | 12.92 | 1800 | 20 |
| 2MASS J | L1.0 | 12.72 | 1800 | 25 |
| 2MASS J | L1.0 | 12.76 | 2000 | 25 |
| 2MASS J | L1.0 | 12.56 | 2100 | 15 |
| 2MASS J | L1.5 | 12.93 | 5100 | 45 |
| 2MASS J | L1.5 | 13.12 | 3600 | 25 |
| 2MASS J | L2.0 | 12.80 | 1200 | 20 |
| 2MASS J | L2.0 | 12.81 | 1800 | 15 |
| 2MASS J | L2.0 | 13.41 | 5700 | 30 |
| 2MASS J | L3.0 | 13.37 | 3600 | 20 |
| 2MASS J | L3.0 | 13.84 | 3600 | 15 |
| 2MASS J | L3.5 | 12.47 | 6000 | 20 |
| 2MASS J | L3.5 | 12.92 | 1500 | 20 |
| UVES observations | ||||
| 2MASS J | L0.0 | 12.53 | 4000 | 15 |
| 2MASS J | L0.0 | 13.17 | 5400 | 20 |
| 2MASS J | L0.0 | 12.09 | 2400 | 25 |
| 2MASS J | L0.0 | 14.36 | 6900 | 20 |
| 2MASS J | L0.5 | 11.76 | 1500 | 20 |
| 2MASS J | L1.0 | 13.67$\star$$\star$Gizis et al., (2001) | 3600 | 9 |
| 2MASS J | L1.0 | 13.16 | 5400 | 15 |
| 2MASS J | L1.0 | 12.92 | 4200 | 15 |
| 2MASS J | L1.0 | 12.72 | 3900 | 20 |
| 2MASS J | L1.0 | 13.65 | 5640 | 25 |
| 2MASS J | L1.0 | 12.56 | 3000 | 20 |
| 2MASS J | L1.5 | 12.45 | 2400 | 20 |
| 2MASS J | L1.5 | 13.12 | 5100 | 20 |
| 2MASS J | L2.0 | 12.80 | 3600 | 15 |
| 2MASS J | L2.0 | 12.78 | 3600 | 20 |
| 2MASS J | L2.0 | 12.81 | 4200 | 25 |
| 2MASS J | L2.5 | 13.08 | 4800 | 20 |
| 2MASS J | L3.0 | 13.37 | 6600 | 30 |
| 2MASS J | L4.0 | 13.31 | 6300 | 10 |
| 2MASS J | L4.0 | 13.31 | 6300 | 20 |
| 2MASS J | L5.0 | 13.11 | 5100 | 10 |
| 2MASS J | L5.0 | 13.17 | 5700 | 15 |
| 2MASS J | L5.0 | 12.83 | 4200 | 30 |
| 2MASS J | L8.0 | 13.25 | 6000 | 20 |
| UVES archive data | ||||
| 2MASS J | L0.0 | 14.08 | 2700 | 15 |
| 2MASS J | L0.5 | 11.76 | 900 | 25 |
| 2MASS J | L0.5 | 13.89 | 2700 | 10 |
| 2MASS J | L0.5 | 14.02 | 3600 | 15 |
| 2MASS J | L1.0 | 12.76 | 900 | 15 |
| 2MASS J | L1.5 | 15.39 | 7200 | 6 |
| 2MASS J | L1.5 | 15.47 | 7200 | 7 |
| 2MASS J | L2.5 | 14.29 | 3600 | 10 |
| 2MASS J | L2.5 | 14.12 | 7200 | 10 |
| 2MASS J | L3.0 | 15.97 | 7200 | 5 |
| 2MASS J | L3.0 | 14.01 | 9000 | 10 |
| 2MASS J | L3.0 | 14.54 | 7200 | 15 |
| 2MASS J | L4.5 | 14.07 | 4200 | 10 |
| 2MASS J | L5.0 | 12.83 | 1800 | 20 |
| 2MASS J | L7.5 | 15.10 | 9000 | 6 |
| Parameter | Value |
|---|---|
| a | |
| b | |
| c | |
| d | |
| e | |
| f |
| Name | Date of observation | H EqW | |
|---|---|---|---|
| 2MASS J | 2006-05-12 | 25.65 | |
| (L0.0) | 2006-04-10 | 5.01 | |
| 2MASS J | 2005-05-13 | 10.51 | |
| (L0.0) | 2006-04-15 | 5.99 | |
| 2MASS J | 2006-05-14 | 3.32 | |
| (L1.0) | 2006-05-19 | 5.52 | |
| 2MASS | 2006-05-12 | 3.19 | |
| (L1.0) | 2007-01-30 | 1.08 | |
| 2MASS J | 2000-04-27 | 3.48 | |
| (L1.0) | 2005-03-02 | 13.22 | |
| 2MASS J | 2006-04-02 | 2.45 | |
| (L1.0) | 2006-05-13 | 26.79 | |
| 2MASS J | 2005-12-17 | 1.75 | |
| (L2.0) | 2006-11-08 | 0.20 | |
| 2MASS J | 2006-05-12 | 1.00 | |
| (L2.0) | 2006-04-09 | 2.39 |
| Name | SpType | H EqW | log() | |||
|---|---|---|---|---|---|---|
| [K] | [km s-1] | [Å] | [km s-1] | |||
| 2MASS | L0.0 | 2300 | 19 | 16.8 | ||
| 2MASS | L0.0 | 2300 | 71 | |||
| 2MASS | L0.0 | 2300 | 25 | 8.1 | ||
| 2MASS | L0.0 | 2300 | 15 | 15.8 | ||
| 2MASS | L0.0 | 2300 | 7 | |||
| 2MASS | L0.0 | 2300 | 17 | |||
| 2MASS | L0.5 | 2250 | 31 | 21.3 | ||
| 2MASS | L0.5 | 2250 | 19 | |||
| 2MASS | L0.5 | 2250 | 23 | |||
| 2MASS | L0.5 | 2250 | 41 | 26.4 | ||
| 2MASS | L1.0 | 2200 | 13 | |||
| 2MASS | L1.0 | 2200 | 9 | |||
| 2MASS | L1.0 | 2200 | 15 | 81.9 | ||
| 2MASS | L1.0 | 2200 | 3 | 36.6 | ||
| 2MASS | L1.0 | 2200 | 17 | 37.9 | ||
| 2MASS | L1.0 | 2200 | 10 | 97.9 | ||
| 2MASS | L1.0 | 2200 | 8 | |||
| 2MASS | L1.0 | 2200 | 11 | 89.0 | ||
| 2MASS | L1.0 | 2200 | 11 | |||
| 2MASS | L1.5 | 2140 | 14 | |||
| 2MASS | L1.5 | 2140 | 30 | |||
| 2MASS | L1.5 | 2140 | 9 | |||
| 2MASS | L1.5 | 2140 | 76 | 11.2 | ||
| 2MASS | L1.5 | 2140 | 62 | 5.9 | ||
| 2MASS | L2.0 | 2080 | 33 | |||
| 2MASS | L2.0 | 2080 | 15 | 57.8 | ||
| 2MASS | L2.0 | 2080 | 22 | 49.3 | ||
| 2MASS | L2.0 | 2080 | 76 | 25.7 | ||
| 2MASS | L2.5 | 2010 | 21 | 5.1 | ||
| 2MASS | L2.5 | 2010 | 29 | |||
| 2MASS | L2.5 | 2010 | 15 | |||
| 2MASS | L3.0 | 1950 | 34 | |||
| 2MASS | L3.0 | 1950 | 39 | 88.1 | ||
| 2MASS | L3.0 | 1950 | 20 | 74.2 | ||
| 2MASS | L3.0 | 1950 | 13 | |||
| 2MASS | L3.0 | 1950 | 27 | 58.9 | ||
| 2MASS | L3.5 | 1880 | 45 | 36.9 | ||
| 2MASS | L3.5 | 1880 | 41 | 29.7 | ||
| 2MASS | L4.0 | 1820 | 26 | |||
| 2MASS | L4.5 | 1760 | 32 | 52.8 | ||
| 2MASS | L5.0 | 1700 | 42 | 83.3 | ||
| 2MASS | L5.0 | 1700 | 23 | 24.0 | ||
| 2MASS | L5.0 | 1700 | 32 | 30.8 | ||
| 2MASS | L7.5 | 1500 | 19 | 38.2 | ||
| 2MASS | L8.0 | 1480 | 67 | 28.6 |