Optical and IR observations of SN 2002dj: some possible common properties of fast expanding SNe Ia
Abstract
As part of the European Supernova Collaboration we obtained extensive photometry and spectroscopy of the type Ia SN 2002dj covering epochs from 11 days before to nearly two years after maximum. Detailed optical and near-infrared observations show that this object belongs to the class of the high-velocity gradient events as indicated by Si, S and Ca lines. The light curve shape and velocity evolution of SN 2002dj appear to be nearly identical to SN 2002bo. The only significant difference is observed in the optical to near-IR colours and a reduced spectral emission beyond 6500 Å. For high-velocity gradient Type Ia supernovae, we tentatively identify a faster rise to maximum, a more pronounced inflection in the V and R light curves after maximum and a brighter, slower declining late-time B light curve as common photometric properties of this class of objects. They also seem to be characterized by a different colour and colour evolution with respect to “normal” SNe Ia. The usual light curve shape parameters do not distinguish these events. Stronger, more blueshifted absorption features of intermediate-mass elements and lower temperatures are the most prominent spectroscopic features of Type Ia supernovae displaying high velocity gradients. It appears that these events burn more intermediate-mass elements in the outer layers. Possible connections to the metallicity of the progenitor star are explored.
keywords:
supernovae: general - supernovae: individual: SN 2002dj1 Introduction
In the last decade type Ia Supernovae (SNe Ia) have been extensively used for cosmology yielding evidence that we live in an accelerating Universe (Riess et al. 1998; Perlmutter et al. 1999). Ongoing surveys such as ESSENCE (Miknaitis et al., 2007; Wood-Vasey et al., 2007) and SNLS (Astier et al., 2006) use the relation between the shape of the light curve and its peak luminosity (Phillips, 1993; Phillips et al., 1999; Hamuy et al., 1996; Riess, Press & Kirshner, 1996; Goldhaber et al., 2001; Guy et al., 2005; Prieto, Rest & Suntzeff, 2006) to constrain the equation-of-state parameter for dark energy. An important caveat is that those relations assume that SNe Ia are a one parameter family.
However, in recent years there has been growing evidence for the observational diversity among SN Ia and this is of prime interest in their application as distance indicators. Subtle but unequivocal differences between events with large wavelength coverage and dense temporal sampling are evident in light curve shapes, colour evolutions, luminosities, evolution of spectral lines and expansion velocities derived from the line shifts. The search for accurate correlations between photometric and spectroscopic properties could improve the luminosity calibration and help to shed light on the explosion mechanisms and progenitor system. Recently, Benetti et al. (2005) have identified three classes of SNe Ia based on their spectroscopic features. A similar classification is also reported in Branch et al. (2006). Interestingly, two of these classes are nearly indistinguishable in some of their photometric parameters (e.g. , Phillips et al. 1993); yet they show clear spectroscopic differences. High velocity gradient (HVG) SNe are characterized by a fast decrease in their expansion velocity over time as measured from the minimum of the Si II (6355 Å) absorption line. On the other hand in the low velocity gradient (LVG) SNe group, which represents the majority of SN Ia, the evolution of the Si II (6355 Å) velocity is smooth, the ejecta expansion is slower than in HVG SNe. These spectroscopic differences may or may not affect the relations used to calibrate the luminosities of SNe Ia. Subtle differences in colour may exist among the different classes and lead to significant bias in reddening estimates. The existence of spectroscopic families suggests possible differences in the progenitor channels and/or explosion mechanisms. Branch & van den Bergh (1993) for example reported that SNe characterized by high expansion velocities, tend to explode in late type galaxies, pointing to progenitors arising from a young population.
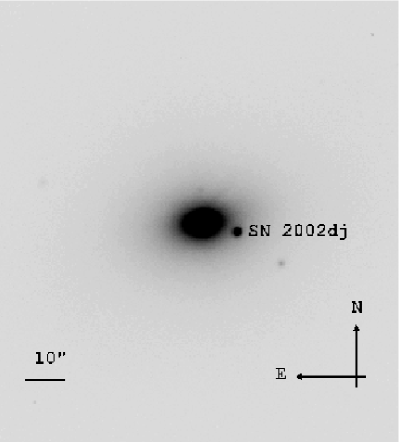
In this paper we present the observations of the HVG SN 2002dj carried out by the European Supernova Collaboration (ESC). SN 2002dj (, , J2000) was discovered in NGC 5018 on June 12.2 UT (IAUC 7918, Hutchings & Li, 2002) and classified by ESC members as a Type Ia event on June 14.15 UT (IAUC 7919, Riello et al., 2002). The layout of the manuscript is as follows. Observations and data reduction are presented in Sect. 2. We describe the reddening estimate in Sect. 3. In Sect. 4 we analyze the SN 2002dj optical and IR photometry comparing its properties with those of its kinematical twin, SN 2002bo. We also investigate whether they are representative of the HVG SNe group. Sect. 5 contains the determination of the SN 2002dj absolute luminosity and a characterization of the properties of its host galaxy. The optical and IR spectroscopy is analyzed in Sect. 6 and Sect. 7, respectively. The expansion velocities are discussed in Sect. 8 and models of the early and late spectra in Sect 9. We conclude in Sect. 10 by examining possible physical conditions in the HGV SNe ejecta that could explain part of their spectroscopic and photometric behavior.
2 Observations and Data Reduction
2.1 Instrument settings
SN 2002dj was observed with seven different instruments in the optical and two facilities in the near infrared. Below we list the instruments and their main characteristics:
-
•
0.9m telescope located at Cerro Tololo Inter-American Observatory (CTIO) equipped with a CCD camera (20482048, pixel size = 0.40 arcsec pixel-1) and UBVRI Johnsons, Kron-Cousin standard filters.
-
•
1.0m telescope located at CTIO equipped with A Novel Double-Imaging CAMera (ANDICAM; Hawaii HgCdTe 10241024, pixel size = 0.137 arcsec pixel-1) and JHKs standard filters.
-
•
European Southern Observatory (ESO) New Technology Telescope (NTT) located at La Silla Observatory and equipped with the ESO Multi Mode Instrument (EMMI) in RILD mode (2MIT/LL CCD 20484096, pixel size = 0.167 arcsec pixel-1) and BVRI standard filters with ESO identification numbers 605, 606, 608 and 610, respectively.
-
•
ESO-NTT equipped with the Son of ISAAC camera (SofI; Hawaii HgCdTe 10241024, pixel size = 0.29 arcsec pixel-1) and JHKs standard filters.
-
•
Danish 1.54m telescope located at La Silla Observatory equipped with the Danish Faint Object Spectrograph and Camera (DFOSC; MAT/EEV CCD 44-82 20482048, pixel size = 0.39 arcsec pixel-1) and UBVRI standard filters with ESO identification numbers 632, 450, 451, 452 and 425, respectively.
-
•
ESO-Kueyen Very Large Telescope (VLT) located at Paranal Observatory equipped with the FOcal Reducer and low dispersion Spectrograph (FORS1; 2E2V 20484096 pixel size = 0.2 arcsec pixel-1) and BVRI standard filters with ESO identification numbers +34, +35, +36 and +37, respectively.
-
•
Nordic Optical Telescope (NOT) located at Roque de los Muchachos Observatory equipped with the Andalucía Faint Object Spectrograph and Camera (ALFOSC; E2V 20482048, pixel size = 0.19 arcsec pixel-1) and UBVR standard filters with NOT identification numbers 7, 74, 75 and 76, respectively, and an interference i filter with number 12.
-
•
Isaac Newton Group (ING) Jacobus Kapteyn Telescope (JKT) located at Roque de los Muchachos Observatory equipped with a CCD camera (SITe2 20482048, pixel size = 0.33 arcsec pixel-1) and UBVRI standard filters with ING identification numbers 3, 27, 30, 37 and 44, respectively.
-
•
ING-Isaac Newton Telescope (INT) located at Roque de los Muchachos Observatory equipped with the Wide Field Camera (WFC; 4 thinned EEV 20484096, pixel size = 0.33 arcsec pixel-1) and UBVRi(sloan) standard filters with ING identification numbers 204, 191, 192, 193 and 215, respectively.
2.2 Optical and infrared photometry
| id | U | B | V | R | I |
|---|---|---|---|---|---|
| 1 | 17.91 0.02 | 17.09 0.03 | 16.61 0.03 | 16.18 0.04 | |
| 2 | 15.79 0.04 | 15.08 0.01 | 14.09 0.02 | 13.53 0.02 | 13.02 0.01 |
| 3 | 18.11 0.02 | 17.33 0.04 | 16.88 0.03 | 16.43 0.02 | |
| 4 | 18.15 0.04 | 17.51 0.03 | 17.13 0.01 | 16.76 0.06 | |
| 5 | 16.44 0.05 | 16.45 0.02 | 15.84 0.01 | 15.48 0.01 | 15.11 0.01 |
| 6 | 18.59 0.02 | 17.52 0.05 | 16.90 0.01 | 16.31 0.01 | |
| 7 | 15.05 0.03 | 15.08 0.01 | 14.62 0.02 | 14.33 0.01 | 14.04 0.03 |
| 8 | 18.01 0.08 | 17.60 0.01 | 16.57 0.01 | 15.96 0.02 | 15.38 0.01 |
| 9 | 19.25 0.06 | 18.68 0.04 | 18.32 0.05 | 17.85 0.08 | |
| 10 | 17.31 0.07 | 17.28 0.03 | 16.62 0.01 | 16.22 0.04 | 15.85 0.03 |
| 11 | 16.87 0.06 | 16.76 0.03 | 15.98 0.03 | 15.50 0.02 | 15.03 0.01 |
| UT date | M.J.D. | Phasea | U | B | V | R | I | Instr. |
|---|---|---|---|---|---|---|---|---|
| 13/06/2002p | 52439.1 | -10.9 | 16.07 0.04 | 16.06 0.02 | 15.85 0.02 | 15.66 0.02 | 15.90 0.03 | CTIO 0.9m |
| 14/06/2002 | 52439.9 | -10.1 | 15.64 0.02 | 15.49 0.02 | 15.27 0.02 | 15.46 0.02 | EMMI | |
| 27/06/2002p | 52452.9 | 2.9 | 14.30 0.03 | 14.36 0.02 | 14.14 0.02 | 14.10 0.02 | 14.46 0.02 | WFC |
| 28/06/2002 | 52453.9 | 3.9 | 14.41 0.02 | 14.16 0.02 | 14.12 0.02 | 14.48 0.02 | JKT | |
| 29/06/2002 | 52455.0 | 5.0 | 14.41 0.04 | 14.46 0.02 | 14.20 0.02 | 14.15 0.03 | 14.51 0.03 | JKT |
| 30/06/2002 | 52456.0 | 6.0 | 14.24 0.02 | JKT | ||||
| 02/07/2002 | 52458.0 | 8.0 | 14.66 0.09 | 14.31 0.02 | 14.31 0.02 | 14.61 0.02 | JKT | |
| 03/07/2002 | 52458.1 | 8.1 | 14.86 0.04 | 14.67 0.02 | 14.27 0.02 | 14.30 0.02 | 14.66 0.05 | DFOSC |
| 04/07/2002 | 52460.0 | 10.0 | 15.02 0.04 | 14.81 0.02 | 14.36 0.02 | 14.46 0.02 | 14.85 0.05 | DFOSC |
| 07/07/2002p | 52463.0 | 13.0 | 15.42 0.04 | 15.13 0.02 | 14.56 0.02 | 14.61 0.03 | 14.94 0.04 | DFOSC |
| 09/07/2002 | 52465.0 | 15.0 | 15.75 0.04 | 15.39 0.02 | 14.73 0.02 | 14.71 0.02 | 14.97 0.02 | DFOSC |
| 11/07/2002 | 52467.0 | 17.0 | 16.06 0.04 | 15.61 0.02 | 14.85 0.02 | 14.76 0.02 | 14.95 0.02 | DFOSC |
| 17/07/2002p | 52473.0 | 23.0 | 15.12 0.02 | 14.86 0.02 | 14.81 0.02 | CTIO 0.9m | ||
| 16/07/2002 | 52473.1 | 23.1 | 16.75 0.04 | 16.29 0.02 | 15.13 0.02 | 14.83 0.02 | 14.89 0.02 | DFOSC |
| 19/07/2002 | 52476.0 | 26.0 | 16.99 0.04 | 16.54 0.02 | 15.40 0.02 | 15.05 0.02 | 14.85 0.02 | DFOSC |
| 24/07/2002 | 52479.9 | 29.9 | 16.89 0.02 | 15.58 0.02 | 15.14 0.02 | 14.83 0.02 | ALFOSC | |
| 25/07/2002 | 52481.0 | 31.0 | 17.44 0.05 | 16.91 0.02 | 15.59 0.02 | 15.18 0.02 | 14.88 0.02 | DFOSC |
| 29/07/2002 | 52484.9 | 34.9 | 17.59 0.15 | ALFOSC | ||||
| 08/08/2002p | 52495.0 | 45.0 | 17.41 0.04 | 16.25 0.02 | 15.95 0.03 | 15.77 0.06 | CTIO 0.9m | |
| 31/08/2002 | 52518.0 | 68.0 | 18.43 0.09 | 16.83 0.02 | DFOSC | |||
| 02/09/2002 | 52520.0 | 70.0 | 16.87 0.02 | DFOSC | ||||
| 06/09/2002 | 52524.0 | 74.0 | 17.75 0.19 | 17.06 0.06 | 17.01 0.48 | DFOSC | ||
| 25/03/2003p | 52724.3 | 274.3 | 21.00 0.04 | 20.71 0.03 | 21.39 0.06 | 20.78 0.09 | FORS1 | |
| 22/05/2004p | 53147.2 | 697.2 | 24.7b | 23.4b | FORS1 |
a Counted since the time of the maximum brightness M.J.D.=52450 0.7
b Upper limit
p Photometric night
| id | J | H | Ks |
|---|---|---|---|
| 2 | 12.23 0.03 | 11.75 0.03 | 11.63 0.03 |
| 2 IR | 14.80 0.03 | 14.18 0.03 | 13.95 0.04 |
| 7 | 13.63 0.04 | 13.42 0.04 | 13.38 0.04 |
| 11 | 14.32 0.04 | 13.89 0.04 | 13.76 0.04 |
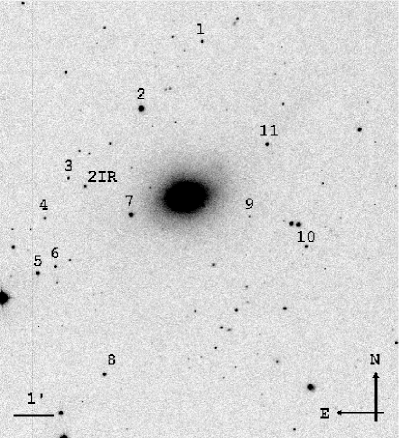
For the optical photometric observations basic data reduction (bias and flat-field correction) was performed using standard routines in IRAF111IRAF is distributed by the National Optical Astronomy Observatories, which are operated by the Association of Universities for Research in Astronomy, Inc, under contract to the National Science Foundation.. In Table 1 are reported the magnitudes of the local photometric sequence identified in Fig. 1, that were calibrated against Landolt standard stars (Landolt, 1992) in the seven photometric nights marked in Table 2. SN photometry was performed using the PSF fitting technique. Only in the and FORS1 images obtained on March 25, 2003, was it possible to remove the galaxy. For the other instruments the lack of a suitable image without the SN has prevented us from using the template subtraction technique. We note that the FORS1 and band frames on which the SN is still relatively bright yield magnitudes in agreement to the ones derived from the template subtracted images. This gives us confidence that the PSF photometry performed around maximum, when the SN signal-to-noise ratio is high, was not significantly contaminated by the host galaxy background.
The near-IR data reductions were also performed using standard IRAF routines. Dark and flat-field corrections were applied to the scientific frames. For each night a sky background image was created by taking the median of the dithered science frames. For the ANDICAM images this approach lead to an imperfect removal of the galaxy light. Nevertheless, the good agreement between the SofI and ANDICAM photometry gives us confidence that the small galaxy residuals did not significantly bias the ANDICAM magnitudes. The sky background image was then subtracted from each single frame. For SofI, an illumination correction was also applied to all images. Four stars close to the SN position were calibrated in the bands using standard stars from Persson et al. (1998) during three photometric nights marked in Table 4. The resulting magnitudes are listed in Table 3. They agree well with those reported in the 2MASS catalog with =0.01 0.01, =0.00 0.01 and . The final SN calibration in all bands was performed using the S-correction technique (see Appendix for details). Thanks to the very good spectroscopic coverage we could compute the S-terms using only the spectra of SN 2002dj for the , , , bands, while for the , , , , the SN 2002dj spectra were complemented with those of SN 2005cf (Garavini et al., 2007) and SN 2002bo (Benetti et al., 2004).
| UT date | M.J.D. | Phasea | J | H | Ks | Instr. |
|---|---|---|---|---|---|---|
| 13/06/2002 | 52439.0 | -11.0 | 15.63 0.06 | 15.64 0.09 | 15.65 0.13 | ANDICAM |
| 14/06/2002 | 52440.0 | -10.0 | 15.27 0.04 | 15.31 0.06 | 15.25 0.09 | ANDICAM |
| 15/06/2002 | 52441.1 | -8.9 | 14.97 0.03 | 15.13 0.03 | 15.11 0.03 | SoFi |
| 19/06/2002p | 52444.1 | -5.9 | 14.63 0.04 | 14.84 0.03 | 14.71 0.03 | SoFi |
| 20/06/2002 | 52446.0 | -4.0 | 14.58 0.11 | 14.80 0.07 | 14.66 0.08 | ANDICAM |
| 24/06/2002 | 52450.0 | -0.0 | 14.60 0.03 | 14.84 0.06 | 14.52 0.10 | ANDICAM |
| 24/06/2002p | 52450.0 | -0.0 | 14.62 0.03 | 14.83 0.03 | 14.54 0.03 | SoFi |
| 27/06/2002 | 52453.1 | 3.1 | 14.86 0.05 | 14.90 0.04 | 14.68 0.09 | ANDICAM |
| 30/06/2002 | 52456.0 | 6.0 | 15.30 0.13 | 15.09 0.10 | 14.88 0.20 | ANDICAM |
| 08/07/2002 | 52464.0 | 14.0 | 16.30 0.09 | 15.05 0.05 | 15.04 0.09 | ANDICAM |
| 11/07/2002 | 52467.0 | 17.0 | 16.26 0.05 | 14.97 0.03 | 14.90 0.06 | ANDICAM |
| 11/07/2002p | 52467.0 | 17.0 | 16.20 0.03 | 14.95 0.03 | 14.83 0.03 | SoFi |
| 14/07/2002 | 52470.0 | 20.0 | 16.08 0.13 | 14.81 0.05 | 14.75 0.08 | ANDICAM |
| 17/07/2002 | 52473.0 | 23.0 | 15.86 0.04 | 14.75 0.03 | 14.65 0.05 | ANDICAM |
| 25/07/2002 | 52481.0 | 31.0 | 15.57 0.07 | 14.79 0.05 | 14.81 0.09 | ANDICAM |
| 28/07/2002 | 52484.0 | 34.0 | 15.63 0.05 | 15.06 0.04 | 15.12 0.07 | ANDICAM |
| 31/07/2002 | 52487.0 | 37.0 | 15.89 0.03 | 15.23 0.07 | 15.43 0.29 | ANDICAM |
| 07/08/2002 | 52494.0 | 44.0 | 16.58 0.14 | 15.61 0.09 | 15.65 0.35 | ANDICAM |
| 10/08/2002 | 52497.0 | 47.0 | 16.68 0.10 | 15.73 0.06 | 15.93 0.16 | ANDICAM |
| 13/08/2002 | 52500.0 | 50.0 | 16.89 0.12 | 15.85 0.06 | 16.04 0.15 | ANDICAM |
| 30/08/2002 | 52517.0 | 67.0 | 18.20 0.38 | 16.66 0.03 | 16.84 0.03 | SoFi |
a Counted since the time of the maximum brightness M.J.D.=52450 0.7
p Photometric night
2.3 Optical and infrared spectroscopy
Optical spectra were reduced using the ctioslit package in IRAF. Optimal extraction was usually obtained by weighting the signal according to the intensity profile along the slit. Sky subtraction was carried out by fitting a low order polynomial on either side of the SN spectrum and the wavelength solution was determined from arc spectra. The wavelength calibration was checked against bright night-sky emission lines. Flux calibration was performed by means of spectrophotometric standard stars (Hamuy et al., 1992, 1994) and checked against the photometry. When discrepancies occurred, the flux of the spectrum was scaled to match the photometry. In nights with good observing conditions the agreement with the photometry was found to be within 10%.
The near-IR spectra were reduced using standard procedures in the FIGARO 4 environment (Shortridge, 1995). Wavelength calibration was carried out using Xe arc spectra and the accuracy of the solution was checked using OH sky lines. The flux calibration was secured with respect to near-IR solar-analog standard stars observed close in time and airmass to the SN to minimize variations in the atmospheric absorptions (Maiolino, Rieke & Rieke, 1996). The SN spectrum was divided by the standard stars spectrum to remove the strong telluric IR features. The resulting spectrum was then multiplied by the solar spectrum to eliminate the intrinsic features introduced by the solar-type star. Like in the optical, the flux calibration was checked against the photometry and, if necessary, scaled to match the latter.
3 Interstellar extinction
Presence of dust in NGC 5018 has been claimed in several studies. The map produced by Fort et al. (1986) shows a dust lane embedded in the galaxy. Subsequently, Carollo & Danziger (1994) and Goudfrooij et al. (1994a) detected patchy dust in the galaxy core. None of those maps shows evidence of dust at the location of SN 2002dj. Our deep images taken with the VLT add details to the Carollo & Danziger (1994) colour maps, but again do not show the presence of dust at, or close to, the SN position. SN spectra can be used to measure the equivalent width () of the Na I D lines as a proxy to quantify absorption. The Galactic colour excess we obtain using one of the two linear relations reported in Turatto et al. (2003) ( yielding from Å) is in very good agreement with that reported by Schlegel, Finkbeiner & Davis (1998) () for the SN 2002dj line of sight. No absorption line of interstellar Na I D has been detected from the host galaxy. Since SN 2002dj was observed both in the optical and in the near IR, we can apply several methods to estimate its extinction from the observed colour. The results are reported in Table 5. We note that all methods involving point to an greater than that due to Milky Way absorption alone, indicating a small but not negligible dust extinction towards SN 2002dj in the host galaxy, while the methods based on colours provide a negligible colour excess for the host galaxy. A similar apparent inconsistency occurred in the case of SN 2002bo, where the reddening derived from colour seems to be larger than that derived through detailed synthetic spectra modeling (Stehle et al., 2005) and, as in the case of SN 2002dj, it is significantly larger than that derived from the colours. The peculiar colours of SN 2002bo were already noted by Benetti et al. (2004) and Krisciunas et al. (2004b).
With the aim to check whether HVG SNe could in general have intrinsically different colours which could bias their reddening estimate, we examined the other HVG SNe reported in the literature for which multi-epoch spectra show a persistent high expansion velocity (see Table 8)222Although SN 2002er was classified as HVG SNe (Benetti et al., 2005) it was not included in the table because of its lower expansion velocities. This SN could indeed represents a transition object between HVG SNe and LVG SNe (Tanaka et al., 2008).. Unfortunately, all objects except SN 2002bf and SN 2004dt, show signs of absorption in their host galaxies (i.e. Na I D lines). The latter two SNe are also not useful for this purpose because the photometric follow-up for SN 2002bf started at +6 days and definitive photometry is not yet available for SN 2004dt. Hence, for all objects in Table 8 the intrinsic colour is rather uncertain. To investigate the possible peculiar colours for HVG SNe we compared the the scatter between the colour excess derived using the and colours among LVG SNe with the systematic difference we found for our sample of HVG SNe.
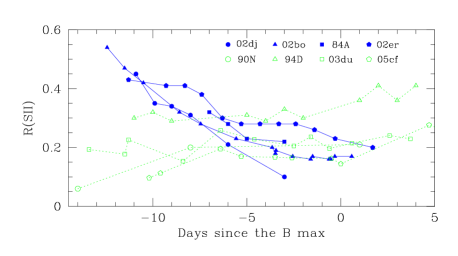
To determine the difference in extinction measure for LVG SNe we used Table 2 of Phillips et al. (1999) and obtained -. This value was derived by selecting SNe with in order to avoid colour peculiarity not accounted by the Phillips et al. (1999) relation (Garnavich et al., 2004). For HVG SNe in addition to SN 2002bo and SN 2002dj, only in the case of SN 1997bp, BVRI photometry (Altavilla et al., 2004; , 2006) was suitable to compute the colours at maximum. For these three objects we find -. The systematic difference in reddening depending on the reference color in HVG SNe is hence nearly the scatter observed in LVG SNe hinting at intrinsic colour differences. Anyway, the colour evolution among HVG SNe shows significant variations (see Fig. 6) making it difficult to establish an overall difference with LVG SNe.
| Method | Reference | |
|---|---|---|
| 0.22 0.06 | Phillips et al. (1999) | |
| 0.24 0.06 | Altavilla et al. (2004) | |
| 0.10 0.06 | Phillips et al. (1999) | |
| 0.32 0.06 | Wang et al. (2003) | |
| 0.29 0.06 | (2006) | |
| 0.27 0.14 | Phillips et al. (1999) | |
| 0.21 0.04 | Wang et al. (2005) | |
| 0.05 0.04 | Krisciunas et al. (2004a) | |
| 0.10 0.06 | Krisciunas et al. (2004a) |
4 Optical and Infrared photometry
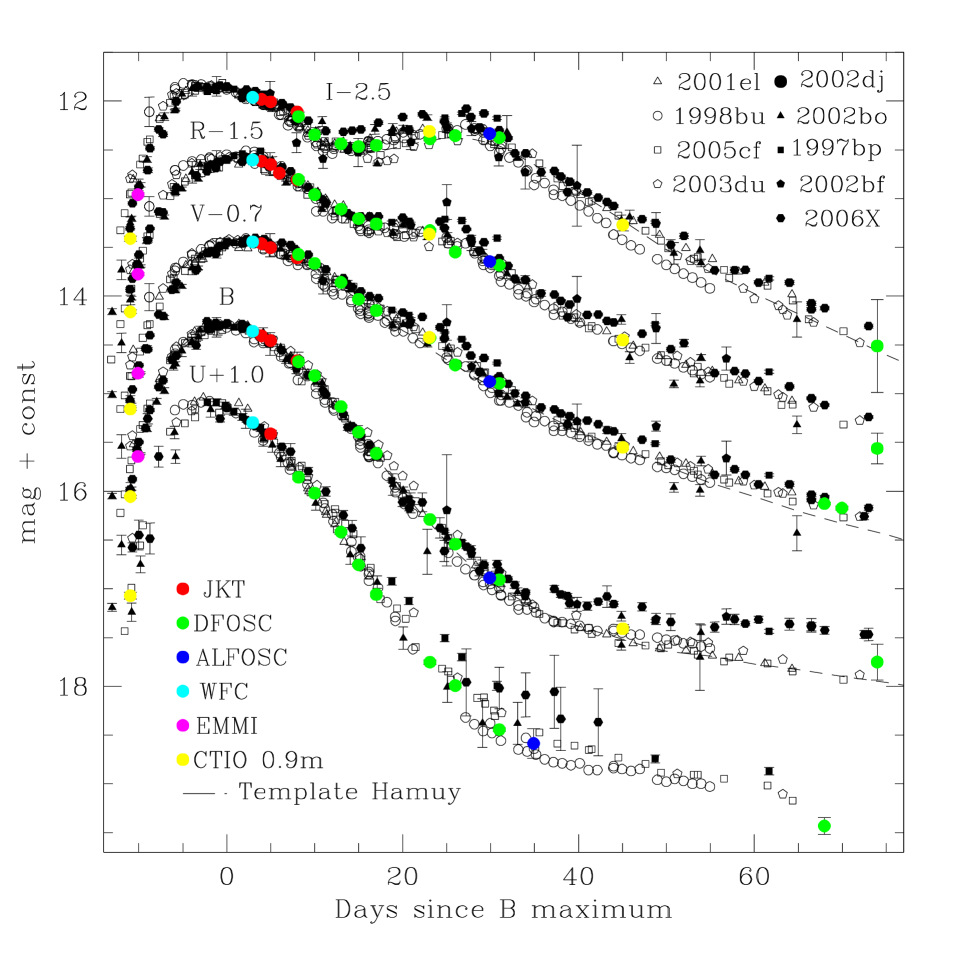
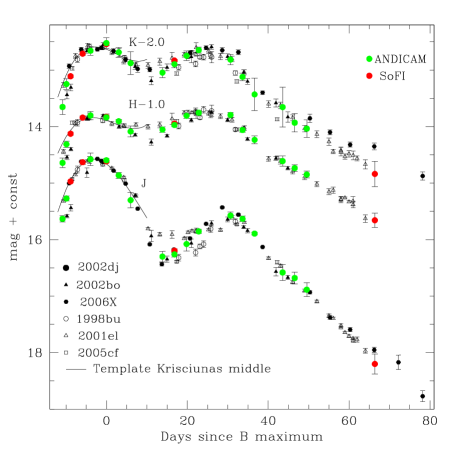
SN 2002dj was observed in from 11 to +697 days and from 11 to +68 days in . The corresponding light curves are shown in Figs. 2, 3, 4, 5, while colour curves are displayed in Figs. 6 and 7.
4.1 Light curves
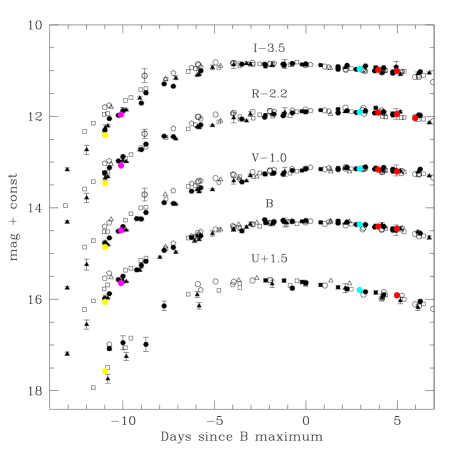
In Fig. 3 the and, to a lesser degree , HVG SNe (filled symbols; SN 2002dj, SN 2002bo and SN 2006X) show a faster rise to maximum if compared to LVG SNe (empty symbols; represented by SN 2001el, SN 2003du and SN 2005cf). On the other hand we note that SN 2006X and SN 1997bp peak later in (+2 days) than the LVG average population (see histograms in Contardo et al. (2000)). Therefore the fast rise in of the HVG objects could be induced by a peculiar behaviour of the light curve that historically is used to set the phase of the SN Ia. Comparing the light curves of SN 2006X (SN 1997bp does not have observations close to maximum) with those of SN 2005cf and leaving the maximum time as a free parameter in the fit, we found a phase shift of 0.9 days for the and bands and 0.5 for the . The latter results reduce the possibility that the early time behaviour of HVG SNe could simply be a phase mis-calibration. This is also confirmed by the IR observation of SN 2002dj, SN 2002bo and SN 2006X which show that those SNe reach the peak at the same epoch as the Krisciunas et al. (2004a) templates (Fig. 4). For the band the situation is more complex. The data are more scattered and systematic errors due to standard filter mis-matching could play an important role. Therefore a photometrically more homogeneous data set is necessary to confirm the trends observed in the other filters.
Another feature visible in Fig. 2 is that the HVG SN 1997bp, SN 2002bf333The light curves of SN 2002bf have been K-corrected to the host galaxy rest frame velocity of SN 2002dj and SN 2006X show more pronounced inflections around +25 days in and . In the case of SN 2002bf the large photometric errors associated with the corresponding points demand caution, while for SN 2006X, at least part of this effect could be due to its high extinction shifting the effective wavelength of the passband to redder (Elias-Rosa et al., 2006; Wang et al., 2008a). The absorption suffered by SN 1997bp is low and the photometric errors small, hence this feature must be intrinsic. Finally, we note that SN 1997bp, SN 2002bf and SN 2006X are the highest velocity SNe Ia in our sample, with velocities about 5000 km s-1 higher than those of SN 2002dj and SN 2002bo (Fig. 21). This suggest that photometric features could be correlated with the kinematics of the ejecta.
Since, as previously mentioned, at early epochs the light curves of HVG SNe are different from those of LVG SNe, we decided to constrain the epoch of the SN 2002dj maximum brightness, hereafter T(), using only the light curve of SN 2002bo. In fact, it is not viable to determine the maximum brightness directly from the SN 2002dj light curve because it happens to fall in a gap of 12 days with no photometric observations. Having constrained T(), (M.J.D.=) we used the light curves of SNe with similar behavior around maximum to estimate the SN 2002dj peak magnitude in (Table 6). The values of the light curve parameters and stretch factor (Perlmutter et al., 1997a) are reported in Table 7. The stretch factor was obtained by fitting the SN 2002dj light curve to the Leibundgut (1988) template complemented by Goldhaber et al. (2001). We note that the values of and , satisfy the relations reported by Perlmutter et al. (1997b) and Altavilla et al. (2004) reasonably well.
As in the optical, in the near infrared bands both SN 2002dj and SN 2002bo show a faster rise to maximum brightness than SN 2001el and the Krisciunas et al. (2004a) “mid-range” decliner IR templates. SN 2006X follows the templates closely, although very early time observations are missing.
At epochs +35 days in , and HVG SNe are perhaps slightly brighter, but the points show large spread, covering possible subtle systematic differences. In HVG SNe are clearly brighter than LVG SNe. Interestingly, as in the case of the inflections occurring around +25 days, the brightest objects among HVG SNe are those displaying the highest expansion velocities. Wang et al. (2008a) already pointed out that the decline rates between +40 and +100 days (Pskovskii 1984) of the HVG SN 1984A, SN 2002bo and SN 2006X are smaller than for “normal” SNe Ia (i.e. = 1.40 0.10 mag 100 d-1), being 1.14 0.06, 1.17 0.10 and 0.92 0.05, respectively. Fitting the three observations of SN 2002bf at phase +40.0 days we obtained = 0.90 0.60. The large error is due to the noisy photometry. For SN 2002dj, considering the only two observations in the phase interval, we derived =1.17 0.13. Also for SN 1997bp we have only two points from which yield =0.83 0.18. Therefore, although with limited statistical strength, we confirm the finding of Wang et al. (2008a). In the fastest expanding SN 1997bp and SN 2006X seem to follow the band trend, while SN 2002dj and SN 2002bo are closer to the evolution of SN 2005cf and SN 1998bu.

At late phases SN 2002dj, although an HVG SN resembles the behavior of LVG SNe. At the latest epoch for which we obtained measurable data (+274 days), SN 2002dj appears in fact in all bands close to the light curve of SN 2001el (Stritzinger & Sollerman, 2007, see Fig. 5). SN 1997bp is instead 0.5 mag and 0.3 brighter in and , respectively. Its late time decline rate is similar to the other SNe, which argues against a possible contribution of a light echo. With the aim to further investigate (or exclude) the presence of a light echo, and imaging of SN 2002dj was performed with FORS1 on April 22, 2004, i.e. 697.2 days after maximum light. Nothing is visible at the position of the SN and through re-detection of artificial stars, we estimated 3 upper limits of 24.7 and 23.4.
4.2 Colour curves

The de-reddened colour curves of SN 2002dj are compared in Fig. 6 with those of SN 1997bp, SN 2002bo, SN 2002bf, SN 2001el, SN 2003du and SN 2005cf. For HVG SNe the reddening was removed using the values of reported in Table 8 and assuming =3.1. Because of their large reddening, SN 2002bo and SN 2006X are not considered in the HVG vs. LVG comparison.
In the colour, at least until +30 days, HVG SNe form a redder sequence than LVG SNe. Afterward the two groups mix due to the HVG slower decline rate in the band. Note that the latter poses problems if one wishes to apply the Lira relation (Phillips et al., 1999) to estimate the reddening of HVG (see also Wang et al., 2008a). Therefore, both maximum light and tail colours could bias the reddening estimation of these objects. In there is not a clear separation between HVG and LVG SNe, while in HVG SNe seem to form a bluer sequence with respect to LVG SNe, but the significance of the differences is reduced by the large calibration uncertainties of the band (see Pignata et al., 2004).
The and colours of SN 2002bo are clearly bluer then those of SN 2002dj. This reflects the lack of flux in the red part of the SN 2002bo spectrum noticeable in the comparison with SN 2002dj (see section 6.3).
The , and colours curves of SN 2002dj (Fig. 7) follow the Krisciunas et al. (2004a) “mid range” templates reinforcing the idea of negligible host galaxy reddening. As in the case of the and colours, SN 2002bo is bluer at all epochs. The difference to SN 2002dj increases toward redder bands, suggesting that the lack of flux starting around 6500 Å continues monotonically towards longer wavelengths.

5 Absolute luminosity
The Virgo infall model of Kraan-Korteweg (1986) yields a distance to relative Virgo of 2.52 for NGC 5018. Assuming a Virgo distance of 15.3 Mpc (Freedman et al., 2001) we obtain 38.55 Mpc () for the host galaxy of SN 2002dj. The Nearby Galaxies Catalog (Tully, 1988) reports a larger distance (40.9 Mpc, =33.1), while Hilker & Kissler-Patig (1996) using the globular cluster luminosity function derived a distance modulus ranging between 32.8 and 34.0. For a consistent comparison to SN 2002bo we decided to assume 38.55 Mpc as the best distance estimate for SN 2002dj. With this distance and the reddening estimate we derived the corresponding absolute magnitudes in . The values are reported in Table 6, along with those obtained from the absolute magnitude relations of Prieto, Rest & Suntzeff (2006) for and those of (2004) for the . The absolute magnitudes in all the bands are in agreement within 2 with the values predicted by the previously mentioned relations, although SN 2002dj appears slightly underluminous.
| Filter | m(obs)a | M(cor)b | M(ave)c |
|---|---|---|---|
| 14.30 0.04 | -19.03 0.23 | -19.34 0.02 | |
| 14.15 0.04 | -19.08 0.19 | -19.26 0.02 | |
| 14.10 0.05 | -19.06 0.17 | -19.26 0.02 | |
| 14.35 0.06 | -18.72 0.14 | -19.00 0.02 | |
| 14.56 0.02 | -18.46 0.11 | -18.57 0.03 | |
| 14.80 0.03 | -18.18 0.11 | -18.24 0.04 | |
| 14.51 0.05 | -18.45 0.11 | -18.42 0.04 |
a Apparent magnitude
b Absolute magnitude corrected for reddening
c Average absolute magnitude for SNe Ia
Using the observations of SN 2002dj and adding the UV contribution determined by Suntzeff (1996), we constructed a light curve that is compared in Fig. 8 with that of SN 2002bo and a model generated using a Monte Carlo light curve code (Cappellaro et al., 1997). The curve of SN 2002bo published by Benetti et al. (2004) has been rescaled to the new distance estimate ( = 31.76 0.07) reported by Elias-Rosa et al. (2008). Within the errors the absolute luminosities of the two SNe are comparable. The model provides a good fit to the brightness and width near the peak, yielding a 56Ni mass of 0.45 0.04 for SN 2002dj, but after +20 days it overestimates the observed flux. This is probably due to sudden changes in the opacity at advanced stages which our model does not properly take into account.

5.1 An intriguing host galaxy
| Host galaxy | NGC 5018 |
|---|---|
| Galaxy type | E3 |
| RA (2000) | 13h13m01s.7 |
| Dec (2000) | 19∘31’12”.8 |
| Heliocentric | |
| Recession velocity [km s-1] | 2816 1 |
| Distance modulus | 32.93 0.15 |
| Date of max (MJD) | 52450.0 0.7 |
| Offset from the nucleus | West, South |
| 1.08 0.05 | |
| stretch factor in | 0.97 0.02 |
(Rothberg & Joseph, 2006)
| SN | Galaxy | Type | ||
|---|---|---|---|---|
| SN 1981B | NGC 4536 | SAB | 1.11 | |
| SN 1983G | NGC 4753 | I0 | 1.37 | |
| SN 1984A | NGC 4419 | SB | 1.21 | |
| SN 1989A | NGC 3687 | SAB | 1.06 | |
| SN 1997bp | NGC 4680 | Sp | 1.00 | 0.18(0.04)a |
| SN 2002bf | CGCG 266-031 | SB(r)b | 0.08(0.04)b | |
| SN 2002bo | NGC 3190 | Sap | 1.17 | 0.38(0.10)c |
| SN 2002dj | NGC 5018 | E3 | 1.08 | 0.096(0.05) |
| SN 2004dt | NGC 799 | SB(s) | 1.21 | |
| SN 2006X | NGC 4321 | SABbc | 1.31 | 1.41(0.04)d |
NGC 5018 is the dominant giant elliptical of a small group. It is
peculiar in several respects. First, Schweizer et al. (1990)
classified it as one of their best candidates for a recent major
merger. Second, although it is morphologically classified as gE,
its nuclear optical spectrum distinguishes itself by having the
weakest measurement of the absorption line index Mg2 (0.218)
for its velocity dispersion among over 400 gEs surveyed by
Davies et al. (1987). Its UV (IUE) spectrum lacks the prominent
UV-upturn shortward of 2000Å, which is typical of old,
metal-rich spheroids (Bertola et al., 1993). Nevertheless, through a
spectral index study, Leonardi &
Worthey (2000) found indications for
the presence of a relatively young stellar population (2.8
Gyr) in the central region of NGC 5018 with nearly solar
metallicity. A similar age (3Gyr) is proposed by
Buson et al. (2004) through a UV spectroscopy study. Kim et al. (1988)
detected a H I gas bridge connecting NGC 5018 with the nearby
spiral NGC 5022, indicating an ongoing flow toward the giant
elliptical. Furthermore, possible young (
years) globular clusters have been claimed by Hilker &
Kissler-Patig (1996).
Finally the Hα+[N II] maps reported in
Goudfrooij et
al. (1994b) reveal the presence of an extended emission
distributed as a strongly warped disk covering the SN 2002dj
position that the authors suggest to be associated with star
forming regions.
Branch & van den
Bergh (1993) reported that SNe Ia
characterized by high expansion velocities, tend to explode in
late type galaxies and suggested that those objects could have
younger progenitors than “normal” SNe Ia. The HVG SNe analyzed
in this paper confirm this (Table 8). Hamuy et al. (2000)
pointed out that slow declining events preferentially occur in
late type galaxies, while fast decliners occur in all type of
galaxies. A similar result was obtained by Sullivan et al. (2006)
for a sample of high-z SNe Ia. These observations seem at odds
with the fact that SN 2002dj was hosted by an elliptical galaxy.
However, given the peculiarities of NGC5018 it is possible that
SN 2002dj could be associate with a relatively young stellar
population.
6 Optical spectra
Spectra of SN 2002dj have been obtained at 20 epochs spanning phases between and +274 days (Table 9), following the rapid evolution during the early epochs in detail and sampling the late phases more sparsely. The early discovery of SN 2002dj allows us to compare its spectral evolution (Fig. 9) with that of SN 2002bo and other SNe, especially at early epochs.
| UT date | M.J.D. | epocha | range | res. | Instr. |
|---|---|---|---|---|---|
| (days) | (Å) | (Å) | |||
| 02/06/13 | 52439.1 | -10.9 | 3300-9300 | 9 | DFOSC |
| 02/06/14 | 52440.1 | -9.9 | 3700-9800 | 10 | EMMI |
| 02/06/15 | 52441.0 | -9.0 | 3300-9300 | 9 | DFOSC |
| 02/06/15 | 52441.1 | -8.9 | 9400-16500 | 21 | SofI |
| 02/06/16 | 52442.0 | -8.0 | 3300-9300 | 9 | DFOSC |
| 02/06/18 | 52444.0 | -6.0 | 3300-9300 | 9 | DFOSC |
| 02/06/19 | 52444.1 | -5.9 | 9400-25400 | 21 | SofI |
| 02/06/20 | 52446.0 | -4.0 | 3200-9200 | 9 | DFOSC |
| 02/06/21 | 52447.0 | -3.0 | 3300-9300 | 9 | DFOSC |
| 02/06/24 | 52450.0 | 0.0 | 9400-16500 | 21 | SofI |
| 02/07/03 | 52458.7 | 8.7 | 3400-9300 | 9 | DFOSC |
| 02/07/04 | 52460.0 | 10.0 | 3300-10300 | 9 | DFOSC |
| 02/07/07 | 52463.0 | 13.0 | 3200-9100 | 9 | DFOSC |
| 02/07/11 | 52467.0 | 17.0 | 3300-10300 | 9 | DFOSC |
| 02/07/11 | 52467.0 | 17.0 | 9400-25200 | 21 | SofI |
| 02/07/16 | 52473.1 | 23.1 | 3300-9100 | 9 | DFOSC |
| 02/07/25 | 52481.0 | 31.0 | 3700-10300 | 9 | DFOSC |
| 02/09/02 | 52520.0 | 70.0 | 3400-9100 | 9 | DFOSC |
| 03/02/01 | 52672.3 | 222.3 | 3400-7500 | 14 | EFOSC |
| 03/03/25 | 52724.3 | 274.3 | 3600-8600 | 12 | FORS1 |
aCounted since the time of the maximum brightness
M.J.D.=

6.1 Premaximum phase
In Fig. 10 we show the first spectrum of SN 2002dj obtained about 11 days before maximum together with coeval spectra of SN 2002bo, SN 2003du, SN 2005cf and SN 1994D. Already at a first glance it is evident how the minima of the Ca II H&K, S II and Si II absorption features are more blueshifted in the spectra of SN 2002dj and SN 2002bo than in LVG SN 2003du, SN 2005cf and SN 1994D. The Si II lines are also deeper in HVG SNe. The blueshift is due to the higher expansion velocities of the HVG objects (cf. Fig. 21). The blending of high velocity detached features (Branch et al., 2004) with the photospheric line component could also play an important role in blueshifting the absorption minimum of Ca II H&K and Si II 6355 Å in HVG SNe as it is for the Ca II IR triplet (Mazzali et al. 2005, Tanaka et al. 2008). For example, the minimum of Si II 6355 Å in SN 2002dj and SN 2002bo is at the same position of the high velocity component identified by Garavini et al. (2007) in the spectrum of SN 2005cf. The feature around 4400 Å marked in Fig. 10 is attributed to Si III 4553,4568 Å. The strength of this line correlates with temperature and is clearly detected in LVG SNe. The spectrum of SN 2002dj only has a hint Si III, and it is completely absent in SN 2002bo. As shown in Fig. 15, the low temperature of HVG SNe at early epochs is confirmed by their high (Si II). If well traced by (Si II) the temperature should rapidly rise in HVG SNe and quickly reach that of LVG SNe. Indeed at 4 days (Fig. 11) the Si III is visible with similar strength in all SNe but SN 2002bo. The latter SN also lacks the weak absorption at 5550 Å also attributed to Si III (5740 Å) that is present in all other SNe. It is interesting to note how the minimum of the Si III line is at nearly the same wavelength for all SNe, indicating that the line is formed at roughly the same position in velocity space. The Ca II H&K doublet (blended with Si II 3858 Å) appears to be double-dipped in LVG SN 1994D and SN 2003du, while it is a single feature in SN 2002dj and SN 2002bo. Hatano et al. (2000) suggested that this difference is related to higher expansion velocities that lead to a greater degree of line blending. The Ca II line blending could also be enhanced by the presence of high velocity features. On the other hand Lentz et al. (2000) argued that the double-dip disappears when Si II is weaker than Ca II. Given that in all fast expanding SNe the Si II lines are stronger than in the slow expanding SNe, line blending seems a most consistent explanation.


6.2 Postmaximum phase
A week after maximum the Si II 6355 Å line in the HVG SN 2002dj and SN 1997bp remains blueshifted with respect to the LVG SN 1994D, SN 2003du and SN 2005cf (Fig. 12). The Si II 6355 Å feature is still deeper in SN 2002dj and SN 1997bp than in LVG SNe, while, contrary to the pre-maximum spectra, the S II line 5640 Å is weaker. SN 2002dj and SN 1997bp also show less substructure in the region between 4700 and 5100 Å with respect to SN 1994D, SN 2003du and SN 2005cf. Finally we note that the absorption minimum of the feature around 5700 Å at this epoch attributed to a blend of Na I D and Si II 5972 Å (Garavini et al., 2007) has about the same position, but in SN 2002dj and especially in SN 1997bp it is weaker than in the other SNe. By one month after maximum the spectra are dominated by iron peak elements (Fig. 13). The absorption minimum of the lines are nearly at the same position in all selected SNe. The early fast expansion of SN 2002dj, SN 2002bo and SN 1997bp is now only reflected in the broadness of the Ca II IR triplet. The Na I D line is still weaker than in SN 2003du and SN 2005cf and is now slightly redshifted. The line at 5300 Å identified by Branch et al. (2005) as due to Cr II is barely visible in the faster expanding SNe while it remains visible in the slower ones. Finally, around two months after maximum brightness the features due to Fe II are slightly redshifted or at the same position in SN 2002dj and SN 2002bo with respect to SN 2003du and SN 2005cf (Fig. 14). Also the Na I D line is slightly redshifted and its intensity is comparable in all SNe. Interestingly, in the region between 4700 and 5100 Å SN 2002dj and SN 2002bo still show less substructures. At these epochs line blending due to the high velocity should not be severe in HVG SNe, so the lack of lines points to a temperature or abundance effect.


6.3 SN 2002dj versus SN 2002bo, a close comparison
We compare the spectra of SN 2002dj with those of SN 2002bo at four different epochs (Fig. 16). In the wavelength interval covered by the and filters the similarity between the two objects is evident, but around 6500 Å SN 2002bo shows less flux than SN 2002dj. Since the spectra of both SNe were calibrated in different epochs with different instruments, we can rule out an instrumental mis-calibration. Alternatively the difference could be attributed to an incorrect estimate of the reddening of the two objects. However, in this case we would expect a gradual deviation of the two spectra, but the discrepancy looks more like a break possibly due to a lack of opacity in the photosphere of SN 2002bo. For the comparison we chose to obtain the best fit between 4000 and 6000 Å. If instead we scale the spectra of SN 2002bo in order to get the best match with the redder part of those of SN 2002dj, we end up with a flux excess in SN 2002bo at blue wavelength. While this is possible, the comparison of the SN 2002bo colours with those of other LVG and HVG SNe and the results of the spectral modeling reported by Stehle et al. (2005) point to a flux deficit in the red part instead of an excess in the blue.

7 IR spectra

Although the sample of published IR spectra of SNe Ia is growing rapidly, their number is still small compared with those obtained at optical wavelengths. In this context the spectral evolution of SN 2002dj in the IR from day -8.9 to +17 presented in Fig. 17 constitutes an important contribution to the global database.

Fig. 18 compares the first SN 2002dj IR spectrum with
those of SN 2002bo, SN 1994D and SN 1999ee at similar epochs.
The IR spectrum at this phase is nearly featureless with the
remarkable exception of an absorption at 10500 Å. The
identification of this line remains open. It was
attributed by Meikle et al. (1996) to He I 10830 Å or
Mg II 10926 Å based on an Local Thermodynamic
Equilibrium (LTE) treatment. Using a NLTE approach,
Mazzali & Lucy (1998) discussed the conditions under which the He
line could form, and found that its time evolution was at odds
with the observed one. They therefore favoured either Mg or Si.
A Mg II identification was also claimed by Wheeler et al. (1998).
SN 1999ee shows an emission line at 12300 Å which
Rudy et al. (2002) identified as due to Fe III in the spectra of
SN 2000cx. The presence of this feature in those SNe is due to
their higher photospheric temperature. As expected, it is absent
in the spectra of both SN 2002dj and SN 2002bo.

The -5.9 day spectrum of SN 2002dj shows a feature around 12100 Å (Fig. 19) which was not visible in the earliest spectrum (cf. Fig. 17). Marion et al. (2003) identified this feature as a blend of several Ca II lines between 12430 Å and 12830 Å. Like for the Mg II line, the blueshift of the Ca II minimum is larger in SN 2002dj than in all other SNe. Finally at 20800 Å a weak emission is visible in the spectra of SN 2002dj, SN 2003du and SN 2003cg attributed to Si III by Wheeler et al. (1998).
Following Rudy et al. (2002) we fitted the two earliest IR spectra of SN 2002dj to estimate the black body temperature. We used only sections of the spectrum free of telluric features or absorption lines. Assuming =0.096 for SN 2002dj we obtain T=11900 K at -8.5 days compared with T=12900 K and T=23500 K for SN 1994D and SN 1999ee reported in Fig. 18. For the latter two SNe we assumed =0.06 0.02 (Patat et al., 1996) and =0.30 0.04 (Stritzinger et al., 2002), respectively. The high temperature of SN 1999ee () is consistent with the presence of the Fe III emission feature in its spectrum. It is also similar to the 25000 K temperature of SN 2000cx (Rudy et al., 2002) taken at -8.0 days, which shows a stronger Fe III emission than SN 1999ee. This gives us confidence that the technique provides reliable results, when applied to early time spectra. The sequence of increasing temperature from SN 2002dj to SN 1999ee confirms the results obtained from (Si II) (Fig. 15). Indeed, for the SN 2002dj at -5.9 days we found a much higher temperature (T=20500 K). This confirms its fast rise as traced by the (Si II) and the appearance of a Si III line in the band in the spectrum of SN 2002dj.
Rudy et al. (2002) proposed that the black body IR spectrum fit can be used to derive also an estimate of absorption. We note, however, that the resulting surface for temperature and colour excess is nearly flat providing only weak constraints. At +17 days we see that several lines populate the IR spectrum of SN 2002dj and those of other SNe (Fig. 20). In particular, a broad P-Cygni feature attributed to Fe II (Marion et al., 2003) is observed at 12350 Å. In SN 2002dj the blueshift of its minimum is roughly the same as in SN 2003cg and SN 2002er, while SN 1999ee displays higher velocities. Finally, Marion et al. (2003) suggested that the minimum around 15000 Å defines the transition from partial to complete silicon burning. The fact that the velocities inferred by the position of this minimum is the same in SN 2002dj, SN 2003cg and SN 2002er indicate that these SNe have an iron core of similar size.

8 Expansion velocities
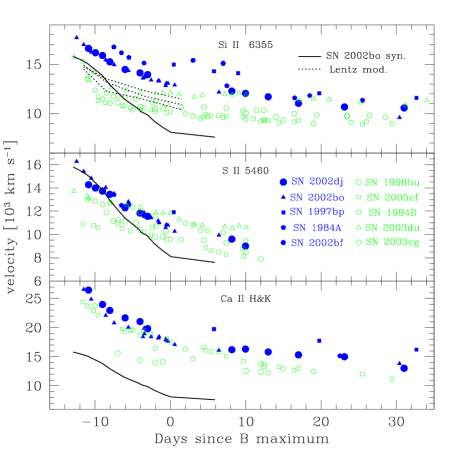
In Fig. 21 we show the expansion velocities measured from the blueshift of the minima of the Si II (6355 Å), S II (5460 Å) and Ca II (H&K). It is evident that at early epochs the HVG SN 1984A, SN 1997bp, SN 2002bo and SN 2002dj are faster than LVG SNe in all those lines. The two groups are separated most strongly in Si II velocity. Nevertheless, as noted by Jeffery & Branch (1990) strong features like Si II (6355 Å) reliably trace the photospheric velocity only at early epochs, when the mass above the photosphere is small. For HVG SNe like SN 2002dj and SN 2002bo, where Si II is particularly strong and where high velocity features could play an important role (Mazzali et al, 2005), this is unlikely even at very early times. In SN 2002bo for example the photospheric evolution computed by Stehle et al. (2005) even at -13 days has a velocity 2000 km s-1 lower than that measured from the minimum of the Si II line (cf. Fig. 21 upper panel). The relatively weak S II (5460 Å) seems to be a better tracer of the photospheric velocity. In HVG SNe this feature is at higher velocities than in LVG SNe, but due to its steep velocity decline it approaches the LVG group already before maximum. If we take S II as a proxy for the photospheric velocity, its evolution may indicate that at very early epochs the photosphere in HVG SNe is located at larger radii than in LVG SNe, but moving inward more quickly, it reaches a comparable position already before maximum. For Ca II (H&K), some LVG SNe closely resemble the velocity evolution of HVG SNe, making this feature unsuitable to separate the two groups.
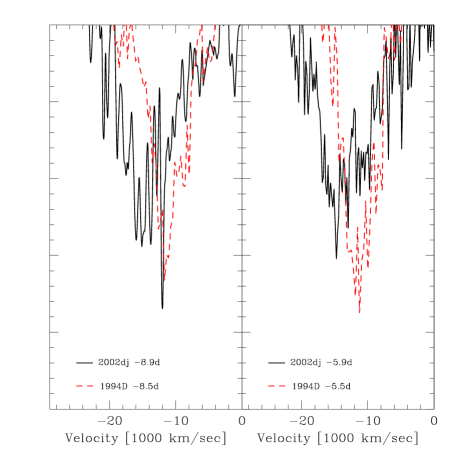
In the case of Mg II (10926 Å), the expansion velocity measured from the absorption minimum at -8.5 days is 15000 km s-1 for SN 2002dj and SN 2002bo and significantly slower (11000 km s-1) for SN 1994D. The feature appears deeper in SN 1994D than in SN 2002dj (Fig. 22). We do not observe a change in the line velocity from the first to the second epoch in both SNe and infer that even earlier than one week before maximum the photosphere is below the magnesium layer. Since Mg II is produced in the outer layers by oxygen burning (Wheeler et al., 1998), this means that only IR spectra observed earlier than this may tell us about the boundary between explosive carbon and oxygen burning. Nevertheless, we note in Fig. 22 that the blue wing of the Mg II line extends up to 19000 km s-1 in SN 2002dj and only up to 15000 km s-1 in SN 1994D. Hence, the burning front must have propagated further out in SN 2002dj than in SN 1994D.
9 Spectral Modelling
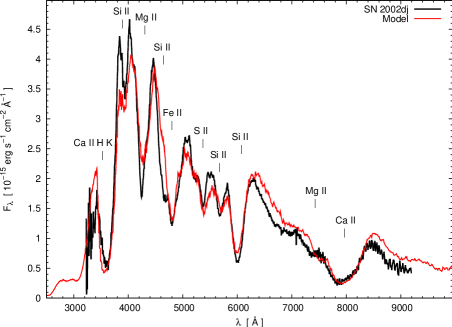
9.1 Early phase
We modeled the earliest spectrum of SN 2002dj obtained 10.9 days before B maximum using the Montecarlo code described in Mazzali & Lucy (1993), Lucy (1999) and Mazzali (2000), modified to include abundance stratification as described in Stehle et al. (2005). While a good fit to the overall spectrum can be obtained for the input parameters reported in the caption of Fig. 23, it is not possible with the density structure of W7 (Nomoto, Thielemann & Yokoi, 1984) to reproduce the high velocity features. One modification that we adopted here to overcome this is to increase the mass at high velocity. In particular, we assume the presence of 0.04 of material at velocities above 18000 km s-1. This may be caused by interaction of the outer ejecta with circumstellar material. Tanaka et al. (2008) discuss this and other possibilities in detail. Let us note that the model suffers only to a minor degree from the problem of overfitting the flux to the red of the Si II (6355 Å) line suggesting high line opacity in all regions. This can not be the case for SN 2002bo where the observed spectrum is noticeably below the model (Stehle et al., 2005).
Finally, we note that the spectral modelling seems to exclude the presence of C II in the earliest spectrum of SN 2002dj. The presence of this high velocity feature was found in the -9 days spectrum of SN 1998aq (Branch et al., 2003) and in the spectra of SN 2006gz from -14 to -10 days (, 2007). High velocity C II (6578 Å) in the -14 days spectrum of SN 1990N was also claimed by Fisher et al. (1997), although Mazzali et al. (2001) showed that a high-velocity component of Si II (6355 Å) was another viable identification. Moreover, the presence of small quantities of carbon has been shown to improve the fit of the very early spectra of SN 1994D (Branch et al., 2005), SN 2001el and SN 2003du (Tanaka et al., 2008). The latter SN Ia all are LVG SNe, therefore the absence of C II in the -10.9 days spectrum of SN 2002dj and in the -12.9 days spectrum of SN 2002bo (Stehle et al., 2005) could indicate that the carbon burning has penetrated further out in these explosions (Stehle et al., 2005).
9.2 Nebular phase
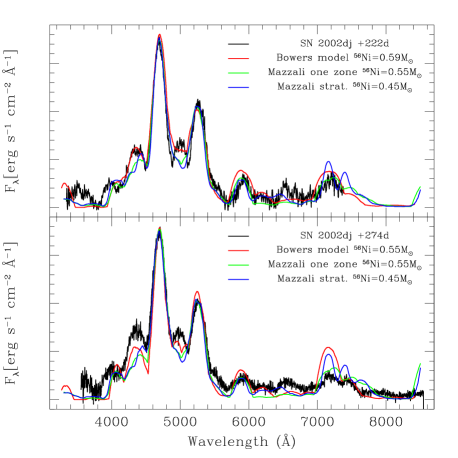
In order to estimate the errors on the 56Ni mass estimate obtained by modelling nebular spectra, we generated a set of synthetic spectra computed using two different codes and two different assumptions of the 56Ni mass distribution. The six synthetic spectra together with the two observed spectra of SN 2002dj are presented in Fig. 24. Both codes assume line-formation in non-local thermodynamic equilibrium (non-LTE) conditions. The code described in Bowers et al. (1997) assumes a uniform density, homologously expanding sphere containing iron, cobalt and sulphur, with relative abundances modulated by the radioactive decay. In computing the SED only singly and doubly-ionized species are considered because they are predicted to dominate the spectrum. The code described in Mazzali et al. (2001) can use either a homologously expanding nebula of finite extent, uniform density and composition, as in Bowers et al. (1997), or stratification in density and abundance (Mazzali et al., 2007). In this case, the density profile is taken from the explosion model W7 (Nomoto, Thielemann & Yokoi, 1984). -rays and positrons are emitted at various depths according to the distribution of 56Ni and their propagation and deposition is followed using a Monte Carlo scheme similar to that discussed by Cappellaro et al. (1997) for their light-curve models. Gas heating and cooling as well as line emissivity are computed in non-LTE in each radial shell, and the line profiles are computed assuming each shell to contribute to a truncated parabola, with an inner truncation point corresponding in velocity to the inner boundary of the shell considered. The sum of these truncated parabolas is the emerging spectrum. Constant -ray ( cm2 g-1) and positron opacities ( cm2 g-1) are assumed in both cases.
The synthetic spectra yield slightly different results for the 56Ni mass, reflecting the different spectral calibrations and code assumptions. The Bowers et al. (1997) model gives a 56Ni mass of 0.59 M☉ and 0.55 M☉ for the +222d and +274d spectra, respectively, while the one-zone model from Mazzali et al. (2001) yields 0.55 M☉ for both epochs. With the Mazzali et al. (2007) stratified model we obtain 0.45 M☉ for both spectra. Results obtained with the same code on the two different epochs are consistent, indicating the robustness of the fit. On the other hand, both one-zone models yield a 56Ni mass slightly larger than the stratified model. Ruiz-Lapuente et al. (1995) found similar results with their stratified nebular model as opposed to the one-zone model (Ruiz-Lapuente & Lucy, 1992). The main difference between the models is that in the one-zone codes the 56Ni density is uniform, while in the stratified code it is higher near the centre, which leads to a higher -ray deposition at late times and reduces the 56Ni mass necessary to produce a given luminosity. The 56Ni mass obtained with the stratified model is in excellent agreement with the one obtained from the light curve, suggesting that this assumption provides a good description of the physical conditions in the nebula.
10 Discussion and conclusion
We have presented optical and IR photometric and spectroscopic observations of the HVG Type Ia SN 2002dj. The ejecta kinematics of this object are very similar to that of SN 2002bo. The direct comparison of the line shapes and strengths of the two objects reveals an even more impressive similarity. The one obvious distinction is a peculiar flux deficit redward of 6500 Å in SN 2002bo.
The light curves are nearly identical with the notable exception of the band at epochs later than +40 days. However, the colours are remarkably different. SN 2002bo is much bluer confirming the lack of flux redward of 6500 Å. Finally, also the bolometric absolute luminosity around maximum of the two objects turns out to be very similar. The IR contribution is in in fact very small at those epochs (Suntzeff, 1996).
Starting from the photometric similarities of SN 2002dj and SN 2002bo, we studied the characteristics of other HVG SNe. Although the number of objects for which reliable multi-band photometry covering both very early and late light curves phases is limited, the HVG SNe analyzed in this paper seem to share the following photometric characteristics if compared with LVG SNe:
-
1)
A general fast rise to maximum brightness in all filters
-
2)
More pronounced inflections in the and bands around +25 days
-
3)
A brighter, more slowly declining light curve after +40 days
-
4)
Possibly different colours
To complete the picture these properties should be combined with parameters one can derive from the spectral evolution:
-
1)
Fast expanding ejecta
-
2)
Strong absorption due to intermediate mass elements (IME) at early phases
-
3)
Absence of carbon in the very early spectra
-
4)
Early time low photospheric temperature rapidly increasing toward maximum brightness
-
5)
Nebular spectra with kinematics not so different or even slower than that of LVG SNe.
Benetti et al. (2004) suggested that the high expansion velocities of IME are due to the fact that in HVG SNe the burning front extends further out into the outermost layers than in LVG SNe. This hypothesis is supported by the extension of the blue wing of the Mg II line at velocities close to 19000 km sec-1 observable in the early IR spectra of SN 2002dj and by the absence of carbon in the -10.9 spectrum of SN 2002dj and -12.9 spectrum of SN 2002bo. In this scenario the density of IME is enhanced in the layers where usually unburned carbon and oxygen are present. The IME density enhancement in the outermost layers would induce stronger absorptions at early epochs and increase the opacity in these regions, moving the photosphere to larger radii. The blending between high velocity features and the photospheric component could also contribute to the absorption enhancement (Tanaka et al., 2008). Since the photosphere is located at high velocity shells, this could justify both the fast rise to maximum observed in the light curve and, because the heating produced by the rays is less effective, the lower temperature in the line forming region. Due to their high velocity the density in those shells decreases rapidly and hence the photosphere quickly recedes into the ejecta. Indeed, around maximum, the light curves of SN 2002dj, SN 2002bo and SN 2006X approached those of LVG SNe. Also the temperature is nearly identical as traced by the (Si II) evolution and by the appearance of the Si III lines, the absorption minimum of which is at the same position in all SNe. The initially low and then rapidly increasing temperature of SN 2002dj was confirmed by fitting a black body to its two earliest IR spectra.
We note that in HVG SNe more pronounced inflections in the and light curves around +25 days seem to correlate with expansion velocities. The fastest expanding SN 1997bp, SN 2002bf and SN 2006X display a stronger inflection than in SN 2002bo and SN 2002dj, where the effect is barely visible. We must stress that in the case of SN 2006X, due to the large reddening, the intensity of this feature has to be taken with caution. Also the brighter light curve after +40 days seems to correlate with the expansion velocity. Wang et al. (2008b) suggested that SN 2006X declined more slowly after +40 days and could be due to a light echo produced by the circumstellar dust. In the case of SN 2002dj there is no clear evidence of dust obscuring its light. but it is also the HVG SNe with the light curve closer to “normal” SNe Ia. Nevertheless, SN 1997bp and especially SN 2002bf with low absorption closely resemble the behavior of SN 2006X having also comparable expansion velocities. Moreover, part of the reddening estimated for those SNe could be biased due to their peculiar colour and colours evolution.
Regarding the colours of HVG SNe we note that Dominguez, Höflich & Straniero (2001) using a set of Delayed Detonation models (DD) have found that increasing the metallicity of the progenitor white dwarf, the colour of the resulting SN Ia becomes redder. Unfortunately, this study does not extend the results to other bands and is limited to a metallicity Z=0.02. However, Timmes, Brown & Truran (2003) have proposed that the effect of the progenitor metallicity is significantly enhanced at solar metallicity and above. In particular Fig. 9 of Dominguez et al. (2001) shows that passing from Z=0.001 to Z=0.02 the flux in is depressed, while that in is enhanced. If this is maintained at higher metallicity it could be the source of the red and blue colours we found in SN 2002bo, SN 1997bp and especially SN 2002dj where the effect of reddening should be negligible. Furthermore, Timmes et al. (2003) have pointed out that in metal rich progenitors due to the more efficient electron capture, more 54Fe and 58Ni are produced at the expense of 56Ni. Mazzali & Podsiadlowski (2006) used this finding to explore the effect on spectra and light curves by varying the fraction of 54Fe and 58Ni produced in burning to nuclear statistical equilibrium and concluded that the colours of SN Ia with a larger fraction of these elements (i.e. the more metal rich ones) have redder colour. Moreover, indications of larger 54Fe and 58Ni and lower 56Ni production for the HVG SN 1981B, SN 2002bo and SN 2002dj with respect the similar LVG SN 1990N, SN 2003du and SN 2003cg have been found by Mazzali et al. (2007). Lentz et al. (2000) pointed out that increasing the abundance of all elements heavier than oxygen in the unburned C+O layer of the pure deflagration model W7 (Nomoto, Thielemann & Yokoi, 1984) leads to a larger blueshift of SN Ia absorption lines. This is due to the fact that the higher opacity provided by the large amount of metals confines the line forming region to the outer (faster) part of the ejecta. Although, this supports the hypothesis of metal rich progenitors for HVG SNe, we favour the configuration with an extended burning front to explain the HVG SNe observables.
To further complicate the picture we must mention that Höflich, Wheeler & Thielemann (1998) found that SN Ia with metal rich progenitors should have a slower rise time to maximum than metal poor ones clearly contrary to what we found of SN 2002dj, SN 2002bo and SN 2006X. Given the very small sample of HVG SNe, the uncertainties afflicting their colours and the model shortcomings we briefly recapped here, our suggestion of metal rich progenitor for HVG SNe are tentative and provide possible avenues to explore when more data on HVG SNe and more sophisticated models will be available.
Fast expanding SNe are rare both at low and high redshift (Blondin et al., 2006; Balland et al., 2007; Hook et al., 2005). The systematic error they could introduce into cosmological studies due to their peculiar colours appears to be negligible. Detailed analysis will become possible when a larger sample of well-observed rapidly evolving SNe Ia will be available.
Acknowledgments
G.P acknowledges support by the Proyecto FONDECYT 3070034. This work was also supported by the European Community’s Human Potential Programme under contract HPRN-CT-2002-00303, “The Physics of Type Ia Supernovae”. It is partially based on observations made with ESO Telescopes under programme ID 169.D-0670. This work is also based on observations performed at the Jacobus Kapteyn Telescope (JKT) and the Isaac Newton Telescope of the Isaac Newton Group at La Palma, Spain, the Nordic Optical Telescope at La Palma, Spain, and the 0.9m, 1.0m telescopes at Cerro Tololo Interamerican Observatory. A.C., M.H. and J.M. acknowledge support from Centro de Astrofisica FONDAP 15010003, and Núcleo Milenio P06-045-F funded by Programa Bicentenario de Ciencia y Tecnología from CONICYT and Programa Iniciativa Científica Milenio from MIDEPLAN. A.C. also acknowledges support from Proyecto FONDECYT 1051061. M.H. further acknowledges support from Proyecto FONDECYT 1060808. SB, EC and MT are supported by the Italian Ministry of Education via the PRIN 2006 n.2006022731 002. This work has made use of the NASA/IPAC Extragalatic database (NED) which is operated by the JET Propulsion Laboratory, California Institute of Technology, under contract with the US National Aeronautic and Space Administration.
References
- Altavilla et al. (2004) Altavilla G. et al., 2004, MNRAS, 349, 1344
- Astier et al. (2006) Astier et al., 2006, A&A, 447, 31
- Baldwin & Stone (1984) Baldwin J. A., Stone R. P. S., 1984 MNRAS, 206, 241
- Balland et al. (2007) Balland C. et al., 2007, A&A, 464, 827
- Benetti et al. (2004) Benetti S. et al., 2004, MNRAS, 348, 261
- Benetti et al. (2005) Benetti S. et al., 2005, ApJ, 623, 1011
- Bertola et al. (1993) Bertola F., Burstein D., Buson L. M., 1993, ApJ, 403, 573
- Bessell (1990) Bessell M. S., 1990, PASP, 102, 1181
- Blondin et al. (2006) Blondin S. et al. 2006, AJ, 131, 1648
- Bowers et al. (1997) Bowers E. J. C., Meikle, W. P. S., Geballe T. R., Walton N. A., Pinto P. A., Dhillon V. S., Howell S. B., Harrop-Allin M. K., 1997, MNRAS, 290, 663
- Branch & van den Bergh (1993) Branch D., van den Bergh S., 1993, AJ, 105, 2231
- Branch et al. (2003) Branch D., 2003, AJ, 126, 1489
- Branch et al. (2004) Branch D., 2004, ApJ, 606, 413
- Branch et al. (2005) Branch D., Baron E., Hall N., Melakayil M., Parrent J., 2005, PASP, 117, 545
- Branch et al. (2006) Branch D. et al., 2006, PASP, 118, 560
- Buson et al. (2004) Buson L. M., Bertola, F., Bressan A., Burstein D., Cappellari M., 2004, A&A, 423, 965
- Cappellaro et al. (1997) Cappellaro E., Mazzali P. A., Benetti S., Danzinger I. J., Turatto M., Della Valle M., Patat F., 1997, A&A, 328, 203
- Carollo & Danziger (1994) Carollo, C. M., Danziger, I. J., 1994, MNRAS, 270, 743
- Contardo et al. (2000) Contardo G., Leibundgut B., Vacca W. D., 2000, A&A, 359, 876
- Davies et al. (1987) Davies R. L., Burstein D., Dressler A., Faber S. M., Lynden-Bell D., Terlevich R. J., Wegner, G., 1987, ApJS, 64, 581
- Dominguez, Höflich & Straniero (2001) Dominguez I, Höflich P., Straniero O., 2001, ApJ, 557, 279
- Elias-Rosa et al. (2006) Elias Rosa N. et al., 2006, MNRAS, 369, 1880
- Elias-Rosa et al. (2008) Elias Rosa N. et al., MNRAS, 384, 107
- Fisher et al. (1997) Fisher A., Branch D., Nugent P., Baron E., 1997, ApJ, 481, L89
- Fort et al. (1986) Fort B. P., Prieur J.-L., Carter D., Meatheringham S. J., Vigroux, L., 1986, ApJ, 306, 110
- Freedman et al. (2001) Freedman W. L. et al., 2001, ApJ, 553, 47
- Garavini et al. (2007) Garavini G. et al., 2007, A&A, 471, 527
- Garnavich et al. (2004) Garnavich M. P. et al., 2004, AJ, 613, 1120
- Goldhaber et al. (2001) Goldhaber G. et al., 2001, ApJ, 558, 359
- Goudfrooij et al. (1994a) Goudfrooij P., Hansen L., Jorgensen, H. E., Norgaard-Nielsen H. U., de Jong T., van den Hoek L. B., 1994a A&AS, 104, 179
- Goudfrooij et al. (1994b) Goudfrooij P., Hansen L., Jorgensen, H. E., Norgaard-Nielsen H. U., 1994b A&AS, 105, 341
- Guy et al. (2005) Guy J., Astier P., Nobili S., Regnault N., Pain R., 2005, A&A, 443, 781
- Hamuy et al. (1992) Hamuy M., Walker A. R., Suntzeff N. B., Gigoux P., Heathcote S. R., Phillips M. M., 1992, PASP, 104, 533
- Hamuy et al. (1994) Hamuy M., Suntzeff N. B., Heathcote S. R., Walker A. R., Gigoux P., Phillips M. M., 1994, PASP, 106, 566
- Hamuy et al. (1996) Hamuy M., Phillips M. M., Suntzeff N. B., Schommer R. A., Maza J., Smith R. C., Lira P., Aviles R., 1996, AJ, 112, 2438
- Hamuy et al. (2000) Hamuy M., Trager S. C., Pinto P. A., Phillips M. M., Schommer R. A., Ivanov V., Suntzeff N. B., 2000, AJ, 120, 1479
- Hamuy et al. (2002) Hamuy M. et al., 2002, AJ, 124, 417
- Hatano et al. (2000) Hatano K., Branch D., Lentz E. J., Baron E., Filippenko A. V., Garnavich P. M., 2000, ApJL, 543, L49
- Hernandez et al. (2000) Hernandez M. et al., 2000, MNRAS, 319, 223
- (40) Hicken M., Garnavich P. M., Prieto J. L., Blondin S., DePoy D. L., Kirshner R. P., Parrent J., 2007, ApJ, 669, L17
- Hilker & Kissler-Patig (1996) Hilker M., Kissler-Patig M., 1996, A&A, 314, 357
- Höflich, Wheeler & Thielemann (1998) Hoeflich P., Wheeler J. C., Thielemann F. K., 1998, ApJ, 495, 617
- Hook et al. (2005) Hook I. M. et al., 2005, AJ, 130, 2788
- Hutchings & Li (2002) Hutchings D., Li W. D.2002 IAUC, 7918, 1
- Jeffery & Branch (1990) Jeffery D. J., Branch D., 1990, in J.C. Wheeler, T. Piran, S. Weinberg eds. Proc. Jerusalem Winter School for Theoretical Physics. World Scientific Publishing Co. p. 149
- Jha et al., Suntzeff et al. (1999) Jha S. et al., 1999, ApJS, 125, 73
- (47) Jha S. et al., 2006, AJ, 131, 527
- Kim et al. (1988) Kim, D. W., Jura M., Guhathakurta P., Knapp G. R., van Gorkom J. H., 1988, ApJ, 330, 684
- King (1985) King D. L., 1985, RGO/La Palma technical note N∘ 31.
- Kotak et al. (2005) Kotak R. et al., 2005, A&A, 436, 1021
- Kraan-Korteweg (1986) Kraan-Korteweg R. C., 1986, A&AS, 66, 255
- Krisciunas et al. (2003) Krisciunas K. et al., 2003, AJ, 125, 166
- (53) Krisciunas K., Phillips M. M., Suntzeff N. B., 2004, AJ, 602, L81
- Krisciunas et al. (2004a) Krisciunas K. et al., 2004a, AJ, 127, 1664
- Krisciunas et al. (2004b) Krisciunas K. et al., 2004b, AJ, 128, 3034
- Landolt (1992) Landolt A. U., 1992, AJ, 104, 340
- Leibundgut (1988) Leibundgut B., 1988, Ph.D. thesis, Univ. Basel
- Lentz et al. (2000) Lentz E. J., Baron E., Branch D., Hauschildt P. H., Nugent P. E., 2000, Apj, 530, 966
- Leonard et al. (2005) Leonard D. C., Li W., Filippenko A. V., Foley R. J., Chornock R., 2005, ApJ, 632, 450
- Leonardi & Worthey (2000) Leonardi A. J., Worthey G., 2000, AJ, 534, 650
- Lucy (1999) Lucy L. B., 1999, A&A,345, 211
- Maiolino, Rieke & Rieke (1996) Maiolino R., Rieke G. H., Rieke M. J., 1996, AJ, 111, 537
- Marion et al. (2003) Marion G. H., Höflich P., Vacca W. D., Wheeler J. C., 2003, ApJ, 591, 316
- Mazzali & Lucy (1993) Mazzali P. A., Lucy L. B., 1993, A&A, 279, 477
- Mazzali & Lucy (1998) Mazzali P. A., Lucy L. B., 1998, MNRAS 295, 428
- Mazzali (2000) Mazzali P., 2000, A&A, 363, 705
- Mazzali et al. (2001) Mazzali P. A., Nomoto K., Patat F., Maeda K., 2001, ApJ, 559, 1047
- Mazzali et al (2005) Mazzali P. et al., 2005, ApJ, 623, L37
- Mazzali & Podsiadlowski (2006) Mazzali P. A., Podsiadlowski F., 2006, MNRAS, 369, L19
- Mazzali et al. (2007) Mazzali, P. A., Röpke F. K., Benetti S., Hillebrandt W., 2007, Science, 315, 825
- Meikle et al. (1996) Meikle W. P. S. et al., 1996, MNRAS, 281, 263
- Miknaitis et al. (2007) Miknaitis G. et al., 2007, ApJ, 666, 674
- Nobili et al. (2003) Nobili S., Goobar A., Knop R., Nugent P., 2003, A&A, 404, 901
- Nomoto, Thielemann & Yokoi (1984) Nomoto K., Thielemann F.-K., Yokoi K., 1984, ApJ, 1984, 286, 644
- Nugent et al. (1995) Nugent P., Phillips M., Baron E., Branch D., Hauschildt P., 1995, ApJ, 455, L147
- Pastorello et al. (2007) Pastorello A. et al., 2007, MNRAS, 376, 1301
- Patat et al. (1996) Patat F., Benetti S., Cappellaro E., Danziger I. J., della Valle M., Mazzali P. A., Turatto M., 1996, MNRAS, 278, 111
- Perlmutter et al. (1997a) Perlmutter S. et al., 1997a, in Thermonuclear Supernova, ed. P. Ruiz-Lapuente, R. Canal, & J. Isern (Dordrecht:Kluwer), p. 749
- Perlmutter et al. (1997b) Perlmutter S. et al, 1997b, ApJ, 483, 565
- Persson et al. (1998) Persson S. E., Murphy D. C., Krzeminski W., Roth M., Rieke M. J., 1998, AJ, 116, 2475
- Phillips (1993) Phillips M. M., 1993, ApJ, 413, 105
- Phillips et al. (1999) Phillips M. M., Lira P., Suntzeff N. B., Schommer R. A., Hamuy M., Maza J., 1999, AJ, 118, 1766
- Pignata et al. (2004) Pignata G. et al., 2004, MNRAS, 355, 178
- Pskovskii (1984) Pskovskii, Yu. P., 1984, Soviet Astronomy, 28, 658
- Prieto, Rest & Suntzeff (2006) Prieto J. L., Rest A., Suntzeff B. N., 2006, AJ, 647, 512.
- Riess, Press & Kirshner (1996) Riess A. G., Press W. H., Kirshner R. P., 1996, ApJ, 473, 88 R. P.
- Riess (1998) Riess A. G. et al., 1998, AJ, 116, 1009
- Riello et al. (2002) Riello M., Benetti S., Altavilla G., Pastorello A., Turatto M., Cappellaro E., O’Toole S., 2002 IAUC, 7919, 1
- Rothberg & Joseph (2006) Rothberg B., Joseph R. D., 2006, AJ, 131, 185
- Rudy et al. (2002) Rudy R. J., Lynch D. K., Mazuk S., Venturini C. C., Puetter R. C., Höflich, P., 2002, ApJ, 565, 413
- Ruiz-Lapuente & Lucy (1992) Ruiz-Lapuente P. & Lucy L. B., 1992, ApJ, 400, 127
- Ruiz-Lapuente et al. (1995) Ruiz-Lapuente P., Kirshner R. P., Phillips M. M., Challis P. M., Schmidt B. P., Filippenko A. V., Wheeler, J. C., 1995, ApJ, 439, 60
- Schlegel, Finkbeiner & Davis (1998) Schlegel D. J., Finkbeiner D. P., Davis M., 1998, ApJ, 500, 525
- Schweizer et al. (1990) Schweizer F., Seitzer P., Faber S. M., Burstein D., alle Ore C. M., Gonzalez J. J., 1990, ApJL, 364, L33-L36
- Shortridge (1995) Shortridge K., Meatheringham S. J., Carter B. D., Ashley M. C. B., 1995, Astron. Soc. of Australia. Proceeding v.12:2, p. 244
- Stanishev et al. (2007) Stanishev V. el al., 2007, A&A, 469, 645
- Stehle et al. (2005) Stehle, M., Mazzali, P. A., Benetti, S., Hillebrandt, W., 2005, MNRAS, 360, 1231
- Stone & Baldwin (1983) Stone R. P. S., Baldwin J. A., 1983 MNRAS, 204, 347
- Stritzinger et al. (2002) Stritzinger M. et al., 2002, AJ, 124, 2100.
- Stritzinger et al. (2005) Stritzinger M., Suntzeff N. B., Hamuy M., Challis P., Demarco R., Germany L., Soderberg A. M., 2005, PASP, 117, 810
- Stritzinger & Sollerman (2007) Stritzinger M. & Sollerman J., 2007, A&A, 470, L1
- Sullivan et al. (2006) Sullivan M. et al., 2006, ApJ, 648, 868
- Suntzeff (1996) Suntzeff N. B., 1996, in R. McCray & Zhenru Wang eds. Proc. IAU Colloq. Supernovae and supernova remnants. Cambridge University Press, Cambridge, p. 41
- Suntzeff et al. (1999) Suntzeff, N. B. et al., 1999, AJ, 117, 1175
- Tanaka et al. (2008) Tanaka .M et al., 2008, ApJ, 677, 448
- Timmes, Brown & Truran (2003) Timmes F. X., Brown E. F., Truran J. W., 2003, ApJ, 590, L83
- Tully (1988) Tully R. B., 1988, Nearby Galaxies Catalog, Cambrige University Press.
- Turatto et al. (2003) Turatto M., Benetti S., Cappellaro E., 2003, in the proceedings to the ESO/MPA/MPE Workshop (an ESO Astrophysics Symposium) From Twilight to Highlight: The Physics of Supernovae, eds. B. Leibundgut and W. Hillebrandt Springer-Verlag, Heidelberg, p. 200
- Wang et al. (2003) Wang L., Goldhaber G., Aldering G., Perlmutter S., 2003, ApJ, 590, 944
- Wang et al. (2005) Wang X., Wang L., Xu Z., Yu-Qing L., Zongwei Li, 2005, AJ, 620, L87
- Wang et al. (2006) Wang L., Baade D., Hoeflich P., Wheeler J. C., Kawabata K., Khokhlov A., Nomoto K., Patat F., 2006, AJ, 653, 490
- Wang et al. (2008a) Wang X. et al., 2008a, ApJ, 675, 626
- Wang et al. (2008b) Wang X., Li W., Filippenko A. V.; Foley R. J., Smith N., Wang L., 2008, ApJ, 677, 1060
- Wheeler et al. (1998) Wheeler J. C., Hoeflich P.,Harkness R. P., Spyromilio J., 1998, ApJ, 496, 908
- Wood-Vasey et al. (2007) Wood-Vasey W. M. et al., 2007, ApJ, 666, 694
- Woosley et al. (2007) Woosley S. E., Kasen D., Blinnikov S., Sorokina E., 2007, ApJ, 662, 487
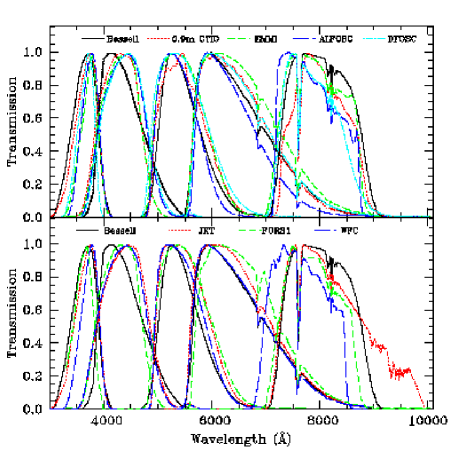
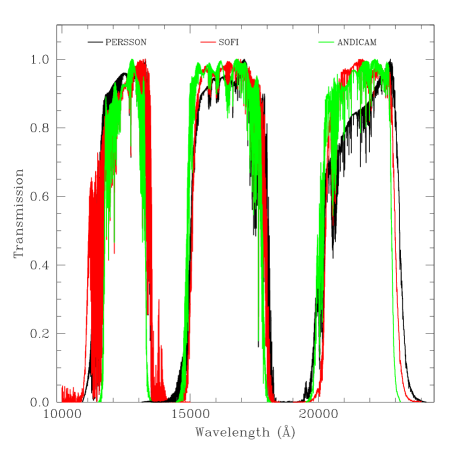
Appendix A S-correction
To avoid the well known limitations of the colour equation to calibrate SN, we used the following calibration path to transform the SN instrumental magnitude into a standard photometric system. To simplify the explanation of the various steps, we will discuss as an example the calibration of the band and we will use only one of the local standard stars. First one needs to transform the standard magnitude of the sequence star in the natural photometric system of the instrument using the following formula:
| (1) |
where and are the standard magnitude of the local standard star, while is the colour term. Then one computes the instrument zero point in the natural photometric system =, where is the local standard star instrumental magnitude.
Finally we calibrated the magnitude of the SN using the equation:
| (2) |
where is the instrumental magnitude of the SN. We did not correct for atmospheric absorption because we assume that the SN and local standard stars are at the same airmass and hence the absorption is already included in . We define as the difference between the synthetic magnitude of the SN computed using the standard and the natural system passbands.
| (3) |
with:
| (4) |
| (5) |
where is the photon number distribution of the SN, and are the instrumental and standard passbands. In the equations 4 and 5, is used instead of because CCD and IR detector are photon counting devices. The Bessell (1990) passbands were also reported in photon unit dividing the original ones for the wavelength, while the Persson et al. (1998) bands are already in photon units. Since in the spectra which are used to compute the synthetic magnitudes the flux is expressed in energy units, becomes:
| (6) |
The zero points and were computed using a subset of spectrophotometric standard stars for which accurate photometry is available. In particular, for the standard magnitude was used directly, while for the magnitudes were previously reported in the instrument natural photometric system using equation (1). Putting together equations 1, 2 and 3 we obtain:
| (7) |
| syb | phc | sy | ph | sy | ph | sy | ph | sy | ph | |
|---|---|---|---|---|---|---|---|---|---|---|
| CTIO 0.9m | 0.062(0.035)a | 0.098(0.013) | 0.092(0.007) | 0.094(0.007) | 0.018(0.001) | 0.016(0.003) | 0.010(0.001) | 0.013(0.009) | 0.004(0.001) | 0.004(0.004) |
| ALFOSC | 0.093(0.006)a | 0.076(0.045) | 0.032(0.003) | 0.057(0.016) | 0.046(0.002) | 0.052(0.007) | 0.065(0.002) | 0.072(0.020) | 0.041(0.002) | 0.065(0.029) |
| DFOSC | 0.058(0.006)a | 0.029(0.016) | 0.068(0.003) | 0.089(0.004) | 0.013(0.002) | 0.013(0.007) | 0.026(0.001) | 0.009(0.015) | 0.048(0.001) | 0.060(0.036) |
| JKT | 0.072(0.050) | 0.026(0.019) | 0.066(0.006) | 0.085(0.032) | 0.030(0.001) | 0.028(0.035) | 0.003(0.001) | 0.039(0.023) | 0.056(0.004) | 0.018(0.030) |
| WFC | 0.077(0.021) | 0.059(0.032) | 0.031(0.006) | 0.063 | 0.010(0.001) | 0.007(0.029) | 0.013(0.001) | 0.000(0.014) | 0.197(0.004) | 0.210(0.004) |
| FORS1 | 0.083(0.007) | 0.083(0.009) | 0.040(0.002) | 0.033(0.010) | 0.080(0.002) | 0.066(0.010) | 0.034(0.004) | 0.031(0.005) | ||
| EMMI | 0.067(0.006) | 0.045(0.005) | 0.017(0.001) | 0.056(0.023) | 0.067(0.001) | 0.044(0.009) | 0.047(0.001) | 0.038 |
a Modified band.
b Colour term computed using synthetic photometry.
c Colour term computed using photometric standard.
| sy | ph | sy | ph | sy | ph | |
|---|---|---|---|---|---|---|
| SoFi | 0.020 | 0.007 | 0.022 | 0.006 | 0.006 | 0.023 |
| ANDICAM | 0.035 | 0.028(0.005) | 0.009 | 0.010(0.005) | 0.000 | 0.003(0.005) |
| date | M.J.D. | Phasea | U | B | V | R | I | Instr. |
|---|---|---|---|---|---|---|---|---|
| 13/06/2002 | 52439.0 | -11.0 | 16.01 0.03 | 16.02 0.04 | 15.85 0.03 | 15.64 0.06 | 15.96 0.03 | CTIO 0.9m |
| 14/06/2002 | 52439.9 | -10.1 | 15.68 0.05 | 15.51 0.02 | 15.25 0.03 | 15.43 0.03 | EMMI | |
| 27/06/2002 | 52452.9 | 2.9 | 14.30 0.04 | 14.35 0.03 | 14.17 0.02 | 14.09 0.03 | 14.43 0.05 | WFC |
| 28/06/2002 | 52453.9 | 3.9 | 14.43 0.03 | 14.17 0.01 | 14.11 0.03 | 14.47 0.03 | JKT | |
| 29/06/2002 | 52455.0 | 5.0 | 14.40 0.04 | 14.47 0.02 | 14.19 0.02 | 14.14 0.01 | 14.50 0.04 | JKT |
| 30/06/2002 | 52456.0 | 6.0 | 14.26 0.03 | JKT | ||||
| 02/07/2002 | 52458.0 | 8.0 | 14.68 0.02 | 14.31 0.02 | 14.31 0.03 | 14.64 0.03 | JKT | |
| 03/07/2002 | 52458.1 | 8.1 | 14.85 0.05 | 14.68 0.05 | 14.32 0.03 | 14.29 0.03 | 14.73 0.05 | DFOSC |
| 04/07/2002 | 52460.0 | 10.0 | 15.01 0.02 | 14.83 0.04 | 14.42 0.01 | 14.46 0.04 | 14.96 0.04 | DFOSC |
| 07/07/2002 | 52463.0 | 13.0 | 15.42 0.03 | 15.16 0.02 | 14.62 0.03 | 14.61 0.04 | 15.05 0.04 | DFOSC |
| 09/07/2002 | 52465.0 | 15.0 | 15.75 0.03 | 15.44 0.04 | 14.79 0.02 | 14.70 0.03 | 15.07 0.04 | DFOSC |
| 11/07/2002 | 52467.0 | 17.0 | 16.05 0.01 | 15.61 0.04 | 14.88 0.04 | 14.74 0.05 | 15.04 0.05 | DFOSC |
| 16/07/2002 | 52473.0 | 23.0 | 15.14 0.03 | 14.84 0.03 | 14.83 0.02 | CTIO 0.9m | ||
| 16/07/2002 | 52473.1 | 23.1 | 16.75 0.04 | 16.33 0.04 | 15.17 0.03 | 14.79 0.05 | 14.99 0.02 | DFOSC |
| 19/07/2002 | 52476.0 | 26.0 | 16.97 0.05 | 16.57 0.04 | 15.42 0.03 | 15.03 0.03 | 14.84 0.04 | DFOSC |
| 24/07/2002 | 52479.9 | 29.9 | 16.92 0.05 | 15.54 0.05 | 15.12 0.03 | 14.85 0.01 | ALFOSC | |
| 25/07/2002 | 52481.0 | 31.0 | 17.41 0.03 | 16.97 0.02 | 15.63 0.03 | 15.20 0.03 | 14.90 0.04 | DFOSC |
| 29/07/2002 | 52484.9 | 34.9 | 17.55 0.17 | ALFOSC | ||||
| 08/08/2002 | 52495.0 | 45.0 | 17.33 0.04 | 16.22 0.04 | 15.91 0.03 | 15.74 0.04 | CTIO 0.9m | |
| 31/08/2002 | 52518.0 | 68.0 | 18.38 0.12 | 16.89 0.04 | DFOSC | |||
| 02/09/2002 | 52520.0 | 70.0 | 16.91 0.05 | DFOSC | ||||
| 06/09/2002 | 52524.0 | 74.0 | 17.76 0.19 | 17.05 0.16 | 16.88 0.48 | DFOSC | ||
| 25/03/2003 | 52724.3 | 274.3 | 21.00 0.04 | 20.78 0.03 | 21.30 0.08 | 20.74 0.10 | FORS1 |
a Relative to the time of the maximum brightness M.J.D.=52450 0.7
| date | M.J.D. | Phasea | J | H | K | Instr. |
|---|---|---|---|---|---|---|
| 13/06/2002 | 52439.0 | -11.0 | 15.64 0.05 | 15.64 0.08 | 15.66 0.10 | ANDICAM |
| 14/06/2002 | 52440.0 | -10.0 | 15.27 0.03 | 15.31 0.05 | 15.25 0.08 | ANDICAM |
| 15/06/2002 | 52441.1 | -8.9 | 14.98 0.03 | 15.13 0.03 | 15.09 0.03 | SoFi |
| 19/06/2002 | 52444.1 | -5.9 | 14.63 0.03 | 14.85 0.03 | 14.70 0.03 | SoFi |
| 20/06/2002 | 52446.0 | -4.0 | 14.56 0.09 | 14.82 0.06 | 14.64 0.06 | ANDICAM |
| 24/06/2002 | 52450.0 | -0.0 | 14.60 0.03 | 14.85 0.05 | 14.50 0.09 | ANDICAM |
| 24/06/2002 | 52450.0 | -0.0 | 14.62 0.03 | 14.83 0.03 | 14.54 0.03 | SoFi |
| 27/06/2002 | 52453.1 | 3.1 | 14.88 0.04 | 14.93 0.04 | 14.65 0.07 | ANDICAM |
| 30/06/2002 | 52456.0 | 6.0 | 15.33 0.12 | 15.12 0.08 | 14.85 0.16 | ANDICAM |
| 08/07/2002 | 52464.0 | 14.0 | 16.38 0.07 | 15.09 0.04 | 15.03 0.08 | ANDICAM |
| 11/07/2002 | 52467.0 | 17.0 | 16.36 0.05 | 15.01 0.03 | 14.90 0.05 | ANDICAM |
| 11/07/2002 | 52467.0 | 17.0 | 16.15 0.03 | 14.90 0.03 | 14.87 0.03 | SoFi |
| 14/07/2002 | 52470.0 | 20.0 | 16.19 0.10 | 14.85 0.04 | 14.76 0.06 | ANDICAM |
| 17/07/2002 | 52473.0 | 23.0 | 15.97 0.04 | 14.79 0.03 | 14.66 0.04 | ANDICAM |
| 25/07/2002 | 52481.0 | 31.0 | 15.70 0.05 | 14.81 0.04 | 14.83 0.08 | ANDICAM |
| 28/07/2002 | 52484.0 | 34.0 | 15.75 0.04 | 15.07 0.04 | 15.13 0.05 | ANDICAM |
| 31/07/2002 | 52487.0 | 37.0 | 16.01 0.03 | 15.25 0.06 | 15.45 0.28 | ANDICAM |
| 07/08/2002 | 52494.0 | 44.0 | 16.70 0.09 | 15.62 0.07 | 15.67 0.35 | ANDICAM |
| 10/08/2002 | 52497.0 | 47.0 | 16.79 0.09 | 15.74 0.05 | 15.94 0.12 | ANDICAM |
| 13/08/2002 | 52500.0 | 50.0 | 16.99 0.11 | 15.86 0.05 | 16.05 0.12 | ANDICAM |
| 30/08/2002 | 52517.0 | 67.0 | 18.07 0.38 | 16.61 0.03 | 16.87 0.03 | SoFi |
a Relative to the time of the maximum brightness M.J.D.=52450 0.7
A.1 Band construction
We define the transmission function of a
give passband as:
where is the filter transmission function,
is the detector quantum efficiency, is the
continuum atmospheric transmission profile, is the line
atmospheric transmission profile, is the mirror
reflectivity function, the number of reflections and
is the lens throughput. We downloaded and
from the instrument web sites. For we used a
standard aluminium reflectivity curve, while we did not find information
about the lens transmission for any of the instruments. In the
construction of the atmosphere model the weight of the terms
and change considerably going from to
bands. In the optical the atmosphere transmission is mainly defined
by a continuum function, while in the IR in most of the instruments the
passband cut-offs are defined by deep atmospheric absorption bands. The
latter make the use of a fixed instrumental passband not a good
approximation of the real transmission function, because it depends on
the atmospheric conditions. To a much lesser degree this is also a
problem for the optical and filters, where some telluric
features fall in the middle of the passbands. These telluric lines do
not change linearly with airmass, therefore their variation is not
properly accounted by the absorption coefficients. For La Palma we
obtained from King (1985), while for La Silla,
Paranal and CTIO we have used the CTIO transmission curve in the IRAF
reduction package (Stone & Baldwin 1983, Baldwin & Stone 1984). For
the IR sky spectrum of La Silla and CTIO we downloaded from the 2MASS web
side444.
The instrumental filter bands are compared with the standard ones in
Fig. 25 and Fig. 26.
As usual (see e.g. Pignata et
al. 2004), we checked how well the constructed instrumental passbands
match the real ones and compared the colour terms derived from standard
stars (Landolt (1992) for the optical and Persson et al. (1998) for the
IR) with those we computed by integrating the flux of spectrophotometric
standards of Stritzinger et
al. (2005) for the optical and Sirius, Vega and
the Sun for the IR. We decided to modify the instrumental passband only
in cases where the difference between the two colour terms reported in
Table 10 and Table 11 were larger than three times
the error associated to both “synthetic” and “photometric” colour
terms. The lack of a suitable number of spectrophotometric IR standards
with an establish magnitude make the colour term comparison less
effective than at optical wavelengths.