ATCA and Spitzer Observations of the Binary Protostellar Systems CG 30 and BHR 71
Abstract
We present interferometric observations with resolution of 3′′ of the isolated, low-mass protostellar double cores CG 30 and BHR 71 in the N2H+ (1 0) line and at 3 mm dust continuum, using the Australian Telescope Compact Array (ATCA). The results are complemented by infrared data from the Spitzer Space Telescope. In CG 30, the 3 mm dust continuum images resolve two compact sources with a separation of 217 ( 8700 AU). In BHR 71, strong dust continuum emission is detected at the position of the mid-infrared source IRS1, while only weak emission is detected from the secondary mid-infrared source IRS2. Assuming standard gas to dust ratio and optically thin 3 mm dust continuum emission, we derive hydrogen gas masses of 0.05 2.1 for the four sub-cores. N2H+ (1 0) line emission is detected in both CG 30 and BHR 71, and is spatially associated with the thermal dust continuum emission. By simultaneously fitting the seven hyperfine line components of N2H+, we derive the velocity fields and find symmetric velocity gradients in both sources. Assuming that these gradients are due to core rotation, we estimate the specific angular momenta and ratios of rotational energy to gravitational energy for all cores. Estimated virial masses of the sub-cores range from 0.1 0.6 . We also find that the N2H+ emission is strongly affected by the outflows, both in terms of entrainment and molecule destruction. images show the mid-infrared emission from all four sub-cores, which is spatially associated with the 3 mm dust continuum emission. All four sources appear to drive their own outflows, as seen in the shock-excited 4.5 m images. Based on the ATCA and observations, we construct spectral energy distributions (SEDs) and derive temperatures and luminosities for all cores. The analysis of the SEDs suggests an evolutionary discrepancy between the two sub-cores in both CG 30 and BHR 71, which could be due to effects of relative inclinations. Based on the morphology and velocity structure, we suggest that the sub-cores in CG 30 were formed by initial fragmentation of a filamentary prestellar core, while those in BHR 71 could originate from rotational fragmentation of a single collapsing protostellar core.
1 INTRODUCTION
Although statistical properties of binary stars have been determined over the past two decades (see e.g., Reipurth et al. 2007 for recent reviews), many key questions concerning their origin are still poorly understood. What is the formation mechanism of binary/multiple systems? How are mass and angular momentum distributed during their formation? What is the difference between cores forming binaries and those forming single stars? To answer these questions, direct observations of the earliest, deeply embedded phase of binary star formation are needed. This phase is unfortunately not accessible to optical and near-infrared (NIR) wavelengths, due to the large amounts of circumstellar material present. Observations of the gas and optically thin dust emission at millimeter (mm) wavelengths are therefore needed, to probe the system kinematics and individual envelope masses. However, these observations were long hampered by the low angular resolution of mm telescopes, and only recently have the earliest phases of binary star formation been observationally identified and studied in detail thanks to the availability of large (sub-) mm interferometers, although the number of known systems is still very small (Looney et al. 2000; Launhardt 2004).
To search for binary protostars and to derive their kinematic properties, we have started a systematic program to observe, at high angular resolution, a number of isolated low-mass prestellar and protostellar molecular cloud cores. The initial survey was conducted at the Owens Valley Radio Observatory (OVRO) mm array (Launhardt 2004; Chen, Launhardt, & Henning 2007, hereafter Paper I; Launhardt et al., in prep.), and is now continued with the Australia Telescope Compact Array (ATCA) and the IRAM Plateau de Bure Interferometer (PdBI) array. In this paper we present ATCA observations of two southern protobinaries in the N2H+ (1 0) molecular line and at 3 mm dust continuum, together with complementary mid-infrared (MIR) data from the Spitzer Space Telescope (hereafter ).
CG 30 (also known as BHR 12 or DC 253.31.6) is a bright-rimmed cometary globule located in the Gum Nebula region. The distance towards CG 30 is somewhat uncertain, with estimates ranging from 200 pc (Knude et al. 1999) to 400 pc (Brandt 1971; Reipurth 1983). For consistency with earlier papers (e.g., Henning & Launhardt 1998), we use here 400 pc. The globule harbors an elongated protostellar core as seen in the single-dish mm dust continuum image (Launhardt et al. in prep.). Higher resolution submm continuum observations (SCUBA) resolve the source into two sub-cores with a projected separation of 20′′ ( 8000 AU) and masses of 0.17 0.05 and 0.14 0.05 (Henning et al. 2001). The northern core is associated with a NIR source, which drives the Herbig-Haro flow HH 120 (see Hodapp & Ladd 1995 and references therein). The newly discovered southern core is the origin of a protostellar jet with position angle (P.A.) 44∘ (Hodapp & Ladd 1995), but no NIR source is seen at this position (see Launhardt et al. 2001).
BHR 71 (also known as DC 297.72.8) is an isolated Bok globule located at a distance of 200 pc (Bourke et al. 1997; hereafter B97). A highly-collimated bipolar outflow, which is lying almost in the plane of the sky, was discovered by CO observations in this region. The driving source is associated with IRAS 115906452 and was classified as a Class 0 protostar with a total luminosity of 9 (B97). ISOCAM observations have revealed that the IRAS source is associated with two embedded protostars, IRS1 and IRS2, with a projected separation of 17′′ ( 3400 AU; Bourke 2001; hereafter B01). IRS1 and IRS2 each drive a CO outflow: the well-known large-scale collimated bipolar outflow is driven by IRS1 and another fainter and smaller bipolar outflow is driven by IRS2 (see B01 and Parise et al. 2006). Only IRS1 appears to be associated with a substantial amount of circumstellar material, but neither is directly detected at NIR wavelengths (B01).
2 OBSERVATIONS AND DATA REDUCTION
2.1 ATCA Observations
Millimeter interferometric observations at 95 GHz of CG 30 and BHR 71 were carried out using ATCA with five 22 m telescopes in May and August 2005. Observations were obtained in two different array configurations (H168 and H75) with projected baselines ranging from 22 to 180 m. All antennas were equipped with cooled SIS receivers, which provided average system temperatures of 200 350 K at the observing frequency. A digital correlator was used with 2 independent spectral windows. The narrow window (bandwidth 8 MHz), with a channel width of 0.019 MHz, was centered on the N2H+ (1 0) line at 93.17 GHz111During the observations the sky frequency changed by less than one channel due to the lack of doppler tracking at ATCA, and corrections were applied offline to obtain correct frequencies and LSR velocities. The broad window (bandwidth 128 MHz) was centered at 95.0 GHz and was used to measure the 3.1 mm dust continuum emission simultaneously with N2H+. The two sources were observed with 2-point mosaics each. The primary beam size at 93 GHz is 38′′. Amplitude and phase were calibrated through frequent observations of quasars nearby to each source (0745330 for CG 30 and 1057797 for BHR 71), typically every 20 minutes, resulting in an absolute position uncertainty of 02. Flux densities were calibrated using the secondary calibrator 1253055, the flux of which was regularly compared to Uranus and adopted as 19.0 Jy for May observations (H168 configuration) and 14.7 Jy for August observations (H75 configuration). Additional effort was made to improve the gain-elevation calibration of the antennas, which can significantly affect the flux density scale, especially when observing at high elevation. The estimated total flux uncertainty is 20%. Observing parameters are summarized in Table 1.
The data were calibrated and images produced using MIRIAD (Sault et al. 1995) and its CLEAN algorithm, with “robust” weighting parameter +1 (Briggs et al. 1999). Synthesized beam sizes are 3′′ 4′′. Noise levels (1 rms) in the final maps are 0.5 2 mJy/beam for the continuum and 20 65 mJy/beam for the N2H+ line (see Table 1). Further analysis and figures were done with the GILDAS222http://www.iram.fr/IRAMFR/GILDAS software package.
2.2 Spitzer Observations
Mid-infrared data of CG 30 and BHR 71 were obtained from the Science Center333http://ssc.spitzer.caltech.edu. CG 30 was observed on 2004 April 9 with the Multiband Imaging Photometer for (MIPS: AOR key 9426688) and May 26 with the Infrared Array Camera (IRAC; AOR key 5097216). BHR 71 was observed on 2004 June 10 with IRAC (AOR key 5107200) and 2005 March 7 with MIPS (AOR key 9434112). Both sources were observed as part of the c2d Legacy program (Evans et al. 2003).
The data were processed by the Science Center using their standard pipeline (version S14.0) to produce Post Basic Calibrated Data (P-BCD) images, which are flux-calibrated into physical units (MJy sr-1). Flux densities in the IRAC bands were measured with aperture photometry in the IRAF APPHOT package, using the radii, background aperture annuli, and aperture corrections recommended by the Science Center. The results were compared to c2d, which used PSF fitting, and found to be within the uncertainties. Flux densities in the MIPS bands were measured with GILDAS because sources in the MIPS images are not fully resolved (see 3.3). Further analysis and figures were completed with GILDAS.
3 RESULTS
3.1 Dust Continuum
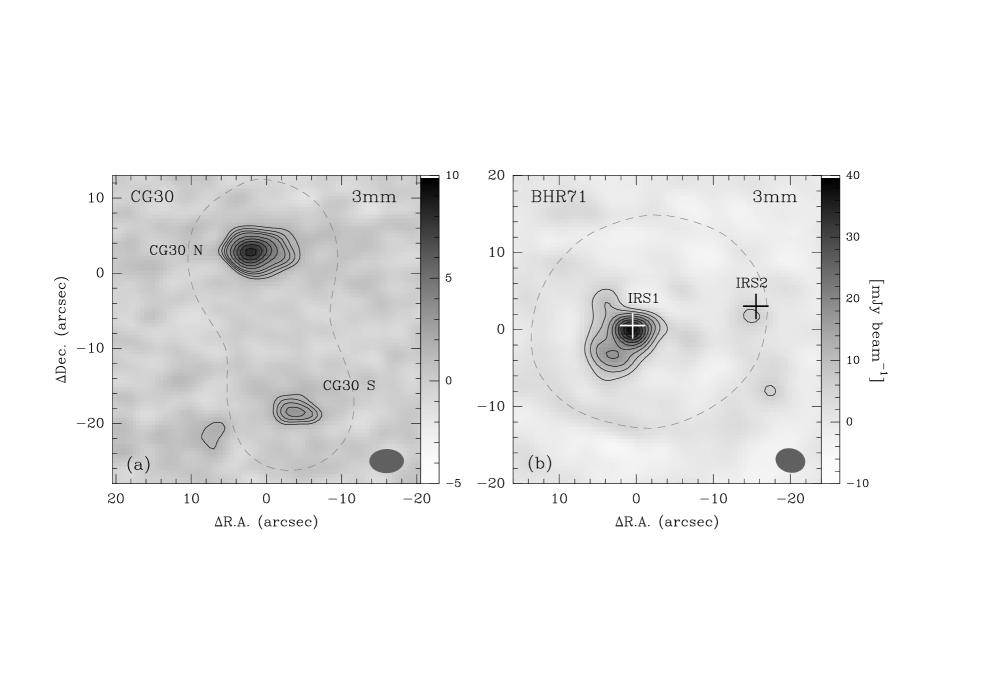
The 3 mm dust continuum image of CG 30 (Fig. 1a) shows two compact sources with an angular separation of 217 06, corresponding to a projected linear separation of 8700 240 AU at a distance of 400 pc. Following Henning et al. (2001), we refer to the northern source as CG 30N and to the southern source as CG 30S. From Gaussian plane fitting, we derive flux densities of 15.8 3.2 mJy444The error bar is derived from , where is the uncertainty from calibration ( 20% of flux density) and is the uncertainty from Gaussian fitting. for source N and 6.0 1.3 mJy for source S. The large-scale common envelope, detected in the submm single-dish maps with a radius of 14000 AU and a flux density of 7.4 Jy (Henning et al. 2001), is resolved out by the interferometer at 3 mm. Source positions and deconvolved FWHM sizes of the two embedded sources, derived from Gaussian plane fitting, are listed in Table 2.
In the 3 mm dust continuum image of BHR 71 (Fig. 1b), strong emission is detected at the position of IRS1, and only weak emission ( 3 level) is detected at the position of IRS2. The flux densities of IRS1 and IRS2 are derived to be 140 28 mJy and 2.8 2.1 mJy, respectively. The large-scale envelope detected in the 1.3 mm single-dish map, with a radius of 9000 AU and a flux density of 3.7 Jy (B97), is also resolved out here. Positions and FHWM sizes of the sources are listed in Table 2. The angular separation of 17′′ 1′′ between IRS1 and IRS2 corresponds to a projected linear separation of 3400 200 AU at a distance of 200 pc. We also note that IRS1 is elongated northwest-southeast and consists of two separate peaks in the region enclosed by the 5 level (see Fig. 1b). The main peak is spatially coincident with the MIR source and the fainter peak is located 2′′ southeast of IRS1 (see below 3.3).
Assuming that the 3 mm dust continuum emission is optically thin, the hydrogen gas mass = (H) + 2 (H2) in the circumstellar envelope (excluding Helium) was calculated with the same method as described in Launhardt & Henning (1997). We adopt an interstellar hydrogen-to-dust mass ratio of 110, and a dust opacity cm2 g-1 (using cm2 g-1 and ), a fairly typical value for dense protostellar cores (Ossenkopf & Henning 1994). Dust temperatures are derived from SED fitting ( 4.1) and are listed in Table 7. The derived hydrogen gas masses (0.05 2.1 ), together with mean volume densities (0.4 2.6 107 cm-3) and column densities (1.5 9.9 1023 cm-2), are listed in Table 2. The resulting optical depths are 0.4 3 , thus justifying the optically thin approximation.
3.2 N2H+ (1 0)
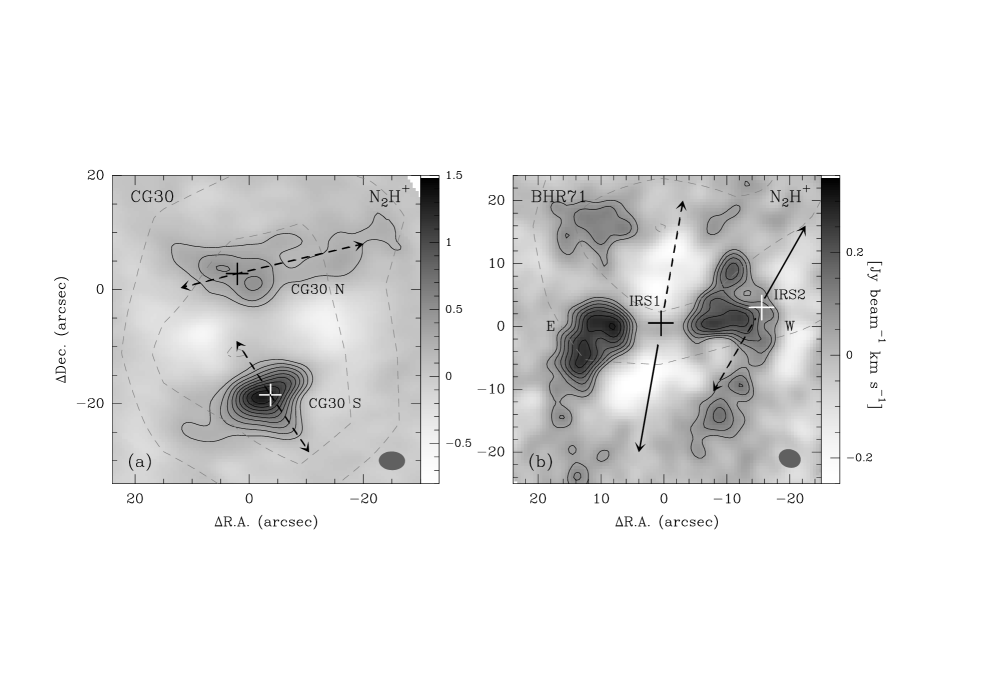
N2H+ emission is detected from both CG 30 and BHR 71. Figure 2a shows the velocity-integrated N2H+ intensity image of CG 30. Two cores, spatially associated with the 3 mm dust continuum sources, are seen. The northern core is elongated east-west with a long ( 20′′) extension to the west, along the direction of the protostellar jet HH 120 (see Fig. 7c). The southern core is more compact and peaks at the position of the dust continuum source. The mean radii of the N2H+ cores (Table 4) were measured with the same method described in Paper I. A larger-scale N2H+ cloud core, detected in the Mopra single-dish map with a radius of 8000 AU (P. Barnes et al. in prep.), peaks between the two sub-cores (see Fig. 2a) and is resolved out by the interferometer (more than 90% flux is missing).
Figure 2b shows the integrated N2H+ intensity image of BHR 71. Two cores are found to the east and west of IRS1 (see below and discussion in 4.4). We refer to these as BHR 71E and BHR 71W, respectively. The two cores are elongated in the north-south direction. Several smaller clumps are also seen north and south of the two main cores, along both sides of the large-scale CO outflow (see Fig. 2b). For BHR 71, the Mopra N2H+ map (P. Barnes et al. in prep.) again shows a large-scale cloud core with one peak ( 15′′ offset IRS1), and does not line up well with the two dust continuum sources (see Fig. 2b).
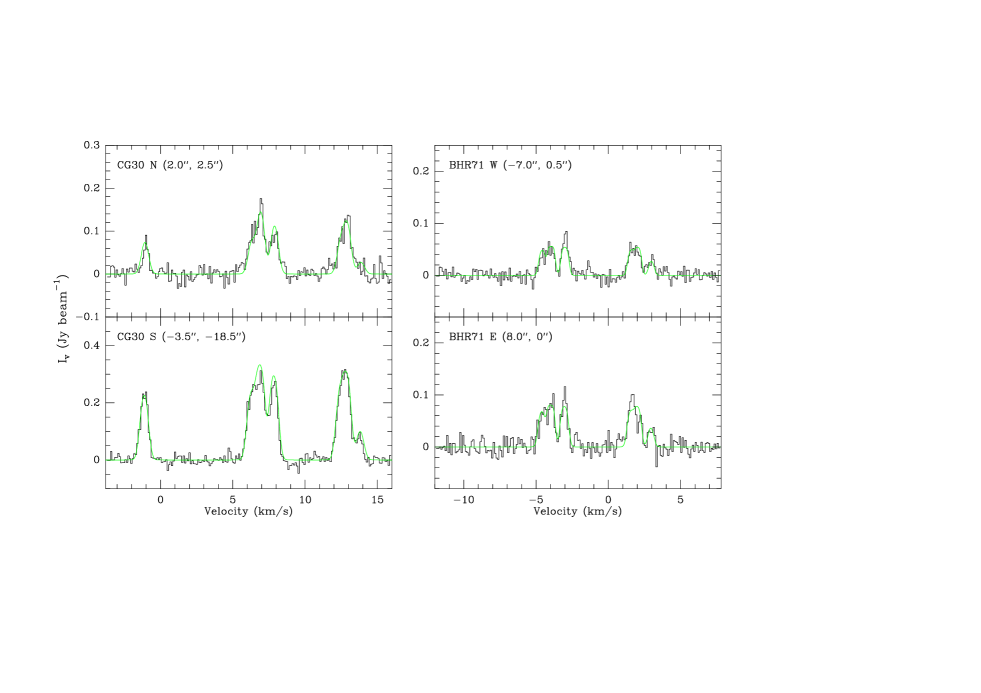
Figure 3 shows the N2H+ spectra at the peak positions of CG 30 and BHR 71555During the observations towards BHR 71, the correlator was not well centered due to an uncertainty in the Doppler correction calculation, resulting in the N2H+ = component not being covered. However, the absence of this line component did not affect our final results.. The spectra were fitted using the hyperfine program in CLASS. The fitting results, such as LSR velocities (), intrinsic line width (; corrected for instrumental effects), total optical depths (), and excitation temperatures (), are listed in Table 3.
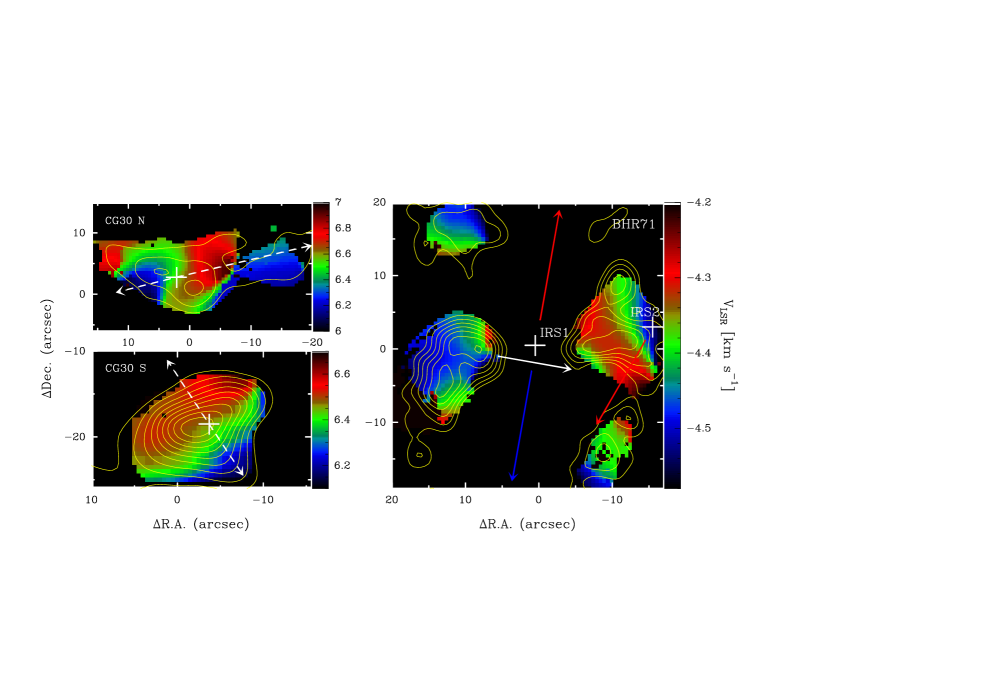
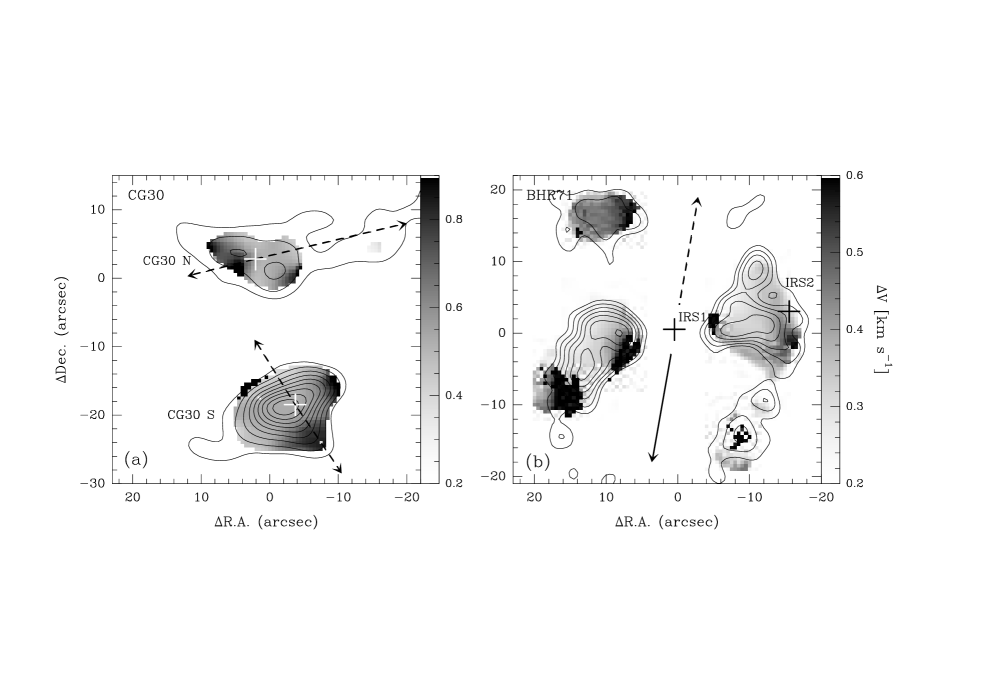
Figure 4 shows the mean velocity fields of CG 30 and BHR 71, derived from the N2H+ line maps with the fitting routine described in Paper I. The jet/outflow information is also shown in each map. In CG 30, the southern core shows a well-ordered velocity field, with gradient parallel to the outflow direction. The northern core shows a more complicated velocity field, but the gradient in the inner core is also parallel to the outflow direction. In BHR 71, there seems to be a general velocity gradient across the two N2H+ cores, which is approximately perpendicular to the axis of the large-scale CO outflow. This may indicate that the two cores are actually part of one physical structure associated with IRS1 (see discussion in 4.4). A least-squares fitting of the velocity gradients has been performed using the routine described in Goodman et al. (1993). The results are summarized in Table 5 and discussed in 4.2.
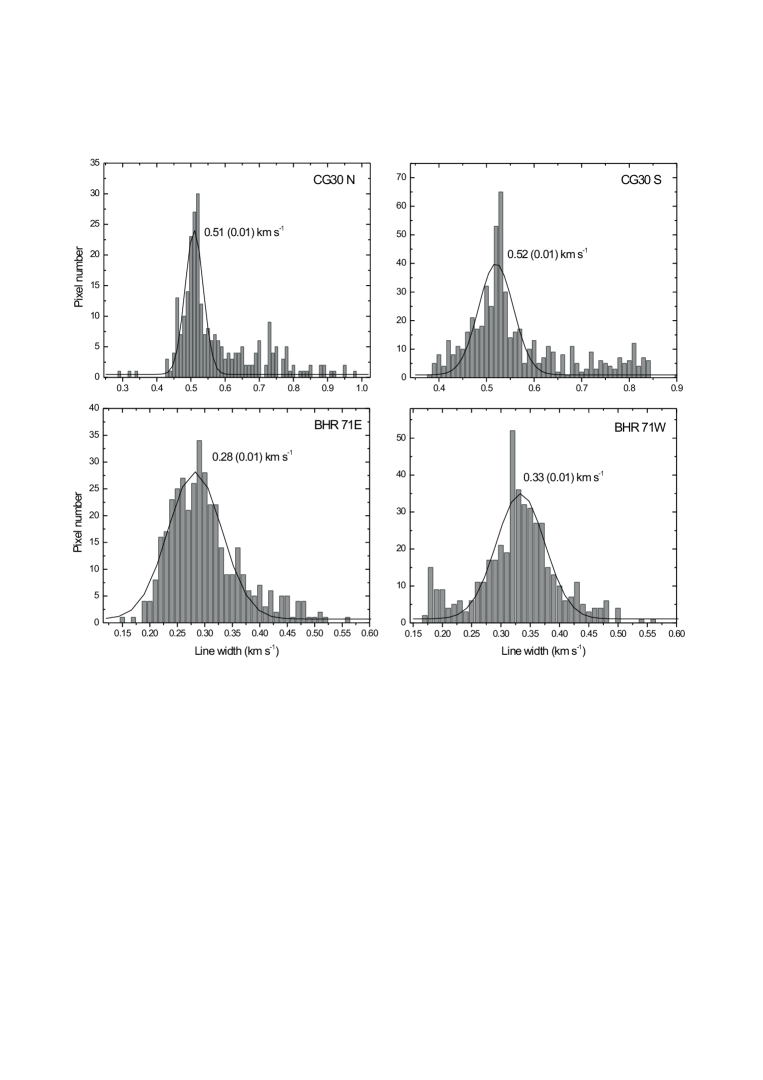
Figure 5 shows the spatial distribution of N2H+ line widths for both sources. The line widths are roughly constant within the interiors of the cores, which is consistent with the observational results in Paper I. The mean line widths were derived through Gaussian fitting to the distribution of line widths versus solid angle area in the maps (see Fig. 6). We find that the sub-cores in each object have roughly equal line width, but the mean line width in CG 30 ( 0.5 km s-1) is 1.7 times larger than that in BHR 71 ( 0.3 km s-1).
Assuming that the observed N2H+ line widths are not dominated by systematic gas motions, the virial mass of the cores has been calculated as:
| (1) |
where is the gravitational constant, is the FWHM core radius, and is the line width of the emission from an “average” particle with mass = 2.33 amu (assuming gas with 90% H2 and 10% He). The coefficient = (1 /3)/(1 2/5), where is the power-law index of the density profile, is a correction for deviations from constant density (see Williams et al. 1994). In our calculations, we assume = 1.5 (see André et al. 2000) and use = 1.25. is derived from the observed spectra by
| (2) |
where is the observed mean line width of N2H+ and is the mass of the emitting molecule (here we use = 29 amu). We derive virial masses between 0.1 and 0.6 . The results are listed in Table 4.
The N2H+ column density has been calculated independently from the line intensity using the equation given by Benson et al. (1998):
| (3) |
where is the total optical depth, is the intrinsic line width in km s-1, and is the excitation temperature in K. The gas-phase N2H+ mass of the core was then calculated from , where is the distance from the Sun and is the solid angle enclosed by the FWHM contours for each core.
Assuming that the gas mass and virial mass derived from the N2H+ data are the same, we derived the average fractional abundance of N2H+ in each core (see Table 4). The average value 3.0 10-10 for CG 30 and BHR 71 is close to the mean value found in Paper I ( 3.3 10-10) for nine other protostellar cores.
3.3 Spitzer Images
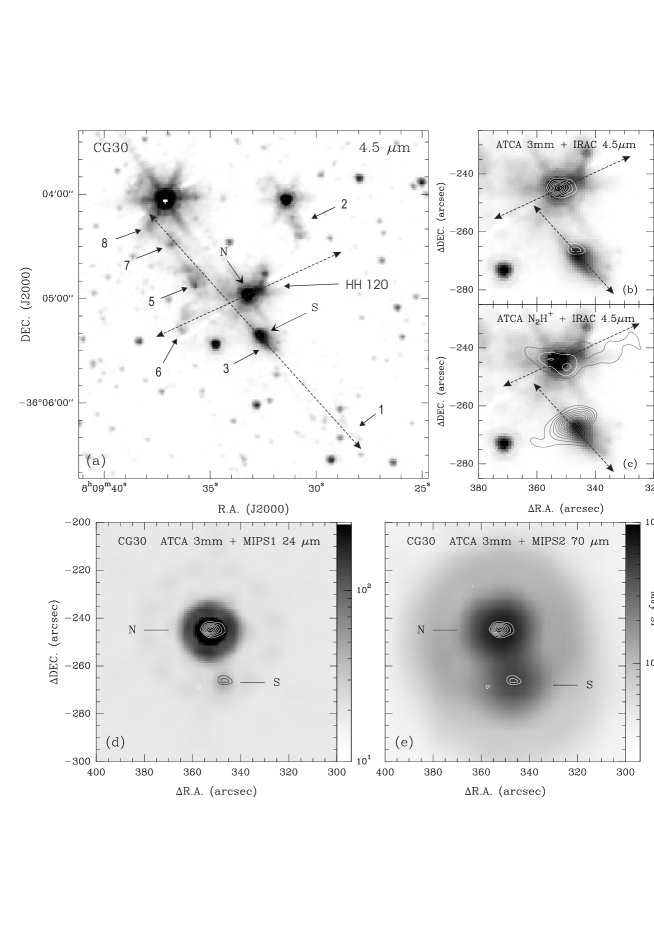
Figure 7 shows the images of CG 30. The infrared emission from CG 30N and CG 30S is detected at all IRAC bands (3.6 m 8.0 m). Fig. 7a shows a wide-field IRAC band 2 (4.5 m) image. Centered at CG 30S is a highly collimated bipolar jet, with P.A. 40∘. The knots in the jet are labeled with the same numbers as in Hodapp & Ladd (1995). The most distant knot (No. 8) is 90′′ away from CG 30S. Assuming a typical jet speed of 100 km s-1 (Reipurth & Bally 2001), an inclination angle of 90∘, and a distance of 400 pc, the dynamical age of the jet is estimated to be 1700 yr. CG 30N appears to be the driving source of HH 120, which is 5′′ in size and extends to the west. Knot No. 6, located to the east of CG 30N, is probably ejected by CG 30N and part of the same outflow as HH 120.
Figs. 7b and 7c show enlarged views of the two sources, overlaid with the contours from the ATCA 3 mm dust continuum and N2H+ images. The two infrared sources are spatially coincident with the 3 mm dust continuum and N2H+ sources. However, when viewed in detail, CG 30S is elongated at the infrared bands and the continuum source is located at the apex of the infrared emission, implying that the infrared emission at IRAC bands from CG 30S is due to scattered light in a cavity evacuated by the jet/outflow. In contrast, CG 30N shows a point-like structure at all IRAC bands coincident with the circumstellar mm dust emission peak, suggesting that the source is directly detected at NIR wavelengths ( 5 m). The N2H+ emission from CG 30N spatially follows the direction of the protostellar jet and the long extension to the west matches exactly the HH 120 flow (see Fig. 7c), indicating that the jet has a strong effect on the morphology of the N2H+ emission.
In the MIPS 1 (24 m) image shown in Fig. 7d, CG 30 is again resolved in two sources, but the emission is dominated by CG 30N and only weak emission is found at the position of CG 30S. In the MIPS 2 (70 m) image (see Fig. 7e), the two sources are not fully resolved, but two peaks, with flux ratio 2:1, can be clearly distinguished. Flux densities of CG 30N and CG 30S in the IRAC and MIPS bands are measured (see 2.2) and listed in Table 6.
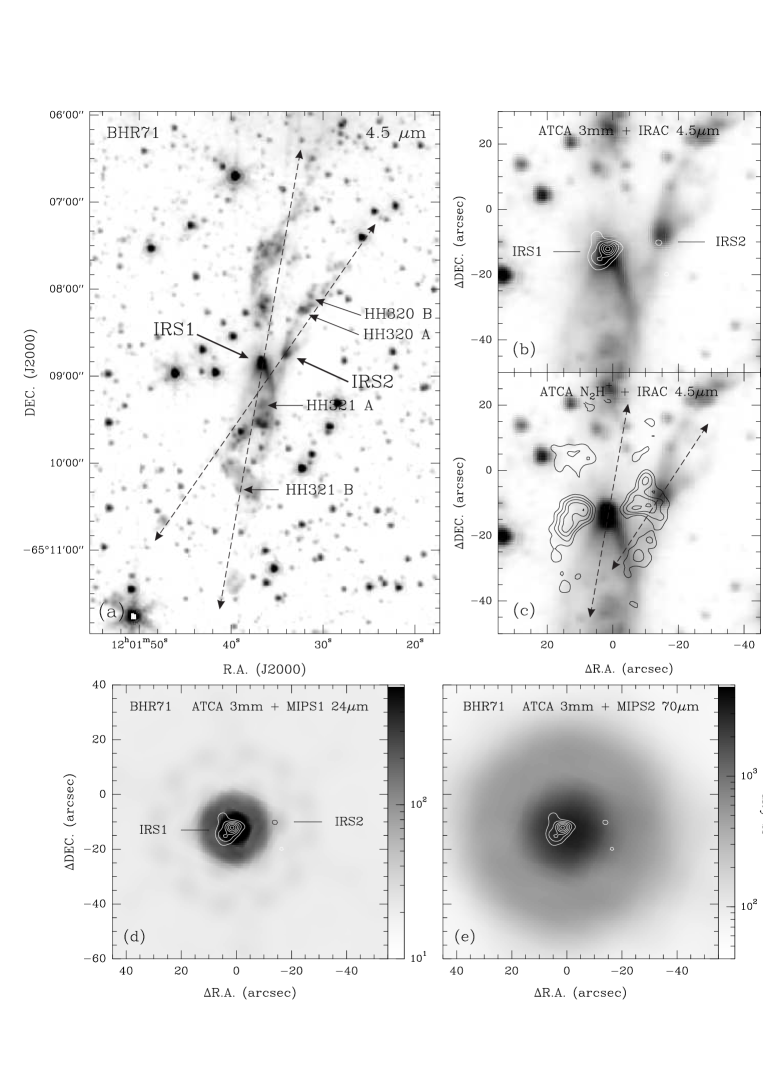
The images of BHR 71 are shown in Fig. 8, with the same sequence as in Fig. 7. The infrared emission from IRS1 and IRS2 is detected at all IRAC bands. A large-scale ( 160′′ in length) bipolar jet, centered at IRS1 with a P.A. of 165∘, is seen in the IRAC images (Fig. 8a). The northern jet, spatially coincident with the red-shifted CO outflow, is S-shaped, while the southern jet, containing the HH object HH 321 (Corporon & Reipurth 1997), shows a V-shaped structure at the apex. This V-shaped structure may represent a conical cavity evacuated by the successive bow-shocks traced by the infrared emission (Fig. 8a) and the blue-shifted CO outflow (see B97 and Parise et al. 2006). Another bipolar jet, at P.A. 30∘, is found with IRS2 being in the center. Its northwest lobe, containing another HH object HH 320 (Corporon & Reipurth 1997), also shows a V-shaped structure at the apex and could be explained in the same way.
IRS1 and IRS2 are spatially coincident with the dust continuum sources detected with ATCA (see Fig. 8b). We note that the IRS2 dust continuum source is located at the apex of the infrared emission and could be explained in the same way as CG 30S. The elongated structure and secondary peak found in the ATCA dust continuum image match the left wall of the outflow cavity, suggesting they result from the jet/outflow action (for a similar case, see Gueth et al. 2003). The N2H+ emission is located on both sides of the large-scale CO outflow and basically matches the wall of the cavity (see Fig. 8c). At the MIPS 1 band, BHR 71 is barely resolved into two sources and the emission is dominated by IRS1 (see Fig. 8d). The MIPS 2 image does not resolve the two sources and the emission is peaked at the position of IRS1666The offset ( 3′′) between the MIPS 2 emission peak and the 3 mm emission peak is much smaller than the FWHM of MIPS 2 PSF ( 10′′), and is not significant. (see Fig. 8e). Flux densities of IRS1 and IRS2 are listed in Table 6.
4 DISCUSSION
4.1 Spectral Energy Distributions and Evolutionary Stages
Figure 9 shows the spectral energy distributions (SEDs) of CG 30 N and S and BHR 71 IRS1 and IRS2, based on the infrared (ISOCAM, , and IRAS), sub-mm (SCUBA, available only for CG 30), and mm (SEST and ATCA) observations. The NIR data of CG 30N are adopted from Persi et al. (1990). The SCUBA and SEST data for CG 30 are adopted from Henning et al. (2001) and Henning & Launhardt (1998), respectively. The ISOCAM and SEST data for BHR 71 are adopted from B01 and B97, respectively. Here we do not explicitly list all flux values, but show graphically the SEDs. Since IRAS observations could resolve neither CG 30 nor BHR 71, flux ratios at the IRAS wavelengths of 10:1 (CG 30N : CG 30S) and 20:1 (BHR 71 IRS1 : IRS2) were inferred from the and ATCA observations.
In order to derive luminosities and bolometric temperatures, we first interpolated and then integrated the SEDs, always assuming spherical symmetry. Interpolation between the flux densities was done by a 2 grey-body fit to all points at 100 m777The 3 mm points were ignored in the fitting to CG 30 and BHR 71 IRS2 to give higher priority to the submm data, resulting in much better fitting., using
| (4) |
where is the Planck function at frequency and dust temperature , is the dust optical depth as a function of frequency , and is the solid angle of the source. A simple logarithmic interpolation was used between all points at 100 m. The fitting results, such as dust and bolometric temperatures, sub-mm ( 350 m) and bolometric luminosities, are listed in Table 7.
Based on these results, we try to address the evolutionary stages of CG 30 and BHR 71. A detailed definition and discussion for early stellar evolutionary phases can be found in André et al. (2000) and Froebrich (2005). The / ratios of all sources are 0.5% (the standard boundary of Class 0 protostars, see André et al. 2000)888Our / ratios are larger than those found by Froebrich (2005). We attribute this to the fact that Frobrich (2005) assumed the two objects were single cores, but we resolved them as binaries. Furthermore, we have more data points at submm wavelengths (for CG 30) and high-resolution interferometric data points at 3 mm, which were all not available to Froebrich (2005). and the four sources each drive a bipolar jet (see 3.3). However, the bolometric temperature of CG 30N is 100 K and the object is also directly detected at NIR wavelengths, suggesting CG 30N is a Class I young stellar object. In contrast, the low bolometric temperature (37 K) of CG 30S suggests it is a Class 0 protostar. In BHR 71, both IRS1 and IRS2 have bolometric temperatures less than 70 K (see Table 7). Nevertheless, IRS1 might be directly detected at NIR wavelengths (see Fig. 8a), suggesting that it is a transition object between Class 0 and I, while IRS2 could be a Class 0 protostar.
It must be noted that the analysis above does not take into account inclination effects: considering a protostar embedded in a circumstellar disk/envelope, its infrared emission could be detected through the outflow cavity when the system is face-on, but is not seen when it is edge-on. In BHR 71, the bipolar CO outflow powered by IRS1 is lying roughly in the plane of sky, implying the latter case; the bipolar outflow driven by IRS2 appears to favor the same situation (see Parise et al. 2006). In CG 30, however, the relative inclinations could not be easily distinguished because the information about molecular outflows is still missing. The SED-based classification discussed above thus might be a result of both evolutionary stage and inclination. In particular in CG 30 we cannot disentangle the two effects. It is well possible that the different SEDs (and bolometric temperatures) reflect actually inclination effects rather than a difference in evolutionary stage.
4.2 Gas Kinematics
The thermal contribution to the N2H+ line width is calculated by , where is the Boltzmann constant, is the kinetic gas temperature, and is the mass of the observed molecule. Assuming that at the high densities of 106 cm-3 (see Table 2) the kinetic gas temperature is equal to the dust temperature derived in 4.1 ( 20 K), the non-thermal contributions to the line widths () were then calculated to be 0.5 km s-1 in CG 30 and 0.2 km s-1 in BHR 71 (see Table 3). These non-thermal line widths suggest that turbulence, the main contribution to the non-thermal line width (Goodman et al. 1998), cannot be ignored in the protostellar cores. On the other hand, the thermal line width of an “average” particle of mass 2.33 (assuming gas with 90% H2 and 10% He), which represents the local sound speed, is 0.62 km s-1 at 20 K. The derived non-thermal contributions to the N2H+ line width in both CG 30 and BHR 71 are smaller than this local sound speed (i.e., the turbulent motion is subsonic). We also note that the mean line widths derived for BHR 71 ( 0.3 km s-1) are three times smaller than measured by single-dish observations in Mardones et al. (1997; 0.9 km s-1). Taking into account the systematic velocity variation across the core ( 0.3 km s-1; see Table 5), the combined line width in our maps is still smaller than the result from single-dish observations. It means that high-level (supersonic) turbulence occurs mainly in the extended envelope which is resolved out by the interferometer, but the inner core is much more “quiescent”. This is consistent with what we found in Paper I, namely that non-thermal motions are quickly damped from large-scale to smaller inner cores (see e.g., Fuller & Myers 1992).
The velocity fields of CG 30N, CG 30S, and BHR 71 show systematic velocity gradients (see Fig. 4). As discussed in Paper I, systematic velocity gradients are usually dominated by either rotation or outflow. In CG 30, the gradients in both cores are parallel to the jets. Although there is no molecular outflow information available yet for CG 30, these gradients are likely the results of outflows and we treat them as upper limits of underlying rotation velocity gradients. In BHR 71, the velocity gradient across the two N2H+ cores is roughly perpendicular to the axis of the large-scale CO outflow and could be explained by rotation. [Here we assume that the two cores are associated with IRS1 (see 4.4).] The velocity gradients measured in CG 30N, CG 30S, and BHR 71 are 24.4, 17.5, and 7.8 0.5 km s-1 pc-1, respectively (see Table 5). Both the velocity gradient in BHR 71 as well as the upper limits for CG 30N and CG 30S are consistent with those found in Paper I.
Assuming that the velocity gradients summarized in Table 5 are due to core rotation, the specific angular momentum of the objects was calculated with the following equation:
| (5) |
where the coefficient = , is the power-law index of the radial density profile ( = 1.5; see 3.2), is the velocity gradient, and is the inclination angle to the line of sight direction (here we assume = 1). The derived for CG 30N, CG 30S, and BHR 71 are listed in Table 5. It should be noted that for CG 30 we derive only upper limits. The ratio of rotational energy to the gravitational potential energy was calculated by = 0.19 , where = = and = (the masses and radii used in the equations are virial masses and radii listed in Table 4). The estimated values for CG 30N, CG 30S, and BHR 71 are 0.019, 0.014, and 0.020, respectively.
4.3 How did the cores fragment?
Recent numerical simulations and observations support the hypothesis that the fragmentation of molecular cloud cores is the main mechanism for the formation of binary/multiple stellar systems, although the exact when, where, why, and how are still under debate (see reviews by Bodenheimer et al. 2000, Tohline 2002, and Goodwin et al. 2007). In this section, we try to examine the origin of the sub-cores in both CG 30 and BHR 71, i.e., whether they formed by initial cloud fragmentation prior to protostellar collapse or by prompt rotational fragmentation of a single core after the initial collapse.
In CG 30, our previous single-dish submm maps have shown a large-scale hourglass-shaped common envelope around the two sub-cores (Henning et al. 2001; see Fig. 1a). The separation between the sub-cores is 8700 AU, which is roughly two times the typical Jeans length [ = 0.19 pc () (); see Stahler & Palla 2004] in prestellar cores ( 4000 AU at = 10 K and = 106 cm-3). The radial velocity difference between the two sub-cores is 0.16 km s-1 (see Table 3). If we assume that the total binary mass is 1.4 1.36 (see Table 2; the factor 1.36 accounting for He and heavier elements) and the orbit is perpendicular to the plane of sky, the orbit velocity difference in a bound system with the separation of 8700 AU should be 0.44 km s-1, about three times larger than the observed value. Furthermore, from this observed velocity difference, we estimate the of 0.008 for the large-scale cloud core which contains the two sub-cores (radius 8000 AU; see Fig. 2a). This is less than the typical boundary suggested by a series of numerical simulations (see e.g., Boss 1999 and Machida et al. 2005) for rotational fragmentation. Based on the morphology and velocity structure, we suggest that the two sub-cores in CG 30 were formed by initial fragmentation999The basic idea of this initial fragmentation is that the collapse is initiated in a large-scale molecular cloud core which contains multiple Jeans masses in a weakly condensed configuration, e.g., a prolate or filamentary Gaussian distribution with several Jeans masses along the long axis and one Jeans mass across the short axis; with some initial angular momentum, provided by either slow rotation (Bonnell et al. 1991) or turbulence (Goodwin et al. 2007), the large cloud core fragments at Jeans scale into several dense cores, in which the separate protostellar collapse then starts and proceeds more quickly than across the whole structure (see e.g., Mundy et al. 2001 and reference therein). of a large-scale filamentary prestellar core.
In BHR 71, the two sub-cores have a separation of 3400 AU (less than the typical Jeans length) and are also surrounded by a large common envelope (Fig. 1b). Unfortunately, the observed velocity structure is mainly associated with IRS1 and kinematic information of IRS2 is missing. Here we can only speculate on the basis of separation that the two sub-cores could be formed by prompt rotational fragmentation of a collapsing protostellar core.
Numerical simulations also predict that the material collapses along the magnetic field lines while the fragmentation occurs in a plane perpendicular to the magnetic field. This is supported by our previous submm polarimetric observations towards CG 30 (Henning et al. 2001). In contrast to a simple assumption that the angular momenta of two components will be parallel in the fragmentation, we find that the outflows, and hence the angular momenta (assumed to be parallel to the outflows), of the sub-cores are not aligned, neither in CG 30, nor in BHR 71. This phenomenon is also found in other binary protostars studied recently, like e.g., CB 230 and L 723 (Launhardt 2004; Launhardt et al., in prep.). This could mean that during core fragmentation the initial angular momentum is not evenly (in value and direction) divided between the sub-cores, although the mean direction is preserved all the time.
4.4 N2H+ vs. Dust vs. CO
From our observations towards Class 0 protostars conducted at OVRO (Paper I), ATCA (this work), and IRAM-PdBI (Chen et al., in prep.), we find that in most objects the mm continuum source lies within the half maximum level of the N2H+ emission. This good general agreement indicates that N2H+ is spatially associated with thermal dust in dense protostellar cores and cannot be significantly depleted like, e.g., CO and CS (see Bergin et al. 2001 and Caselli et al. 1999).
Fig. 10 shows that the dust mass (converted into hydrogen gas mass) is in general correlated with both the N2H+ gas mass and the virial mass (both derived from the N2H+ emission). However, there is a significant scatter in both correlations, indicating that the agreement holds only within a factor of 2 to 2.5 (1 scatter). This could be due to the fact that the mm dust continuum emission traces mainly the dense structures (e.g., inner envelope or disk), while N2H+ emission traces the larger-scale envelope (see e.g., Figs. 1a & 2a), and hence reflects different masses on different scales. We also note that the N2H+ gas mass depends on the specific source morphology and chemistry since it is quickly destroyed where CO is released from dust grain into the gas phase (see below). The estimated virial mass has also significant uncertainties because several sources are driving bipolar outflows and are probably no longer in virial equilibrium.
On the other hand, we also find that in most objects the morphology of the N2H+ emission is directly related to the jet/outflow actions. For example, in BHR 71, two N2H+ cores, located to the east and west of the outflow-driving source IRS1, are rotating perpendicular to the outflow axis, and there is no N2H+ emission detected at the origin and along the large-scale CO outflow. These features suggest a large N2H+ hole has been formed and the two cores may be the remnant of a N2H+ envelope101010For similar cases see low-mass protostars L 483 (Jrgensen 2004) and IRAM 04191 (Belloche & André 2004).. It is likely that a large amount of N2H+ in the way of the outflow has been depleted by CO molecules, which is one of the main destroyers of N2H+ in the gas phase (Aikawa et al. 2001). For this reason, we think that the emission at the position of IRS2 (see Fig. 2b) is part of the structure around IRS1 and does not originate from IRS2.
Based on the observational results, we speculate that there are three stages of the interaction between N2H+ and jets/outflows. (1) When jets are ejected from a protostar, N2H+ molecules in the envelope are entrained and show a jet-like morphology in the images, like, e.g., L723 VLA2 (Paper I) and CG 30N (this work). (2) Molecular outflows, following the jets, release CO from grain surfaces back into the gas phase and start destroying the N2H+ molecules on the way, leading to the observed hourglass structure perpendicular to the CO outflow axis, like e.g., IRAS 03282+3035, IRAS 04166+2706, and CB 224 (see Paper I). (3) Large N2H+ holes form in the envelopes, like e.g., in BHR 71 IRS1 (this work), L 483 (Jrgensen 2004), and IRAM 04191 (Belloche & André 2004). However, there seems to be no clear correlation between this N2H+/jet scenario and standard evolutionary scenario from Class 0 to Class I. For example, IRAM 04191 is a young Class 0 protostar but appears in the last stage, while CG 30N is a Class I object but appears in the first stage. We speculate that the appearance of the N2H+ emission is strongly affected by outflow-envelope interaction, which depends on the specific envelope morphology and source multiplicity properties.
5 SUMMARY
We have presented ATCA and observations of the two isolated protostellar double cores CG 30 and BHR 71 in the southern sky. The main results of this work are summarized as follows:
(1) The 3 mm dust continuum image of CG 30 resolves two compact sources with a separation of 21′′ (8400 AU). In BHR 71, one strong dust continuum source is detected at the position of mid-infrared source IRS1, while only weak emission is detected from the secondary mid-infrared source IRS2. The separation between IRS1 and IRS2 is 17′′ (3400 AU). Assuming optically thin dust emission, we derive hydrogen gas masses of 1.1 and 0.33 for northern and southern sources in CG 30, and 2.1 and 0.05 for IRS1 and IRS2 sources in BHR 71.
(2) N2H+ (1 0) emission is detected in both CG 30 and BHR 71. In CG 30, the two dust continuum sources are directly associated with N2H+ cores. In BHR 71, two N2H+ cores are around the primary dust continuum source, probably part of one large envelope, but no N2H+ is detected at the position of the dust source. The secondary IR source is not detected in N2H+.
(3) The excitation temperatures of the N2H+ line are 4.7 6.8 K for CG 30 and 3.9 4.4 K for BHR 71. The FWHM radii of N2H+ cores range from 730 to 1700 AU. The average fractional abundances of N2H+, derived from the ratio of N2H+ gas mass to virial mass, is 3.0 10-10, which is consistent with the results obtained in our previous study of the cores in northern sky. The observed mean N2H+ line widths are 0.5 km s-1 for CG 30 and 0.3 km s-1 for BHR 71. The line widths are roughly constant within the interiors of the cores and large line widths only occur at the edges of the cores. The derived virial masses of the N2H+ cores range from 0.1 to 0.6 .
(4) We derive the N2H+ radial velocity fields for CG 30 and BHR 71. The two N2H+ cores in CG 30 show systematic velocity gradients of 24.4 km s-1 pc-1 and 17.8 km s-1 pc-1 that are parallel to the outflow directions and could be affected by the outflows. In BHR 71, a systematic velocity gradient of 7.8 km s-1 pc-1 across the two cores is perpendicular to the large-scale outflow and could be explained by rotation.
(5) Assuming that the observed velocity gradients are due to core rotation (if perpendicular to outflow) or place an upper limit to rotation (if parallel to outflow), we estimate specific angular momenta of 0.30, 0.35, and 0.51 10-3 km s-1 pc for CG 30N, CG 30S, and BHR 71, respectively. The ratios for the rotational energy to the gravitational potential energy for CG 30N, CG 30S, and BHR 71 are estimated to be 0.019, 0.014, and 0.020, respectively.
(6) Infrared emission from both sub-cores in both CG 30 and BHR 71 is detected at IRAC bands and MIPS bands. Each source is driving its own outflow, as seen in the shock-excited 4.5 m infrared images. CG 30N is associated with a Herbig-Haro flow, while the southern source is driving a large bipolar jet. In BHR 71, both IRS1 and IRS2 are associated with Herbig-Haro objects and driving bipolar jets which coincide spatially with the CO outflows.
(7) By fitting the spectral energy distributions, we derive the dust temperature, bolometric temperature, and bolometric luminosity of the sources. We find that CG 30N is a Class I object while the southern source is a Class 0 protostar. In BHR 71, the properties of IRS1 resemble a Class 0/I transition object, while IRS2 is a Class 0 protostar. We speculate that the sources may nevertheless be coeval but that this evolutionary discrepancy is due to the effects of ralative inclinations.
(8) Based on the morphologies and velocity structures, we suggest that the double cores in CG 30 were formed by initial fragmentation of a filamentary prestellar core, while BHR 71 may originate from rotational fragmentation of a single collapsing protostellar core. We also find that the angular momenta of the sub-cores are not aligned in either pair of sources.
(9) Our observations conducted at OVRO and ATCA show a close correlation between thermal dust emission and N2H+. The N2H+ emission in most sources is spatially associated and quantitatively correlated with the dust continuum emission. However, we also find a strong relationship between the morphology of the N2H+ emission and the jet/outflow actions. Outflows first seem to entrain N2H+ and then gradually destroy it, which leads to the observed jet-like, hourglass-shaped intensity maps and N2H+ hole.
References
- Aikawa et al. (2001) Aikawa, Y., Ohashi, N., Inutsuka, S. I., et al. 2001, ApJ, 552, 639
- André et al. (2000) André, P., Ward-Thompson, D., & Barsony, M. 2000, in Protostars and Planets IV, ed. V. Mannings, A. P. Boss, & S. S. Russell (Tucson: Univ. Arizona Press), 59
- Belloche & André (2004) Belloche, A., & André, P. 2004, A&A, 419, L35
- Benson et al. (1998) Benson, P. J., Caselli, P., & Myers, P. C. 1998, ApJ, 506, 743
- Bergin et al. (2001) Bergin, E. A., Ciardi, D. R., Lada, C. J., Alves, J., & Lada, E. A. 2001, ApJ, 557, 209
- Bodenheimer et al. (2000) Bodenheimer, P., Burkert, A., Klein, R. I., & Boss, A. P. 2000, in Protostars and Planets IV, ed. V. Mannings, A. P. Boss, & S. R. Russell (Tucson: Univ. Arizona Press), 675
- Bonnell et al. (1991) Bonnell, I., Martel, H., & Bastien, P. 1991, ApJ, 377, 553
- Boss (1999) Boss, A. P. 1999, ApJ, 520, 744
- Bourke (2001) Bourke, T. L. 2001, ApJ, 554, L91 (B01)
- Bourke et al. (1997) Bourke, T. L., Garay, G., Lehtinen, K. K., et al. 1997, ApJ, 476, 781 (B97)
- Brandt et al. (1971) Brandt, J. C., 1971, in: Maran, S. P., Brandt, J. C., Stecher, T. P. (eds.), The Gum Nebula and Related Problemss, NASA SP-322, 4
- Briggs et al. (1999) Briggs, D. S., Schwab, F. R., & Sramek, R. A. 1999, ASPC, 180, 127
- Caselli et al. (1999) Caselli, P., Walmsley, C. M., Tafalla, M., Dore, L., & Myers, P. C. 1999, ApJ, 523, L165
- Chen et al. (2007) Chen, X. P., Launhardt, R., & Henning, Th. 2007, ApJ, 669, 1058 (Paper I)
- Corporon & Reipurth (1997) Corporon, P., & Reipurth, B. 1997, in IAU Symp. 182, Poster Proc., Low-Mass Star FormationFrom Infall to Outflow, ed. F. Malbert & A. Castets (Grenobel: Obs. Grenoble), 85
- Evans et al. (2003) Evans II, N. J., Allen, L. E., & Blake, G. A., et al. 2003, PASP, 115, 965
- Froebrich (2005) Froebrich, D. 2005, ApJS, 156, 169
- Fuller & Myers (1992) Fuller, G. A., & Myers, P. C. 1992, ApJ, 384, 523
- Gueth et al. (2003) Gueth, F., Bachiller, R., & Tafalla, M. 2003, A&A, 401, L5
- Goodman et al. (1998) Goodman, A. A., Barranco, J. A., Wilner, D. J., & Heyer, M. H. 1998, ApJ, 504, 223
- Goodman et al. (1993) Goodman, A. A., Benson, P. J., Fuller, G. A., & Myers, P. C. 1993, ApJ, 406, 528
- Goodwin et al. (2007) Goodwin, S., Kroupa, P., Goodman, A., & Burkert A. 2007, in Protostars and Planets V, ed. B. Reipurth, D. Jewitt, & K. Keil (Tucson: Univ. Arizona Press), 133
- Henning & Launhardt (1998) Henning, Th., & Launhardt, R. 1998, A&A, 338, 223
- Henning et al. (2001) Henning, Th., Wolf, S., Launhardt, R., & Waters, R. 2001, ApJ, 561, 871
- Hodapp & Ladd (1995) Hodapp, K.-W., & Ladd, E. F. 1995, ApJ, 453, 715
- Jorgensen (2004) Jrgensen, J. K. 2004, A&A, 424, 589
- Knude et al. (1999) Knude, J., Jnch-Srensen, H., & Nielsen, A. S. 1999, A&A, 350, 985
- Launhardt (2001) Launhardt R. 2001, in The Formation of Binary Stars, IAU Symp. 200, ed. H. Zinnecker, & R. D. Mathieu (San Francisco: ASP), 117
- Launhardt (2004) Launhardt, R. 2004, in IAU Symp. 221, Star Formation at High Angular Resolution, ed. M. G. Burton, R. Jayawardhana, & T. L. Bourke (San Francisco: ASP), 213
- Launhardt & Henning (1997) Launhardt, R., & Henning, Th. 1997, A&A, 326, 329
- Launhardt et al. (2001) Launhardt, R., Sargent, A. I., Henning, Th. et al. 2001, Poster Proc. of IAU Symp. 200, 103
- Looney et al. (2000) Looney, L. W., Mundy, L. G., & Welch, W. J. 2000, ApJ, 529, 477
- Machida et al. (2005) Machida, M. N., Matsumoto, T., Hanawa, T., & Tomisaka, K. 2005, MNRAS, 362, 382
- Mardones et al. (1997) Mardones, D., Myers, P. C., Tafalla, M., Wilner, D. J., Bachiller, R., & Garay, G. 1997, ApJ, 489, 719
- Mundy et al. (2001) Mundy, L. E., Looney, L. W., Welch, W. J. 2001, in The Formation of Binary Stars, IAU Symp. 200, ed. H. Zinnecker, & R. D. Mathieu (San Francisco: ASP), 136
- Ossenkopf & Henning (1994) Ossenkopf, V., & Henning, Th. 1994, A&A, 291, 943
- Parise et al. (2006) Parise, B., Belloche, A., & Leurini, S. et al. 2006, A&A, 454, L79
- Persi et al. (1990) Persi, P., Ferrari-Toniolo, M., & Busso, M. et al. 1990, AJ, 99, 303
- Reipurth (1983) Reipurth, B. 1983, A&A, 117, 183
- Reipurth & Bally (2001) Reipurth, B., & Bally, J. 2001, ARA&A, 39, 403
- Reipurth et al. (2007) Reipurth, B., Jewitt, D., & Keil, K. (ed.) 2007, Protostars and Planets V (Tucson: Univ. Arizona Press)
- Sault et al. (1995) Sault, R. J., Teuben, P. J., & Wright, M. C. H. 1995, in ASP Conf. Ser. 77, Astronomical Data Analysis Software and Systems IV, ed. R. A. Shaw, H. E. Payne, & J. J. E. Hayes (San Francisco: ASP), 443
- Stahler & Palla (2004) Stahler, S. W., & Palla, F. 2004, The formation of stars (Wiley press)
- Tohline (2002) Tohline, J. E. 2002, ARA&A, 40, 349
- Williams et al. (1994) Williams, J. P., de Geus, E. J., & Blitz, L. 1994, ApJ, 428, 693
| Object | IRAS | R.A. & Dec. (J2000)a | Distance | Array | HPBWb | rmsc |
|---|---|---|---|---|---|---|
| Name | Source | [h : m : s, ] | [pc] | configuration | [arcsec] | [mJy/beam] |
| CG 30 | 080763556 | 08:09:33.0, 36:05:01.00 | 400 | H75+H168 | 4.63.3/4.63.2 | 65/0.5 |
| BHR 71 | 115906452 | 12:01:36.5, 65:08:49.49 | 200 | H75+H168 | 3.62.9/3.93.1 | 20/2.0 |
| Source | R.A.a | Dec.a | FWHM sizesa | b | c | |||
|---|---|---|---|---|---|---|---|---|
| (J2000) | (J2000) | [mJy] | maj.min. | P.A. | [] | [] | [] | |
| CG 30N | 08:09:33.12 | 36:04:58.12 | 15.83.2 | 5131 | 897° | 1.100.26 | 1.11 | 4.51 |
| CG 30S | 08:09:32.67 | 36:05:19.09 | 6.01.3 | 4831 | 7415° | 0.330.10 | 0.37 | 1.45 |
| BHR 71 IRS1 | 12:01:36.81 | 65:08:49.22 | 14028 | 7871 | 7320° | 2.120.41 | 2.64 | 9.94 |
| BHR 71 IRS2 | 12:01:34.09 | 65:08:47.36 | 2.82.1 | 2621 | 7640° | 0.050.02 | 2.18 | 2.58 |
| a | a | a | a | b | c | |
|---|---|---|---|---|---|---|
| Source | [km s-1] | [km s-1] | [K] | [km s-1] | [km s-1] | |
| CG 30 N | 6.640.02 | 0.530.03 | 1.00.1 | 4.660.09 | 0.510.01 | 0.47 |
| CG 30 S | 6.480.01 | 0.520.02 | 1.40.1 | 6.810.05 | 0.520.01 | 0.48 |
| BHR 71 E | 4.350.02 | 0.440.10 | 1.90.4 | 4.440.13 | 0.280.01 | 0.20 |
| BHR 71 W | 4.420.02 | 0.380.06 | 2.50.2 | 3.910.05 | 0.330.01 | 0.27 |
| Source | ||||||
|---|---|---|---|---|---|---|
| [AU] | [] | [106 cm-3] | [1012 cm-2] | [10-10 ] | [10-10] | |
| CG 30 N | 1300 | 0.38 | 6.2 | 1.29 | 0.51 | 1.83 |
| CG 30 S | 1650 | 0.55 | 4.5 | 3.42 | 1.94 | 4.85 |
| BHR 71 E | 960 | 0.13 | 5.3 | 1.95 | 0.34 | 3.63 |
| BHR 71 W | 730 | 0.11 | 10.3 | 1.87 | 0.21 | 2.52 |
| BHR 71 IRS1a | 3000 | 0.49 | 0.7 | 1.90 | 3.07 | 8.55 |
| mean velocity | ||||||
|---|---|---|---|---|---|---|
| Source | [km s-1] | [km s-1 pc-1] | [degree] | [km s-1] | [10-3 km s-1 pc] | |
| CG 30 N | 6.62 | 24.40.2 | 79.70.4 | 0.32 | 0.30 | 0.019 |
| CG 30 S | 6.45 | 17.80.2 | 33.90.3 | 0.29 | 0.35 | 0.014 |
| BHR 71 IRS1b | 4.39 | 7.80.5 | 1042.0 | 0.23 | 0.51 | 0.020 |
| R.A.b | Dec.b | |||||||
|---|---|---|---|---|---|---|---|---|
| Source | (J2000) | (J2000) | [mJy] | [mJy] | [mJy] | [mJy] | [mJy] | [mJy] |
| CG 30N | 08:09:33.20 | 36:04:58.17 | 55.71.4 | 123.42.1 | 256.13.0 | 395.83.8 | 3400100 | 8700430 |
| CG 30S | 08:09:32.68 | 36:05:20.38 | 6.70.5 | 16.80.8 | 19.60.8 | 9.60.6 | 505 | 4200340 |
| BHR 71 IRS1 | 12:01:36.57 | 65:08:49.52 | 32.41.1 | 82.41.7 | 123.32.1 | 210.22.8 | 5000300 | 84000800 |
| BHR 71 IRS2 | 12:01:34.05 | 65:08:47.03 | 4.50.4 | 12.40.7 | 15.40.7 | 9.30.6 | 9030 |
| Source | / | Classification | ||||
|---|---|---|---|---|---|---|
| [K] | [K] | [] | [] | [%] | ||
| CG 30N | 22 | 102 | 13.60.8 | 0.490.10 | 3.6 | Class I |
| CG 30S | 27 | 37 | 4.30.5 | 0.320.05 | 7.4 | Class 0 |
| BHR 71 IRS1 | 25 | 44 | 13.51.0 | 0.490.05 | 3.6 | Class 0/I |
| BHR 71 IRS2 | 26 | 58 | 0.50.1 | 0.020.01 | 3.4 | Class 0 |