The type IIb SN 2008ax: spectral and light curve evolution
Abstract
We present spectroscopy and photometry of the He-rich supernova (SN) 2008ax. The early-time spectra show prominent P-Cygni H lines, which decrease with time and disappear completely about two months after the explosion. In the same period He I lines become the most prominent spectral features. SN 2008ax displays the ordinary spectral evolution of a type IIb supernova. A stringent pre-discovery limit constrains the time of the shock breakout of SN 2008ax to within only a few hours. Its light curve, which peaks in the B band about 20 days after the explosion, strongly resembles that of other He-rich core-collapse supernovae. The observed evolution of SN 2008ax is consistent with the explosion of a young Wolf-Rayet (of WNL type) star, which had retained a thin, low-mass shell of its original H envelope. The overall characteristics of SN 2008ax are reminiscent of those of SN 1993J, except for a likely smaller H mass. This may account for the findings that the progenitor of SN 2008ax was a WNL star and not a K supergiant as in the case of SN 1993J, that a prominent early-time peak is missing in the light curve of SN 2008ax, and that H is observed at higher velocities in SN 2008ax than in SN 1993J.
keywords:
supernovae: general - supernovae: individual (SN 2008ax) - supernovae: individual (SN 1993J) - galaxies: individual (NGC 4490)1 Introduction
In recent years, the attention of the astronomical community toward H-poor core-collapse (CC) supernovae (SNe) has significantly increased. This is due to the discovery, during the late 90s, of the connection between H- and He-stripped CC SNe (of type Ic) and long duration gamma-ray bursts (GRBs, see e.g. Galama et al. 1998; Woosley & Bloom 2006). However, interest in He-rich events (type Ib) has been rather marginal so far, although recently invigorated by the discovery of early X-ray emission from the type Ib SN 2008D (SN 2008D, Soderberg et al. 2008; Malesani et al. 2008). Equally poorly studied are the very few SN events in which there is spectroscopic evidence for the presence of H lines in otherwise normal type Ib SN spectra. These rare CC SNe were dubbed as type IIb by Woosley et al. (1987) (see also Filippenko 1997), and their hybrid spectroscopic appearance was interpreted as the result of the explosion of a He core of an originally massive star, which had retained a residual (though marginal) H envelope (few 10-1M⊙) at the time of explosion.
The explosion of the very nearby SN 1993J offered the unique opportunity to study in detail the evolution of a type IIb event and to detect the progenitor star in pre-explosion images (Aldering et al. 1994; Cohen et al 1995; Van Dyk et al. 2002), although it would be more correct to state that the binary system producing SN 1993J was observed in the pre-SN images, since signatures of the presence of a massive, blue companion star arose from spectro-photometric observations of the SN site obtained about ten years after the SN explosion (Maund et al. 2004). These exceptional data constrained the precursor of SN 1993J to be a K supergiant of initial mass around 14M⊙, but with a He core of only 3-6M⊙ at the time of the explosion (see also Nomoto et al. 1993; Podsiaklowski et al. 1993; Woosley et al. 1994).
Another type IIb event, SN 2001ig, showed periodic modulation in its radio light curve. This may indicate either density enhancements indicative of circumstellar shells produced in the thermal-pulsing phase by a single asymptotic giant branch star or, more likely, a stellar wind modulated by motion in an eccentric binary system111Soderberg et al. (2006) also explained the observed modulation in the radio light curves of the type IIb SNe 2001ig and 2003bg in terms of density enhancements due to quasi-periodic mass loss episodes from massive WR progenitors, occurred soon prior to the SN explosions. (Ryder et al. 2004). The binary system scenario is also supported by spectropolarimetric observations of SN 2001ig (Maund et al. 2007). Interestingly, a point-like source was detected at the SN position about 1000 days after the explosion, possibly the massive (10-18M⊙) companion of the Wolf-Rayet (WR) star producing SN 2001ig (Ryder et al. 2006).
Apart from SN 1993J (e.g. Richmond et al. 1994; Lewis et al. 1994; Barbon et al. 1995), extensive data sets have been published for only a very limited number of He-rich CC SNe, including SNe 1987K (Filippenko et al. 1988), 1990I (Elmhamdi et al. 2004), 1996cb (Qiu et al. 1999), 1999dn (Deng et al. 2000; Benetti et al. in prep.), 1999ex (Stritzinger et al. 2002; Hamuy et al. 2002), 2008D (Soderberg et al. 2008), plus the peculiar SNe 1991D (Benetti et al. 2002), 2001gh (Elias-Rosa et al. in prep.) and 2005bf (Anupama et al. 2005; Tominaga et al. 2005; Folatelli et al. 2006). SN 2006jc and similar events (the so-called SNe Ibn, see Pastorello et al. 2008a) are different because the He is mostly confined in the circumstellar environment (Matheson et al. 2000; Pastorello et al. 2007; Foley et al. 2007; Smith et al. 2008; Immler et al. 2008; Mattila et al 2008; Tominaga et al. 2008; Pastorello et al. 2008b).
SN 2008ax is therefore the second He-rich CC SN that has excellent spectro-photometric monitoring, and for which we can derive directly information on the progenitor, through the analysis of deep pre-explosion archive images (Crockett et al. 2008). In this paper we present spectroscopy and photometry of SN 2008ax, while in the companion paper (Crockett et al. 2008) we study in detail the nature of the SN precursor.
2 SN 2008ax and its host galaxy
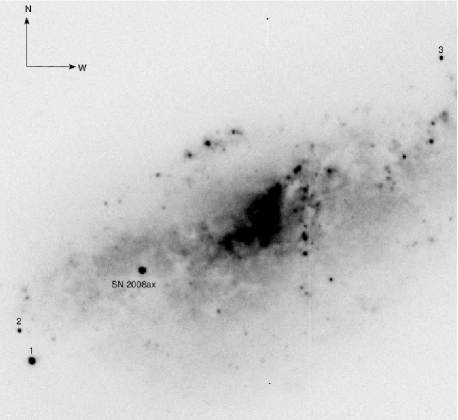
SN 2008ax (see Fig. 1) was discovered independently by Mostardi et al. (2008, on March 3.45 UT) and Nakano & Itagaki (2008, on March 4.62 UT) in the nearby barred spiral galaxy (type SBcd) NGC 4490. The new object was around 16th magnitude at discovery. The coordinates were = and = , quite far (531 East and 258 South) from the center of the host galaxy (Mostardi et al. 2008). Remarkably, the explosion site was monitored by Arbour (2008) about 6 hours (JD=2454528.7) before the detection of Mostardi et al. (2008) (JD 2454528.95) and the images show no sign of the SN. This allows us to constrain the time of the shock breakout to high precision, with an uncertainty of only a few hours. Hereafter in the paper we will adopt JD = 2454528.80 0.15 as the time of the shock breakout, and all phases will be computed with reference to this epoch.
NGC 4490 and NGC 4485 are a well known pair of late-type, interacting galaxies embedded in an extended and asymmetric H I envelope (Huchtmeier et al. 1980), which is elongated perpendicularly to the plane of NGC 4490. Clemens et al. (1998) claim that the configuration of the neutral hydrogen envelope might result from a bipolar outflow of H I driven by starburst activity / SN explosions, and not from the interaction between the two companion galaxies. This is in agreement with the particularly high star formation rate estimated in NGC 4490 (Viallefond et al. 1980; Thronson et al. 1989; Clemens et al. 1999).
The distance modulus () for NGC 4490 is not well constrained. From Tully (1988) and assuming a Hubble constant H0 = 72 km s-1 Mpc-1, we would obtain = 29.55 magnitudes. However, Roberts et al. (2002) noted that Tully (1988) gave significantly inconsistent distance estimates for the two interacting galaxies, 9.7 Mpc for NGC 4485 and 8.1 Mpc for NGC 4490 (with our choice of H0). This inconsistency in Tully’s estimate for the two companion galaxies suggests a need to compute the distance to NGC 4490 also using different approaches. An attempt to estimate the distance of the SN host galaxy was performed by Terry et al. (2002). It was determined from the technique of sosie galaxies (Paturel et al. 1994) making use of a number of different calibrators for which the distances were computed from two independent Cepheid calibrations. This method gives = 29.90 1.16 magnitudes (d = 9.5 Mpc). A further possibility is to derive the distance via the recessional velocity of the SN host galaxy. LEDA222http://leda.univ-lyon1.fr/ (Paturel et al. 2003) provides a recessional velocity for NGC 4490 corrected for Local Group infall into the Virgo Cluster of vVir = 797 km s-1. From this, we obtain a distance d of 11.1 Mpc, corresponding to a distance modulus = 30.22 magnitudes. If we consider the recessional velocity with respect to the CMB background (v3k = 817 km s-1), we obtain = 30.27 magnitudes (d = 11.3 Mpc). A lower distance is estimated from the recessional velocity corrected to the centroid of the Local Group, vlg = 618 km s-1, which gives = 29.67 magnitudes (d = 8.6 Mpc). Averaging these 5 estimates to minimize the uncertainty, we obtain = 29.92 0.29 magnitudes (i.e. d = 9.6 Mpc) which will be used throughout this paper.333A consistency check can be done by considering the pair NGC 4485 and NGC 4490 as members of the 14-4 group. An accurate distance of the group was obtained by Tully et al. (2008) through a weighted average of 4 different methods tied to the HST Cepheid Key Project scale (Freedman et al. 2001). Rescaling for consistency to H0 = 72 km s-1 Mpc-1, a distance modulus = 29.91 0.13 was obtained. This distance for the 14-4 group (d 9.6 Mpc) is fully consistent with our average estimate for NGC 4490.

The reddening due to the Galaxy in the direction of NGC 4490 is very small (E(B-V)=0.022 magnitudes, Schlegel et al. 1998). However, there is evidence of additional reddening inside the host galaxy (see discussion in Sect. 4) and therefore we will adopt the value E(B-V) = 0.3 magnitudes as the best estimate for the total extinction toward SN 2008ax.
The faint absolute magnitude measured at discovery (around -13.4) led Mostardi et al. (2008) to erroneously suggest that the SN was possibly an highly extinguished event or, alternatively, the super-outburst of a luminous blue variable. Instead, it was the first light coming from the explosion of one of the youngest stripped-envelope CC SNe ever discovered.
| Date | JD | u’ | B | V | g’ | r’ | i’ | z’ | Instrument |
|---|---|---|---|---|---|---|---|---|---|
| Mar 05 | 2454530.70 | 16.756 0.053 | 15.990 0.039 | 16.194 0.055 | 16.127 0.133 | P60 | |||
| Mar 05 | 2454530.79 | 16.802 0.089 | 16.034 0.076 | 16.185 0.038 | 16.093 0.031 | P60 | |||
| Mar 05 | 2454530.90 | 16.765 0.076 | 16.037 0.055 | 16.184 0.117 | P60 | ||||
| Mar 06 | 2454531.58 | 17.323 0.210 | 16.290 0.067 | 15.826 0.056 | 15.867 0.055 | LT | |||
| Mar 06 | 2454531.70 | 16.615 0.030 | 15.792 0.050 | 15.946 0.085 | 15.884 0.056 | P60 | |||
| Mar 06 | 2454531.79 | 16.657 0.139 | 15.781 0.048 | 15.997 0.126 | 15.837 0.087 | P60 | |||
| Mar 06 | 2454531.87 | 16.634 0.098 | 15.806 0.103 | 15.950 0.065 | 15.874 0.118 | P60 | |||
| Mar 06 | 2454531.96 | 16.614 0.033 | 15.785 0.039 | 16.006 0.105 | 15.817 0.026 | P60 | |||
| Mar 06 | 2454532.04 | 16.587 0.060 | P60 | ||||||
| Mar 07 | 2454532.55 | 17.021 0.032 | 15.952 0.042 | 15.509 0.024 | 15.576 0.027 | LT | |||
| Mar 07 | 2454533.03 | 16.277 0.102 | 15.395 0.129 | P60 | |||||
| Mar 08 | 2454533.53 | 17.794 0.069 | 16.548 0.029 | 15.528 0.014 | 15.233 0.019 | 15.258 0.017 | LT | ||
| Mar 08 | 2454533.69 | 15.992 0.072 | 15.265 0.109 | 15.377 0.099 | P60 | ||||
| Mar 08 | 2454533.78 | 16.004 0.053 | 15.206 0.085 | 15.359 0.104 | 15.190 0.085 | P60 | |||
| Mar 08 | 2454533.86 | 16.012 0.079 | P60 | ||||||
| Mar 09 | 2454534.57 | 17.226 0.040 | 16.082 0.017 | 15.270 0.011 | 14.974 0.012 | 15.012 0.011 | LT | ||
| Mar 10 | 2454535.60 | 16.746 0.035 | 15.766 0.018 | 14.983 0.012 | 14.778 0.012 | 14.771 0.009 | LT | ||
| Mar 10 | 2454536.49 | 16.435 0.036 | 15.545 0.021 | 14.819 0.013 | 14.654 0.016 | 14.624 0.014 | LT | ||
| Mar 11 | 2454536.68 | 15.236 0.043 | 14.745 0.227 | 14.678 0.087 | 14.451 0.080 | P60 | |||
| Mar 11 | 2454537.47 | 16.002 0.034 | 15.264 0.014 | 14.592 0.011 | 14.416 0.013 | 14.461 0.013 | LT | ||
| Mar 12 | 2454537.77 | 14.965 0.084 | 14.443 0.025 | 14.451 0.095 | 14.362 0.131 | P60 | |||
| Mar 13 | 2454538.68 | 14.888 0.059 | 14.342 0.034 | 14.344 0.067 | 14.283 0.124 | P60 | |||
| Mar 14 | 2454539.68 | 14.689 0.053 | 14.257 0.034 | 14.186 0.075 | 14.061 0.085 | P60 | |||
| Mar 14 | 2454540.42 | 15.298 0.028 | 14.695 0.013 | 14.133 0.010 | 14.007 0.012 | 13.932 0.010 | LT | ||
| Mar 15 | 2454541.43 | 15.099 0.031 | 14.538 0.015 | 14.005 0.010 | 13.907 0.014 | 13.856 0.013 | LT | ||
| Mar 18 | 2454543.55 | 14.759 0.031 | 14.354 0.016 | 13.808 0.010 | 13.710 0.012 | 13.633 0.011 | LT | ||
| Mar 18 | 2454543.67 | 14.145 0.181 | 13.749 0.102 | 13.641 0.132 | P60 | ||||
| Mar 18 | 2454544.36 | 14.700 0.040 | 14.338 0.014 | 13.714 0.010 | 13.677 0.011 | 13.546 0.010 | LT | ||
| Mar 19 | 2454544.66 | 14.147 0.050 | 13.714 0.083 | 13.564 0.062 | 13.561 0.052 | P60 | |||
| Mar 20 | 2454545.87 | 13.608 0.061 | 13.533 0.037 | 13.537 0.068 | P60 | ||||
| Mar 21 | 2454546.66 | 13.449 0.056 | P60 | ||||||
| Mar 21 | 2454547.36 | 14.669 0.300 | 14.165 0.020 | 13.546 0.012 | 13.448 0.011 | 13.345 0.010 | LT | ||
| Mar 24 | 2454549.65 | 13.971 0.050 | 13.436 0.030 | 13.366 0.069 | 13.456 0.338 | P60 | |||
| Mar 25 | 2454550.65 | 14.025 0.122 | 13.458 0.094 | 13.315 0.126 | 13.396 0.228 | P60 | |||
| Mar 26 | 2454551.64 | 13.981 0.019 | 13.454 0.149 | 13.322 0.075 | 13.274 0.046 | P60 | |||
| Mar 27 | 2454552.68 | 14.034 0.038 | 13.420 0.033 | 13.259 0.123 | 13.312 0.238 | P60 | |||
| Mar 28 | 2454553.64 | 14.117 0.049 | 13.429 0.092 | 13.287 0.144 | 13.276 0.095 | P60 | |||
| Mar 28 | 2454554.37 | 15.849 0.029 | 14.545 0.015 | 13.657 0.009 | 13.406 0.011 | 13.270 0.010 | LT | ||
| Mar 29 | 2454554.66 | 14.161 0.062 | 13.471 0.047 | 13.328 0.098 | 13.325 0.087 | P60 | |||
| Mar 29 | 2454555.47 | 16.149 0.026 | LT | ||||||
| Mar 31 | 2454556.56 | 16.441 0.025 | 14.877 0.012 | 13.837 0.009 | 13.578 0.011 | 13.371 0.009 | LT | ||
| Mar 31 | 2454556.75 | 14.391 0.111 | 13.574 0.056 | 13.380 0.110 | P60 | ||||
| Mar 31 | 2454557.37 | 16.719 0.034 | 15.060 0.014 | 13.915 0.010 | 13.642 0.011 | 13.398 0.015 | LT | ||
| Apr 01 | 2454557.64 | 14.515 0.049 | 13.658 0.118 | 13.432 0.127 | 13.383 0.041 | P60 | |||
| Apr 01 | 2454558.34 | 16.892 0.064 | 15.254 0.021 | 13.996 0.013 | 13.680 0.018 | 13.428 0.018 | LT | ||
| Apr 02 | 2454558.63 | 14.676 0.097 | 13.701 0.020 | 13.528 0.082 | 13.489 0.115 | P60 | |||
| Apr 03 | 2454559.70 | 14.669 0.049 | 13.759 0.122 | 13.482 0.035 | P60 | ||||
| Apr 03 | 2454560.48 | 17.325 0.034 | 15.460 0.014 | 14.168 0.009 | 13.821 0.013 | 13.525 0.018 | LT | ||
| Apr 04 | 2454560.63 | 14.828 0.074 | 13.856 0.109 | 13.566 0.068 | P60 | ||||
| Apr 05 | 2454561.75 | 17.518 0.032 | 15.587 0.013 | 14.244 0.010 | 13.902 0.012 | 13.567 0.011 | LT | ||
| Apr 05 | 2454562.38 | 17.606 0.069 | 15.636 0.017 | 14.346 0.012 | 13.962 0.012 | 13.621 0.011 | LT | ||
| Apr 12 | 2454569.37 | 18.044 0.056 | 16.066 0.014 | 14.687 0.012 | 14.305 0.011 | 13.895 0.009 | LT | ||
| Apr 14 | 2454571.37 | 18.078 0.044 | 16.133 0.017 | 14.741 0.011 | 14.401 0.012 | 13.972 0.010 | LT | ||
| Apr 15 | 2454572.37 | 18.090 0.089 | 16.162 0.018 | 14.796 0.012 | 14.423 0.014 | 13.992 0.039 | LT | ||
| Apr 16 | 2454573.38 | 18.095 0.032 | 16.177 0.014 | 14.832 0.011 | 14.436 0.013 | 14.012 0.015 | LT | ||
| Apr 18 | 2454575.36 | 18.099 0.062 | 16.231 0.021 | 14.867 0.010 | 14.482 0.011 | 14.065 0.010 | LT | ||
| Apr 19 | 2454576.37 | 18.106 0.041 | 16.255 0.015 | 14.903 0.011 | 14.528 0.013 | 14.096 0.011 | LT | ||
| Apr 20 | 2454577.40 | 18.120 0.043 | 16.288 0.016 | 14.930 0.010 | 14.571 0.011 | 14.124 0.010 | LT | ||
| Apr 21 | 2454578.37 | 18.126 0.043 | 16.293 0.019 | 14.951 0.011 | 14.586 0.016 | 14.147 0.013 | LT | ||
| Apr 22 | 2454579.38 | 18.124 0.038 | 16.293 0.017 | 14.961 0.011 | 14.607 0.011 | 14.160 0.016 | LT | ||
| Apr 25 | 2454581.50 | 18.151 0.070 | LT | ||||||
| Apr 30 | 2454586.68 | 16.425 0.038 | 15.114 0.015 | 14.800 0.014 | LT | ||||
| May 06 | 2454592.82 | 15.888 0.037 | 14.896 0.038 | 14.548 0.049 | 14.070 0.056 | P60 | |||
| May 08 | 2454594.72 | 15.910 0.052 | 14.958 0.045 | 14.590 0.056 | 14.094 0.058 | P60 | |||
| May 09 | 2454596.37 | 16.554 0.020 | 15.324 0.010 | 15.033 0.012 | 14.583 0.010 | LT | |||
| May 10 | 2454596.73 | 15.920 0.034 | 15.041 0.102 | 14.627 0.053 | 14.137 0.041 | P60 | |||
| May 12 | 2454599.38 | 18.149 0.031 | 16.571 0.017 | 15.376 0.010 | 15.100 0.011 | 14.611 0.012 | LT |
LT = 2-m Liverpool Telescope + RatCAM; P60 = Robotic Palomar 60-inch Telescope + CCD
3 The light curve
| Date | JD | CV | Cr’ | Observer |
|---|---|---|---|---|
| Mar 03 | 2454528.70 | 19.87 | 19.52 | RA |
| Mar 04 | 2454529.67 | 16.210 0.188 | WW | |
| Mar 04 | 2454529.68 | 16.220 0.200 | WW | |
| Mar 04 | 2454529.69 | 16.192 0.195 | WW | |
| Mar 04 | 2454530.12 | 16.272 0.090 | KI | |
| Mar 04 | 2454530.12 | 16.285 0.127 | KI | |
| Mar 04 | 2454530.13 | 16.282 0.109 | KI | |
| Mar 04 | 2454530.13 | 16.277 0.127 | KI | |
| Mar 04 | 2454530.14 | 16.271 0.078 | KI | |
| Mar 04 | 2454530.15 | 16.264 0.110 | KI | |
| Mar 04 | 2454530.15 | 16.259 0.088 | KI | |
| Mar 04 | 2454530.15 | 16.261 0.145 | KI | |
| Mar 04 | 2454530.16 | 16.255 0.079 | KI | |
| Mar 04 | 2454530.18 | 16.252 0.108 | KI | |
| Mar 04 | 2454530.25 | 16.249 0.104 | KI | |
| Mar 04 | 2454530.25 | 16.239 0.084 | KI | |
| Mar 04 | 2454530.29 | 16.229 0.141 | KI | |
| Mar 06 | 2454532.03 | 15.795 0.167 | KI | |
| Mar 07 | 2454533.41 | 15.562 0.031 | RA | |
| Mar 08 | 2454534.04 | 15.172 0.135 | KI | |
| Mar 10 | 2454536.05 | 14.751 0.083 | KI | |
| Mar 10 | 2454536.06 | 14.747 0.109 | KI | |
| Mar 11 | 2454537.21 | 14.536 0.114 | KI | |
| Mar 11 | 2454537.21 | 14.535 0.099 | KI | |
| Mar 12 | 2454538.01 | 14.356 0.136 | KI | |
| Mar 12 | 2454538.13 | 14.334 0.129 | KI | |
| Mar 13 | 2454538.51 | 14.457 0.040 | RA | |
| Mar 16 | 2454541.67 | 13.818 0.121 | WW | |
| Mar 17 | 2454543.24 | 13.718 0.126 | KI | |
| Mar 18 | 2454544.07 | 13.669 0.112 | KI | |
| Mar 18 | 2454544.25 | 13.660 0.129 | KI | |
| Mar 19 | 2454545.35 | 13.683 0.118 | RA | |
| Mar 21 | 2454546.97 | 13.468 0.113 | KI | |
| Mar 22 | 2454548.15 | 13.448 0.096 | KI | |
| Mar 27 | 2454553.39 | 13.634 0.043 | RA | |
| Mar 28 | 2454553.60 | 13.420 0.127 | WW | |
| Mar 28 | 2454553.72 | 13.413 0.100 | WW | |
| Mar 29 | 2454554.69 | 13.415 0.123 | WW | |
| Mar 29 | 2454555.17 | 13.448 0.118 | KI | |
| Mar 30 | 2454556.36 | 13.836 0.055 | RA | |
| Apr 04 | 2454560.84 | 13.863 0.086 | WW | |
| Apr 04 | 2454561.09 | 13.877 0.075 | KI | |
| Apr 04 | 2454561.40 | 14.219 0.060 | RA | |
| Apr 05 | 2454562.16 | 13.935 0.106 | KI | |
| Apr 06 | 2454563.07 | 14.017 0.063 | KI | |
| Apr 07 | 2454564.38 | 14.479 0.030 | RA | |
| Apr 09 | 2454566.35 | 14.575 0.044 | RA | |
| Apr 11 | 2454568.02 | 14.251 0.074 | KI | |
| Apr 14 | 2454571.18 | 14.387 0.121 | KI | |
| Apr 14 | 2454571.41 | 14.750 0.046 | RA | |
| Apr 23 | 2454580.39 | 14.973 0.074 | RA | |
| May 01 | 2454588.47 | 15.140 0.048 | RA | |
| May 06 | 2454593.40 | 15.237 0.026 | RA | |
| May 08 | 2454594.78 | 14.985 0.059 | WW |
RA = 40cm f/5 Newtonian + SXV-H9 CCD (R. Arbour, UK)
WW = 35cm C14 OTA + DSI Pro II w/Sony EXview HAD CCD (ICX 429) (W. Wiethoff, US)
KI = 60cm f/5.7 + Bitran BT-214E CCD (Kodak KAF-1001E) (K. Itagaki, Japan)
SN 2008ax is one of the best ever monitored core-collapse SNe, starting with a deep pre-explosion image obtained only 6 hours prior to the SN discovery of Mostardi et al. (2008). The observational campaign of SN 2008ax started soon after the discovery and covered a period of about 70 days. Photometry has been obtained at the 2-m Liverpool Telescope (Steele et al . 2004) in La Palma (Canary Islands, Spain) and the 60-inch Telescope of the Palomar Observatory (Cenko et al. 2006). In addition, unfiltered data collected by amateur astronomers have been used in our analysis. These data have been scaled to the Johnson-Bessell V-band or the Sloan r’-band photometry, depending on the sensitivity curves of the CCDs used in these observations. We find that the quantum efficiency (QE) curve of the SXV-H9 CCD used by R.A. peaks around 5100Å, so the unfiltered magnitudes of this images are best compared to the V-band magnitudes, while both the DSI Pro II and the KAF-1001E cameras used by W.W. and K.I., respectively, have CCDs with QEs peaking around 6000-6200Å. Therefore, the unfiltered magnitudes obtained with these two imagers are scaled to the Sloan r’ magnitudes.
| Band | JD(max) | Rise time (days) | M()max |
|---|---|---|---|
| u’ | 2454546.20.4 | 17.4 | 14.650.02 |
| B | 2454547.70.5 | 18.9 | 14.160.03 |
| g’ | 2454549.30.6 | 20.5 | 13.950.02 |
| V | 2454549.50.5 | 20.7 | 13.510.02 |
| r’ | 2454551.10.5 | 22.3 | 13.380.03 |
| i’ | 2454551.60.6 | 22.8 | 13.260.02 |
| z’ | 2454553.11.0 | 24.3 | 13.280.03 |
| Date | JD | Phase | Instrumental configuration | Exposure time (s) | Spectral range (Å) | Res. (Å) |
|---|---|---|---|---|---|---|
| Mar 12 | 2454538.38 | 9.6 | Wise 40-inch + FOSC + g600 | 23600 | 3990–8230 | 18 |
| Mar 18 | 2454544.35 | 15.6 | Wise 40-inch + FOSC + g600 | 21800 | 3990–8240 | 18 |
| Mar 29 | 2454554.64 | 25.8 | Palomar 200-inch + TSPEC | 5200 | 9500–13500,14050–18150,19230–24670 | |
| Mar 31 | 2454556.70 | 27.9 | Palomar 200-inch + DBSP +g300+g316 | 260+2120 | 3100–5480,5650–8170 | 9.5,13 |
| Apr 01 | 2454557.69 | 28.9 | Palomar 200-inch + DBSP +g300+g316 | 360 | 3100–5470,5650–8170 | 6,7 |
| Apr 02 | 2454558.70 | 29.9 | Palomar 200-inch + DBSP +g300+g316 | 360 | 3100–5460,5650–8170 | 7.5,9 |
| Apr 08 | 2454565.34 | 36.5 | Wise 40-inch + FOSC + g600 | 3600 | 4010–8210 | 18 |
| Apr 28 | 2454584.64 | 55.8 | Palomar 200-inch + DBSP +g600+g316 | 2200 | 3130–5590,5640–9690 | 3.5,9.5 |
1.2 Å in the J band, 2.9 Å in the K band
Johnson-Bessell B and V, and Sloan u’, g’, r’, i’ and z’ photometry of SN 2008ax is presented in Tab. 1, while the unfiltered amateurs’ data are in Tab. 2. The resulting light curves (including the calibrated amateurs data) are shown in Fig. 2. Like in many H-stripped core-collapse SNe the peak luminosity in the blue bands is reached a few days earlier than in the red (about 19 days after the shock breakout in the B band and 23 in the i’ band, see Tab. 3). After maximum, the light curves decline rapidly in all bands until day 40, when the SN luminosity settles onto the radioactive tail.
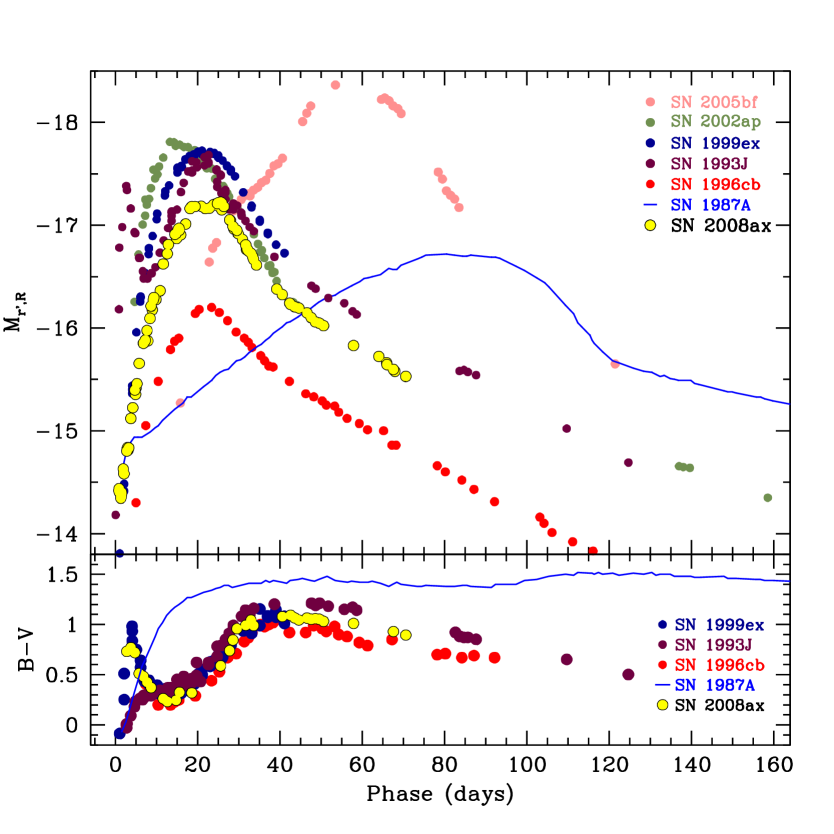
H-poor core-collapse supernovae display a wide range of behaviour in their light curve evolution. In Fig. 3 (top) we compare the r’-band absolute light curve of SN 2008ax with those (Sloan r’ or Johnson-Bessell R) of a number of H-poor SNe (see caption of Fig. 3 for details). In particular, we note that the light curve of SN 2008ax is remarkably different from that of the peculiar type II SN 1987A (that shares some early-time spectroscopic similarity with SN 2008ax, see Sect. 4). It is instead similar to those of the H-stripped core-collapse events shown in Figure 3. The overall shape resembles that of the type IIb SNe 1996cb and 1993J. In particular, its peak magnitude (MR -17.3 magnitudes) is quite similar to that of SN 1993J (the difference is M 0.3), but is significantly brighter (by 1 magnitude) than that of SN 1996cb. A major difference between the two SNe is that SN 2008ax does not show the prominent and narrow early-time peak exhibited by the light curve of SN 1993J. This peak is attributed to the initial shock heating and the subsequent cooling of a low-mass envelope (see e.g. Bartunov et al. 1994; Shigeyama et al. 1994). In SN 2008ax only a marginally detectable shoulder during the first day after shock breakout was observed, in analogy to that reported by Stritzinger et al. (2002) in the type Ib SN 1999ex. This possibly due to SN 2008ax having an initial radius that was smaller than that of SN 1993J.
In Fig. 3 (bottom) we also compare the colour evolution of SN 2008ax with those of the type II SN 1987A, the type Ib SN 1999ex and the type IIb SNe 1993J and 1996cb. SN 1987A has a different colour evolution compared to the other three objects, that evolve in a rather similar fashion (apart from the early-time blue excess due to the shock breakout visible in SN 1993J). In particular, during the first 10 days SN 2008ax becomes rapidly bluer, moving from B-V = 0.8 to 0.2 (note that the colour evolution of SN 1993J follows the opposite trend in this phase). During the subsequent period, SN 2008ax (and the other type Ib/IIb events in Fig. 3) becomes redder, reaching B-V = 1.1 at phase 40 days. Then, the colour becomes slowly bluer again with time.
4 The metamorphosis of SN 2008ax

SN 2008ax showed an amazing spectral evolution, transforming in a few weeks through many different spectral types. Blondin et al. (2008) initially classified it as a young 1987A-like type II SN. The strong interstellar Na I D absorption visible in the spectrum of Blondin et al. (2008) also suggested significant host galaxy reddening, E(B-V) = 0.6. The presence of prominent H and He I lines, with blueshifted peaks, was indicative of very rapid spectral evolution, another characteristic in common with SN 1987A. The most important difference was the much broader spectral lines in SN 2008ax, corresponding to ejecta velocities in the range 23000-26000 km s-1. In SN 1987A they were lower by a factor 2/3.
However, subsequent spectra showed increasing Fe II, Ca II and, most significantly, He I features, suggesting that this SN should be re-classified as a type IIb (Chornock et al. 2008). Also, based on a new measurement of the EW of the Na I interstellar doublet (0.18nm), Chornock et al. (2008) used an unspecified method to revise the estimate of the host galaxy contribution to the reddening to E(B-V) = 0.5 magnitudes.
Marion et al. (2008), analysed a near-infrared (NIR) spectrum of SN 2008ax, and noted the presence of prominent He I features at 1.08 and 2.06 microns and a weak Paschen . These features make this spectrum similar to the early-time NIR spectra of SN Ib 1999ex (Hamuy et al. 2002). The transition of SN 2008ax toward a type Ib event was also revealed by optical spectra collected by Taubenberger et al. (2008). However, Taubenberger et al. (2008) pointed out that some H was still visible in their spectra, although less prominent than the stronger He I lines.
We collected a sequence of optical spectra of SN 2008ax using the 40-inch Telescope at the Wise Observatory (Israel) equipped with a Faint Object Spectrographic Camera (FOSC) and the 200-inch Hale Telescope at the Palomar Observatory (California, US) equipped with the Double Spectrograph (DBSP, Oke & Gunn 1982). The log of spectroscopic observations is in Tab. 4. All these spectra show relatively strong interstellar Na ID, whose equivalent width (EW) is about 1.8Å, in excellent agreement with the value reported by Chornock et al. (2008). However, adopting the relation between EW and E(B-V) derived by Turatto et al. (2003), we obtain E(B-V) 0.3, which is significantly smaller than the reddening estimate of Blondin et al. (2008) and Chornock et al. (2008).

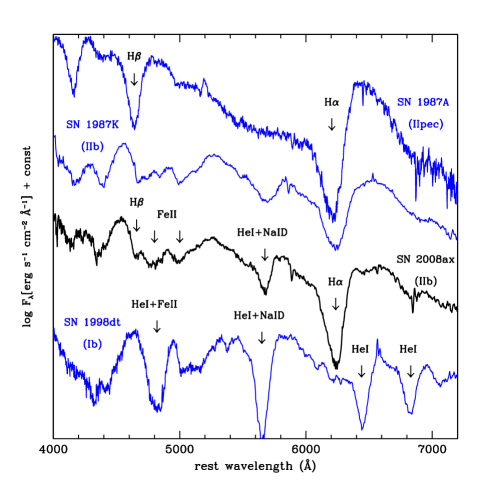
The metamorphosis of SN 2008ax, whose spectrum transitioned through different spectral types (IIIIbIb) is shown in Fig. 4, while a comparison with early spectra of the peculiar type II-plateau SN 1987A, the normal SN Ib 1998dt and the type IIb event 1987K is shown in Fig. 5 (two of these spectra have been downloaded from the SUSPECT 444http://bruford.nhn.ou.edu/∼suspect/index1.html database). It is remarkable that the H feature, which is strong in the early-time spectra of SN 2008ax, progressively weakens and disappears 2 months after core-collapse (Fig. 4). In this phase, the spectrum of SN 2008ax is that of a type Ib SN. SN 1987K experienced an analogous ”identity crisis” (Filippenko et al. 1988), with the early-time spectra being rather similar to those of an H-rich type II SN (e.g. 1987A, see Fig. 5) and very different from those of a canonical type Ib. Some months later, however, SN 1987K evolved toward a spectrum dominated by Ca and O forbidden lines and not containing the H line in emission, which should be present in a type II SN in the nebular phase. This wide-ranging spectral evolution seems to be quite common in type IIb SNe: to a lesser extent, an analogous transition was seen in the spectra of SNe 1993J (Lewis et al. 1994; Barbon et al. 1995), 1996cb (Qiu et al. 1999) and 2001ig (Maund et al. 2007).
The evolution of the line velocities, measured from the position of the P-Cygni minima of He I 5876Å, He I 7065Å, H and Fe II 5169Å is shown in Fig. 6, both for SN 2008ax and SN 1993J (data from Barbon et al. 1995). It is remarkable that the velocities of the two type IIb SNe are comparable, although the velocity of H, after the initial drop, remains much higher in SN 2008ax than in SN 1993J, while that of Fe II 5169Å is lower in SN 2008ax than in SN 1993J. This, and the evidence that H is missing in the spectrum obtained two months after the explosion, suggest that the H envelope is probably less massive in SN 2008ax than in SN 1993J
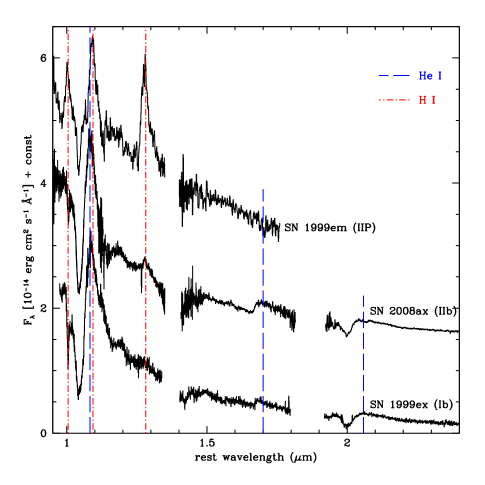
SN 2008ax was also observed in the near-infrared (NIR) a few days past maximum (on March 29, 2008) with the Triple Spectrograph (TSPEC, Wilson et al. 2004) mounted at the 200-inch Hale Telescope. This spectrum is compared with those of the type Ib SN 1999ex and the type II-plateau SN 1999em about 3-4 weeks after the explosion in Fig. 7. The most important H and He I lines in the NIR region are marked (the He I lines with dashed blue lines, the H lines with dot-dashed red lines). The most prominent feature in all the spectra is a P-Cygni line peaking around 10900 Å. In SN 1999em this feature is likely due to a blend of Paschen and He I (with the possible contribution of C I, see Pastorello 2003), while in SNe 2008ax and 1999ex it is mostly He I 10830Å. Other He I lines identified in the spectra of both SNe 1999ex and 2008ax are at about 17000Å and 20580Å. In agreement with what we find in the optical spectra, some H is also still visible in the NIR spectrum of SN 2008ax. Paschen , which was prominent in SN 1999em, is indeed visible (though weak) in SN 2008ax at 12820Å, while it was not definitely detected in the type Ib SN 1999ex. This is consistent with the classification of SN 2008ax as a type IIb event.
5 Discussion
Although the spectra of SN 2008ax are dominated by He I lines, the presence of H features in the early-time spectra is unequivocal (see Fig. 4 and Fig. 7), suggesting that this SN should be classified as a type IIb event. We showed in Sect. 3 and Sect. 4 that SN 2008ax shares many similarities with other well studied SNe IIb (e.g. 1993J and 1996cb). Nevertheless, the light curves of these SNe are also similar to those of totally H-stripped SNe Ib (see Fig. 3), indicating that the presence of a residual H skin does not significantly affect the luminosity evolution of SNe IIb. The most significant difference between the light curves of type Ib/IIb SNe lies in their intrinsic luminosity, which is dependent on the amount of 56Ni ejected in the explosion.
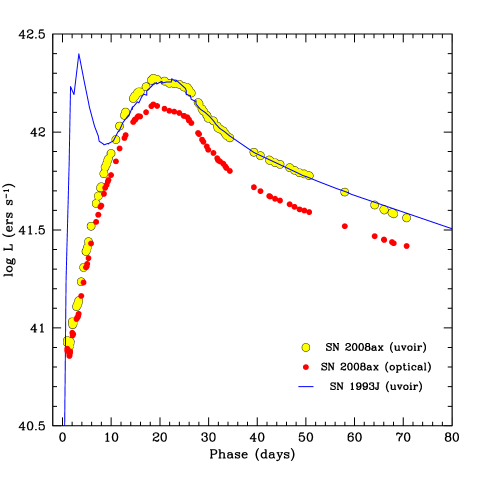
In order to estimate the 56Ni mass synthesized by SN 2008ax, its quasi-bolometric (uvoir) light curve was computed and compared with that of SN 1993J. The uvoir light curve of SN 1993J was obtained by integrating the flux in the optical and NIR bands (using the data of Lewis et al. 1994; Barbon et al. 1995; Wada & Ueno 1997; Matthews et al. 2002). The observed optical light curve of SN 2008ax (Fig. 8, open red points) was rescaled, assuming for this object the same fractional NIR contribution to the uvoir light curve as SN 1993J (solid blue line). The uvoir light curve of SN 2008ax is shown in Fig. 8 with filled yellow symbols. Surprisingly, there is an excellent agreement in the uvoir luminosity between the two SNe. This is contrary to what we observed in individual bands (see e.g. Fig. 3), where SN 2008ax was slightly more luminous than SN 1993J in the blue bands and fainter in the red bands. The similar uvoir luminosity implies that the two objects have roughly the same mass of ejected 56Ni. In SN 1993J the 56Ni mass was around 0.07-0.11⊙ (see discussion below), and this is also the 56Ni mass range expected for SN 2008ax.
There is also a similarity in the overall shape of the light curves of SN 2008ax and SN 1993J, with the exception of the initial strong contribution of the shock breakout to the early time light curve of SN 1993J. This raises the issue of whether the progenitor and the explosion parameters are similar in these two SNe. The width of the light curve during the photospheric phase and the slope of the radioactive tail are known to depend on both the kinetic energy (Ek) and the ejected mass (Eej) (Arnett 1982). In particular, the comparable widths of the light curve peaks of SNe 1993J and 2008ax suggest a similar value for the M/Ek ratio (Arnett 1982), which, however, does not necessarily imply that Mej and Ek are themselves similar.
Additional information on the individual values of Mej and Ek could be obtained from the spectroscopy. The square of the photospheric velocity in envelope-stripped CC SNe is indeed proportional to the Ek/Mej ratio (Arnett 1982). Since the velocity of the Fe II 5169Å line is only marginally lower in SN 2008ax than in SN 1993J at the same phase (see Fig. 6, right-bottom panel), this may be an indication of comparable ejected masses and energies in the two SNe. Most theoretical papers on SN 1993J (e.g. Nomoto et al. 1993; Podsiaklowski et al. 1993; Woosley et al. 1994; Bartunov et al. 1994; Utrobin 1994; Shigeyama et al. 1994; Young et al. 1995) converge toward a standard-energy explosion (Ek 1051 erg) of a 3-6M⊙ He core with a residual H skin (few 10-1 M⊙). From an inspection of the observed SN properties, we therefore expect similar ejecta and explosion parameters for SN 2008ax.
An attempt to derive the ejecta mass and explosion energy was performed for the type Ib SN 1999ex by Stritzinger et al. (2002) using a comparison with the 6C hydrogenless model of Woosley et al. (1987) for SNe Ib. Values of M 5-6M⊙ and E 3 1051 erg were derived for that SN. Recently, Soderberg et al. (2008) obtained similar values for the type Ib SN 2008D: M 5M⊙ and E 2 1051 erg. However, the light curves of these two SNe are slightly broader than that of 2008ax, whose shape, and hence likely its explosion and ejecta parameters, are probably closer to those of the type IIb SNe 1993J and 1996cb.
Aldering et al. (1994), from an analysis of deep pre-explosion images, found that the progenitor of the type IIb SN 1993J was a K supergiant. The SN precursor was an originally massive (12-17M⊙) member of a binary system, in which the two companions had comparable main sequence masses (Maund et al. 2004). In the case of SN 2008ax, the final configuration of the progenitor was likely a WR (WNL) star (either a single, massive WR or a lower-mass WR in an interacting binary system, see Crockett et al. 2008) with a residual H shell ( 0.1M⊙). The spectroscopic and photometric evolution of SN 2008ax agrees with this progenitor type.
Unlike SN 1993J, whose companion star was detected (Maund et al. 2004), the direct observation of the precursor of SN 2008ax in pre-explosion HST images does not (at present) allow us to definitely discriminate between a single star or a binary system. In the single-star scenario, the progenitor had a relatively high-mass (8-9M⊙) C/O core and a final mass (C/O core + He/H envelope) in the range 11-13M⊙ (Crockett et al. 2008). The mass of the C/O core was a factor of two times higher than that of the star that generated SN 1993J. This would imply that the progenitor of SN 2008ax was a star with a main sequence mass of about 25-30M⊙, significantly higher than the 12-17 M⊙ estimated for SN 1993J. However, such a high C/O mass estimated for SN 2008ax would be expected to affect the shape of its light curve, making it broader than what is observed. This raises a potential problem in the interpretation of the observed SN evolution.
Alternatively, the progenitor could have been an initially less massive star (10-14M⊙) in a binary system, embedded in a coeval cluster. In this case other objects are expected to contaminate the magnitude and colour estimates of the source at the position of the progenitor in the images analysed by Crockett et al. (2008). If this is true, multiple sources near the SN position will be eventually recovered in future observations of the explosion site.
6 Conclusions
SN 2008ax has a number of observational properties in common with other type IIb SNe. In particular the shape of the optical light curves, the bolometric luminosity and the spectral line velocities resemble those of SN 1993J. This suggests for the two events similar explosion and ejecta parameters. However, the evolution of the spectra of SN 2008ax toward a totally H-deprived (Ib) spectral type is faster than in SN 1993J. In addition, SN 2008ax does not show the prominent early-time optical peak related to the shock breakout, and has slightly bluer colours compared with SN 1993J. This indicates that the two SNe are similar, but not identical.
Two different progenitors could produce SNe like 2008ax: a single, high-mass star that lost mass via strong stellar winds to become a massive WNL or, alternatively, a less-massive star that had its envelope stripped away through interaction with a companion star (Crockett et al. 2008). The latter scenario agrees better with the SN evolution.
Detailed modelling of the SN data is required to provide a robust estimate of the explosion and ejecta parameters, which is key information to finally unveil the nature of the WR star that exploded as SN 2008ax.
Acknowledgments
This manuscript is partly based on observations collected at the Hale Telescope, Palomar Observatory, as part of a collaborative agreement
between the California Institute of Technology, its divisions Caltech Optical Observatories and the Jet Propulsion
Laboratory (operated for NASA), and Cornell University.
The paper is also based on observations obtained at the 60-inch Telescope of the Palomar Observatory and 2-m Liverpool Telescope.
The Liverpool Telescope is operated on the island of La Palma by Liverpool John Moores University in the
Spanish Observatorio del Roque de los Muchachos of the Instituto de Astrofisica de Canarias with financial
support from the UK Science and Technology Facilities Council.
We thank John Dann of the Wise Observatory staff for his expert
assistance with the observations.
This work, conducted as part of the award ”Understanding the lives of
massive stars from birth to supernovae” (S.J. Smartt) made under the
European Heads of Research Councils and European Science Foundation
EURYI (European Young Investigator) Awards scheme, was supported by
funds from the Participating Organisations of EURYI and the EC Sixth
Framework Programme. S.J.S also thanks the Leverhulme Trust for
funding through the Philip Leverhulme Prize scheme.
The work of D.S. was carried out at Jet Propulsion Laboratory,
California Institute of Technology, under a contract with NASA. A.G. acknowledges the Benoziyo Center for
Astrophysics and the William Z. and Eda Bess Novick New Scientists Fund at the Weizmann Institute
of Science.
We acknowledge the usage of the HyperLeda database (http://leda.univ-lyon1.fr).
References
- Aldering et al. (1994) Aldering, G., Humphreys, R. M., Richmond, M. 1994, AJ, 107, 662
- Anupama et al. (2005) Anupama, G. C., Sahu, D. K., Deng, J., Nomoto, K., Tominaga, N., Tanaka, M., Mazzali, P. A., Prabhu, T. P. 2005, ApJ, 631L, 125
- Arbour (2008) Arbour, R. 2008, CBET 1286, 2
- Arnett (1982) Arnett, W. D. 1982, ApJ, 253, 785
- Barbon et al. (1995) Barbon, R., Benetti, S., Cappellaro, E., Patat, F., Turatto, M., Iijima, T. 1995, A&AS, 110, 513
- Bartunov et al. (1994) Bartunov, O. S., Blinnikov, S. I., Pavlyuk, N. N., Tsvetkov, D. Yu. 1994, A&A, 281L, 53
- Benetti et al. (2002) Benetti, S., Branch, D., Turatto, M., Cappellaro, E., Baron, E., Zampieri, L., Della Valle, M., Pastorello, A. 2002, MNRAS, 336, 91
- Benetti et al. (in prep.) Benetti, S. et al. in preparation
- Blondin et al. (2008) Blondin, S., Filippenko, A. V., Foley, R. J., Li, W., Dessart, L. 2008, CBET 1285
- Branch et al. (2002) Branch, D. et al. 2002, ApJ, 566, 1005
- Catchpole et al. (1987) Catchpole, R. M. et al. 1987, MNRAS, 229, 15
- Catchpole et al. (1988) Catchpole, R. M. et al. 1988, MNRAS, 231, 75
- Cenko et al. (2006) Cenko, S. B. et al. 2006, PASP, 118, 1396
- Chornock et al. (2008) Chornock, R., Filippenko, A. V., Li, W., Foley, R. J., Stockton, A., Moran, E. C., Hodge, J., Merriman, K. 2008, CBET, 1298, 1
- Clemens et al. (1998) Clemens, M. S., Alexander, P., Green, D. A. 1998, MNRAS, 297, 1015
- Clemens et al. (1999) Clemens, M. S., Baxter, K. M., Alexander, P., Green, D. A. 1999, MNRAS, 308, 364
- Cohen et al (1995) Cohen, J. G, Darling, J., Porter, A. 1995, AJ, 110, 308
- Crockett et al. (2008) Crockett et al. 2008, MNRAS, submitted (arXiv:0805.1913)
- Deng et al. (2000) Deng, J. S., Qiu, Y. L., Hu, J. Y., Hatano, K., Branch, D. 2000, ApJ, 540, 452
- Elias-Rosa et al. (in prep.) Elias-Rosa, N. et al. in preparation
- Elmhamdi et al. (2003) Elmhamdi, A. et al. 2003, MNRAS, 338, 939
- Elmhamdi et al. (2004) Elmhamdi, A., Danziger, I. J., Cappellaro, E., Della Valle, M., Gouiffes, C., Phillips, M. M., Turatto, M. 2004, A&A, 426, 963
- Filippenko et al. (1988) Filippenko, A. V. 1988, AJ, 96, 1941
- Filippenko (1997) Filippenko, A. V. 1997, ARA&A, 35, 309
- Folatelli et al. (2006) Folatelli, G. et al. 2006, ApJ, 641, 1039
- Foley et al. (2003) Foley, R. et al. 2003, PASP, 115, 1220
- Foley et al. (2007) Foley, R. et al. 2007, ApJ, 657L, 105
- Freedman et al. (2001) Freedman, W. L. et al. 2001, ApJ, 553, 47
- Galama et al. (1998) Galama, T. J. et al. 1998, Nature, 395, 670
- Gal-Yam et al. (2002) Gal-Yam, Avishay, Ofek, E. O., Shemmer, O. 2002, MNRAS, 332L, 73
- Hamuy et al. (2002) Hamuy, M. et al. 2002, AJ, 124, 417
- Howell et al. (2005) Howell, D. A. et al. 2005, ApJ, 634, 1190
- Huchtmeier et al. (1980) Huchtmeier, W. K., Seiradakis, J. H., Materne, J. 1980, A&A, 91, 341
- Immler et al. (2008) Immler, S. et al. 2008, ApJ, 674L, 85
- Lewis et al. (1994) Lewis, J. R. et al. 1994, MNRAS, 266, L27
- Malesani et al. (2008) Malesani et al. 2008, ApJL submitted (arXiv:0805.1188)
- Marion et al. (2008) Marion, H., Garnavich, P., Gerardy, C. L., Rudy, R. J., Lynch, D. K., Russell, R. W., Woodward, C. E. 2008, CBET 1305, 1
- Matheson et al. (2000) Matheson, T., Filippenko, A. V., Chornock, R., Leonard, D. C.; Li, W. 2000, AJ, 119, 2303
- Matheson et al. (2001) Matheson, T., Filippenko, A. V., Li, W., Leonard, D. C., Shields, J. C. 2001, AJ, 121, 1648
- Matthews et al. (2002) Matthews, K., Neugebauer, G., Armus, L., Soifer, B. T. 2002, AJ, 123, 753
- Mattila et al (2008) Mattila, S. et al. 2008, MNRAS, accepted (arXiv:0803.2145)
- Maund et al. (2004) Maund, J. R., Smartt, S. J., Kudritzki, R. P., Podsiadlowski, P., Gilmore, G. F. 2004, Nature, 427, 129
- Maund et al. (2007) Maund, J. R., Wheeler, J. C., Patat, F., Wang, L., Baade, D., Höflich, P. A. 2007, ApJ, 671, 1944
- Menzies et al. (1988) Menzies, J. D. et al. 1987, MNRAS, 227, 39
- Mostardi et al. (2008) Mostardi, R., Li, W., Filippenko, A. V. 2008, CBET 1280
- Nakano & Itagaki (2008) Nakano, S., Itagaki, K. 2008, CBET 1286, 1
- Nomoto et al. (1993) Nomoto, K., Suzuki, T., Shigeyama, T., Kumagai, S., Yamaoka, H., Saio, H. 1993, Nature, 364, 507
- Oke & Gunn (1982) Oke, J. B., Gunn, J. E. 1982, PASP, 94, 586
- Pastorello (2003) Pastorello, A. 2003, PhD thesis, University of Padova
- Pastorello et al. (2007) Pastorello, A. et al. 2007, Nature, 447, 829
- Pastorello et al. (2008a) Pastorello, A. et al. 2008a, MNRAS accepted (arXiv:0801.2277)
- Pastorello et al. (2008b) Pastorello, A. et al. 2008b, MNRAS accepted (arXiv:0801.2278)
- Paturel et al. (1994) Paturel, G., Bottinelli, L., di Nella, H., Fouque, P., Gouguenheim, L., Teerikorpi, P. 1994, A&A, 289, 711
- Paturel et al. (2003) Paturel, G., Petit, C., Prugniel, P., Theureau, G., Rousseau, J., Brouty, M., Dubois, P., Cambrésy, L. 2003, A&A, 412, 45
- Podsiaklowski et al. (1993) Podsiaklowski, Ph., Hsu, J. J. L., Joss, P. C., Ross, R. R. 1993, Nature, 364, 509
- Pun et al. (1995) Pun, C. S. J. et al. 1995, ApJS, 99, 223
- Qiu et al. (1999) Qiu, Y., Li, W., Qiao, Q., Hu, J. 1999, AJ, 117, 736
- Richmond et al. (1994) Richmond, M. W., Treffers, R. R., Filippenko, A. V., Paik, Y., Leibundgut, B., Schulman, E., Cox, C. V. 1994, AJ, 107, 1022
- Roberts et al. (2002) Roberts, T. P., Warwick, R. S., Ward, M. J., Murray, S. S. 2002, MNRAS, 337, 677
- Ryder et al. (2004) Ryder, S. D., Sadler, E. M., Subrahmanyan, R., Weiler, K. W., Panagia, N., Stockdale, C. 2004, MNRAS, 349, 1093
- Ryder et al. (2006) Ryder, S. D., Murrowood, C. E., Stathakis, R. A. 2006, MNRAS, 369L, 32
- Schlegel et al. (1998) Schlegel, D. J., Finkbeiner, D. P., Davis, M. 1998, ApJ, 500, 525
- Shigeyama et al. (1994) Shigeyama, T., Suzuki, T., Kumagai, S., Nomoto, K., Saio, H., Yamaoka, H. 1994, ApJ, 420, 341
- Smith et al. (2008) Smith, N., Foley, R. J., Filippenko, A. V. 2007, ApJ, 680, 568
- Soderberg et al. (2006) Soderberg, A. M., Chevalier, R. A., Kulkarni, S. R., Frail, D. A. 2006, 651, 1005
- Soderberg et al. (2008) Soderberg, A. M. et al. 2008, Nature, 453, 469
- Steele et al . (2004) Steele, I. A. et al. 2004, Ground-based Telescopes. Edited by Oschmann, Jacobus M., Jr. Proceedings of the SPIE, Volume 5489, pp. 679-692
- Stritzinger et al. (2002) Stritzinger, M. D. et al. 2002, AJ, 124, 2100
- Taubenberger et al. (2008) Taubenberger, S., Elias-Rosa, N., Harutyunyan, A., Navasardyan, H., Benetti, S. 2008, CBET 1309, 1
- Terry et al. (2002) Terry J.N., Paturel G., Ekholm T. 2002, A&A, 393, 57
- Thronson et al. (1989) Thronson, H. A., Jr., Hunter, D. A., Casey, S., Harper, D. A., Latter, W. B. 1989, ApJ, 339, 803
- Tominaga et al. (2005) Tominaga, N. et al. 2005, ApJ, 633L, 97
- Tominaga et al. (2008) Tominaga, N. et al. 2008, ApJ submitted (arXiv:0711.4801)
- Tomita et al. (2006) Tomita, H. et al. 2006, ApJ, 644, 400
- Tully (1988) Tully, R. B. 1988, Nearby galaxies catalog, Cambridge and New York, Cambridge University Press, 1988, 221 p.
- Tully et al. (2008) Tully, R. B., Shaya, E. J., Karachentsev, I. D., Courtois, H. M., Kocevski, D. D., Rizzi, L., Peel, A. 2008, ApJ, 676, 184
- Turatto et al. (2003) Turatto, M., Cappellaro, E., Benetti, S. 2003, in Leibundgut B., Hillebrandt W., eds, Proc. to the ESO/MPA/MPE Workshop (an ESO Astrophysics Symp.), From Twilight to Highlight: the Physics of Supernovae, Springer-Verlag, Berlin, p. 200
- Utrobin (1994) Utrobin, V. 1994 A&A, 281L, 89
- Van Dyk et al. (2002) Van Dyk, S. D., Garnavich, P. M., Filippenko, A. V., Höflich, P., Kirshner, R. P., Kurucz, R. L., Challis, P. 2002, PASP, 114, 1322
- Viallefond et al. (1980) Viallefond, F., Allen, R. J., de Boer, J. A. 1980, A&A, 82, 207
- Wada & Ueno (1997) Wada, T., Ueno, M. 1997, AJ, 113, 231
- Wilson et al. (2004) Wilson, J. C. et al. 2004, Ground-based Instrumentation for Astronomy, edited by Alan F. M. Moorwood and Iye Masanori, proceedings of the SPIE, volume 5492, pp. 1295-1305 (2004)
- Woosley et al. (1987) Woosley, S. E., Pinto, P. A., Martin, P. G., Weaver, T. A. 1987, ApJ, 318, 664
- Woosley et al. (1994) Woosley, S. E., Eastman, R. G., Weaver, T. A., Pinto, P. A. 1994, ApJ, 429, 300
- Woosley & Bloom (2006) Woosley, S. E., Bloom, J. S. 2006, ARA&A, 44, 507
- Young et al. (1995) Young, T. R., Baron, E., Branch, D. 1995, ApJ, 449L, 51
- Yuzuru et al. (2002) Yuzuru, Y. et al. 2003, ApJ, 592, 467