Mid-Infrared Spectra of High Redshift () Radio Galaxies
Abstract
We present the first mid-infrared Spitzer/Infrared Spectrograph (IRS) observations of powerful radio galaxies at . These radio galaxies, 4C +23.56 (=) and 6C J1908+7220 (=), both show strong mid-infrared continua, but with 6C J1908+7220 also showing strong PAH emission at rest-frame 6.2 and . In 4C +23.56 we see no obvious PAH features above the continuum. The PAH emission in 6C J1908+7220 is the amongst the most distant observed to date and implies that there is a large instantaneous star formation rate (SFR). This is consistent with the strong detection of 6C J1908+7220 at far-IR and sub-mm wavelengths, indicative of large amounts of cold dust, . Powerful radio galaxies at lower redshifts tend to have weak or undetectable PAH features and typically have lower far-IR luminosities. In addition, 4C +23.56 shows moderate silicate absorption as seen in less luminous radio galaxies, indicating =. This feature is shifted out of the observed wavelength range for 6C J1908+7220. The correlation of strong PAH features with large amounts of cold dust, despite the presence of a powerful AGN, is in agreement with other recent results and implies that star formation at high redshift is, in some cases at least, associated with powerful, obscured AGN.
Subject headings:
galaxies: active — galaxies: high-redshift — galaxies: evolution – radio galaxies: individual(4C +23.56, 6C J1908+7220)1. Introduction
There is now clear evidence that high redshift, powerful radio galaxies (HzRGs; and Hz-1) have massive, M⊙, stellar hosts (Seymour et al. 2007; see also Lilly & Longair 1984; De Breuck et al. 2001; Rocca-Volmerange et al. 2004) and that the stellar mass of these hosts is related to the radio power of the HzRGs (Lacy et al., 2000; Willott et al., 2003). The strong radio and mid-IR continuum luminosities of these rare sources imply high accretion rates onto their central massive black holes (Ogle et al., 2006; Seymour et al., 2007). There is also evidence for extremely high SFRs from the strong sub-mm emission seen in some HzRGs (Archibald et al., 2001; Reuland et al., 2004; Greve et al., 2006), as well as from the spectacular ( kpc) luminous Ly haloes observed in many HzRGs (Reuland et al., 2003; Villar-Martín et al., 2003). As the time scales of both the radio jets and star formation are very short (Gyr), and as HzRGs are rare objects, it seems we are observing these sources at a special phase during a strong spurt of coeval black hole and galaxy growth, but when both processes are dust-enshrouded.
Aside from sub-mm/far-IR observations, the only other method to obtain an approximate measure of the SFR in HzRGs is from the mid-IR PAH emission features. This diagnostic is known to be inexact, especially in AGN, but UV/optical SFR diagnostics (e.g. narrow lines) are particularly difficult for HzRGs, as are radio/X-ray diagnostics. All these observables are known to be significantly contaminated by the powerful AGN. A correlation between PAH and sub-mm luminosity has been found in local starbursts (Haas et al., 2002; Peeters et al., 2004) showing that PAH emission can be used as an approximate tracer of star formation. There are now several results in the literature linking PAH emission and the presence of cold dust associated with star formation (Lacy et al. 2007; Pope et al. 2007; Sajina et al. 2008).
This letter presents Spitzer/IRS spectra of two HzRGs from our sample of 69 HzRGs studied by Seymour et al. (2007): 4C +23.56 at = and 6C J1908+7220 (less commonly known as 4C +72.26) at =. Very few HzRGs have photometry at and even fewer are bright enough to be easily targeted by IRS. We select two of three HzRGs with mJy which are also detected at . While these HzRGs may not be representative of the entire population, even this small sample shows diverse mid-IR properties.
We also fit the total IR, , SEDs of these HzRGs and compare the model fits to the IRS spectra. We adopt the concordance CDM cosmology with =, =, and =.
2. The Spitzer Mid-IR Spectra
The IRS spectra of 4C +23.56 were obtained as part of our Cycle 4 GTO program (PI G. Fazio) and consisted of 12 ramp cycles of 120 s each with just the LL1 module (). 6C J1908+7220 was observed as part of a Cycle 1 GO program (PI M. Haas) and the data include 3 cycles with the SL1 module, and 3 cycles with both the LL1 and LL2 modules. We used the interactive IRSCLEAN1 task to remove bad pixels in the Spitzer post-BCD images and extracted the spectra with SPICE111These codes are publicly available from the SSC website: http://ssc.spitzer.caltech.edu/postbcd/irs_reduction.html. using ‘optimal’ extraction. The spectra were smoothed by different amounts in each module varying from at the shortest wavelengths to at the longest wavelengths.
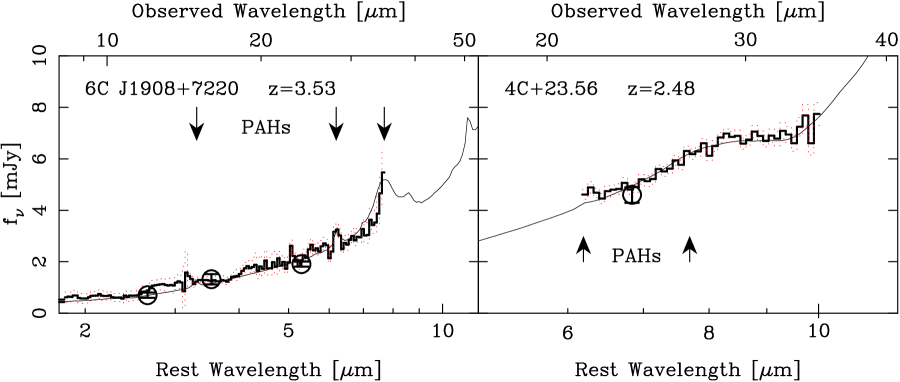
Figure 1 presents the IRS spectra and Figure 2 presents full infrared spectral energy distributions (SEDs) of both HzRGs using all available data from to (see Table Mid-Infrared Spectra of High Redshift () Radio Galaxies). Our flux densities are updated from Seymour et al. (2007) due to newer, improved calibrations for the observing mode used. The spectra agree well with the photometric data at the same wavelength.
Both 4C +23.56 and 6C J1908+7220 show strong continuum luminosities consistent with the very high, monochromatic rest-frame luminosities, (), presented by Seymour et al. (2007). However, these two HzRGs differ in the strength of their PAH complex — which is clearly seen in 6C J1908+7720, despite the presence of a known powerful AGN, but is undetected in 4C +23.56. PAH emission in a powerful radio galaxy is unusual; lower redshift radio galaxies and other AGN generally have much weaker PAH emission (e.g. Haas et al., 2005; Ogle et al., 2006; Cleary et al., 2007; Shi et al., 2007). In fact, the integrated PAH luminosity of 6C J1908+7720 is the highest of any source we are aware of, though the strong mid-infrared continuum conspires to make the observed PAH feature equivalent width rather modest.
The mid-infrared spectrum of 4C +23.56 is quite different. Rather than showing PAH emission features, the observations of 4C +23.56 extend longward enough to show a flattening at rest-frame wavelengths greater than which we interpret as the onset of the silicate absorption feature. The steep slope of the continuum from 24 to , , for both sources is confirmed by the high measured flux densities at . The full IR SED fitting, described in the following section, finds a silicate absorption of = for 4C +23.56. This value is high compared to most lower redshift radio galaxies of comparable luminosity (Ogle et al., 2006; Cleary et al., 2007), but low compared to the sources in Sajina et al. (2007b) which have far lower radio luminosities, but reside at similar redshifts. The redshift of 6C J1908+7220 makes it impossible to derive a measure of the silicate absorption feature from Spitzer/IRS spectroscopy.
3. Full Infrared SED fitting
Here we supplement our Spitzer observations which cover the range with observations from SCUBA, CSO and IRAM which provide detections and upper limits for the range. These data are presented in Table Mid-Infrared Spectra of High Redshift () Radio Galaxies and the references are given therein. We use the same model to fit these data as that used by Sajina et al. (2007a) and Lacy et al. (2007) which includes five components: an old (5 Gyr) stellar component, three dust components of different temperatures (hot, cold and warm) and a PAH model. The age of the stellar population is unimportant as the wavelength range used in this fitting (the near-IR) varies very little for populations older than 1 Gyr. The far-infrared (far-IR) emission was fit as a modified cold blackbody with temperature K. A warm (small grain) component was included with a power-law index of and cutoffs at high and low frequency. The far-IR starburst luminosity, , was calculated simply from the cold dust component. The hot dust component, associated with Very Small Grains, was based on a power-law with variable spectral index and was exponentially cut off at high frequencies with a variable cutoff frequency. The AGN luminosity, , was calculated from summing the hot and warm components. The hot dust component is then reddened by a dust screen assumed to have the Galactic center extinction law of Chiar & Tielens (2006), likely to be a good approximation to the extreme density environments of AGNs (Sajina et al., 2007a). Geometries other than a simple screen may be less efficient at obscuring, hence this estimate is a likely lower limit. We then use a PAH model template based on observations of NGC 7714 which we find to have no significant difference to M82 (Sajina et al., 2007a). During the fitting several components were fixed: the amplitude of the stellar component was taken from Seymour et al. (2007), and the short-wavelength cut-off of the hot component and the slope of the warm component were also fixed. For 4C +23.56 the cold dust component was fixed to the maximum allowed value and for 6C J1908+7220 the reddening was fixed to zero as we could not constrain it via the silicate absorption feature.
The principle difference in the observed SEDs, presented in Figure 2, is that 6C J1908+7220, with it’s strong PAH emission features, is detected at both from CSO/SHARCII and at from JCMT/SCUBA in contrast to 4C +23.56 (which has not been observed at or detected in SCUBA observations). While the non-detection of 4C +23.45 with SCUBA may be due to its lower redshift (and the negative k-correction at sub-mm wavelengths), the total far-IR luminosity is constrained to be significantly less than that of 6C J1908+7220. The results of our fitting for both HzRGs are presented in Table 2, including total far-IR luminosities, inferred AGN luminosities, PAH strengths, dust mass, optical depth, and inferred SFR. For 4C +23.56 many of these quantities are upper limits.
In addition to the detections at and , the upper limits at and provide strong constraints on the amount and temperature of cold dust in 6C J1908+7220. We obtain a starburst far-IR luminosity of (yr-1, Kennicutt 1998) where the modified black-body cold dust parameters are constrained to be =K and = following the approach of McMahon et al. (1999). This result implies of cold dust. We find an approximate upper-limit to the cold dust in 4C +23.56 of for =K. Using the Pope et al. (2007) relations, the SFR in 6C J1908+7220 inferred from our PAH luminosity is yr-1, around a factor of two higher than that inferred from the far-IR luminosity, albeit with considerable uncertainty due to the scatter in this relation. We are able to provide upper limits to the PAH and the far-IR (starburst) luminosity for 4C +23.56. These limits are relatively high, hence the SFR in 4C +23.56 could still be at a level considered extreme in the local Universe, yr-1.
4. Interpretation and Conclusions
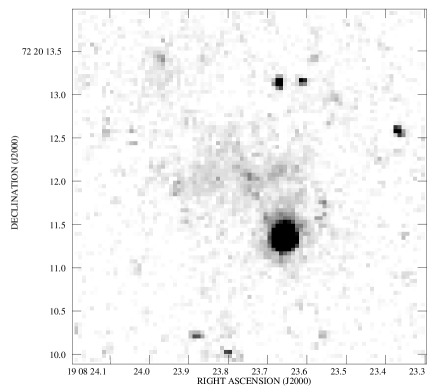
The clear presence of PAHs in 6C J1908+7220, a known powerful AGN, is consistent with results at lower redshift where PAH emission is seen in AGN and quasar host spectra (Shi et al., 2007). PAHs can survive the high radiation environment of the AGN if shielded by an obscuring torus or located far enough from the AGN that they are simply stimulated and not destroyed. An HST WFPC2 image of 6C J1908+7220 taken with the F702W filter (PI G. Miley) indicates extended, irregular star formation in the rest-frame far UV supporting the view of star formation occurring away from the nucleus in an irregular morphology (see Figure 3). The absence of PAH emission from 4C +23.56 is potentially due to destruction by the AGN, but could also simply be due to the relatively lower intrinsic SFR. No HST imaging of sufficient quality is available for this source, but it does possess a relatively large Ly halo (Villar-Martín et al., 2007) implying at least a reasonably large reservoir of material for star formation.
Both HzRGs have deep UV spectropolarimetry (Dey, 1999; Vernet et al., 2001). 4C +23.56 is highly polarized (=), while 6C J1908+7220 is unpolarized () and shows broad absorption lines. The contribution of a scattered AGN is therefore expected to be much higher in 4C +23.56 than in 6C J1908+7220. As 4C +23.56 is almost two magnitudes fainter than 6C J1908+7220 at optical wavelengths (= for 4C +23.56 compared to = for 6C J1908+7220 Chambers et al., 1996; Pentericci et al., 2000), the remaining rest-frame continuum emission (i.e. UV radiation from hot stars), after correction for the scattered AGN emission, is at least an order of magnitude fainter in 4C +23.56 than in 6C J1908+7220. While the determination of SFRs from the rest-frame UV continuum remains very uncertain in these objects, this large difference does suggest a much higher SFR in 6C J1908+7220, consistent with our IRS results.
The mid-IR luminosities and 70/ flux density ratios (roughly equivalent to 15/ rest-frame) of these two HzRGs are at the high end of the distribution of the radio galaxies studied by Ogle et al. (2006) and Seymour et al. (2007). However, there is a marked difference in their 8 to slope, beyond the fact they sample slightly different rest frame wavelengths. The steeper 8 to slope of 4C +23.56 indicates a much more powerful AGN relative to the host galaxy rest-frame near-IR luminosity (and hence stellar mas) compared to 6C J1908+7220.
The mid-IR luminosities and slopes of these sources are also similar to high redshift selected ULIRGs studied by several groups (e.g., Yan et al., 2007; Dey et al., 2008). This similarity is not surprising given the selection of those samples (very red from band to and mJy), but does support our earlier comment that HzRG are representative of a larger population which experience brief periods of extreme AGN activity and obscured star formation. In fact, some of these -selected ULIRGs do host radio-loud AGN (Sajina et al., 2007b), but have radio luminosities several orders of magnitudes less than the sources presented here. Additionally, the correlation between the presence of PAH and strong emission from cold dust has been seen in Spitzer selected type 2 AGN (Lacy et al. 2007; Sajina et al. 2008). Further IRS and far-IR observations would provide us with an excellent opportunity to examine how star formation is related to the obscuration of powerful AGN and their radio-loud phase.
References
- Archibald et al. (2001) Archibald, E. N., Dunlop, J. S., Hughes, D. H., Rawlings, S., Eales, S. A., & Ivison, R. J. 2001, MNRAS, 323, 417
- Chambers et al. (1996) Chambers, K. C., Miley, G. K., van Breugel, W. J. M., Bremer, M. A. R., Huang, J.-S., & Trentham, N. A. 1996, ApJS, 106, 247
- Chiar & Tielens (2006) Chiar, J. E. & Tielens, A. G. G. M. 2006, ApJ, 637, 774
- Cleary et al. (2007) Cleary, K., Lawrence, C. R., Marshall, J. A., Hao, L., & Meier, D. 2007, ApJ, 660, 117
- De Breuck et al. (2001) De Breuck, C., van Breugel, W., Stanford, S. A., Röttgering, H., Miley, G., & Stern, D. 2001, AJ, 1754, 637
- Dey (1999) Dey, A. 1999, in The Most Distant Radio Galaxies, ed. H. J. A. Röttgering, P. N. Best, & M. D. Lehnert, 19
- Dey et al. (2008) Dey, A., Soifer, B. T., Desai, V., Brand, K., LeFloc’h, E., Brown, M. J., Jannuzi, B. T., Armus, L., Bussmann, S., Brodwin, M., Bian, C., Eisenhardt, P., Higdon, S., Weedman, D., & Willner, S. 2008, ApJ in press
- Greve et al. (2006) Greve, T. R., Ivison, R. J., & Stevens, J. A. 2006, Astronomische Nachrichten, 327, 208
- Haas et al. (2002) Haas, M., Klaas, U., & Bianchi, S. 2002, A&A, 385, L23
- Haas et al. (2005) Haas, M., Siebenmorgen, R., Schulz, B., Krügel, E., & Chini, R. 2005, A&A, 442, L39
- Kennicutt (1998) Kennicutt, R. C., Jr. 1998, ARA&A, 36, 189
- Lacy et al. (2000) Lacy, M., Bunker, A. J., & Ridgway, S. E. 2000, AJ, 120, 68
- Lacy et al. (2007) Lacy, M., Sajina, A., Petric, A. O., Seymour, N., Canalizo, G., Ridgway, S. E., Armus, L., & Storrie-Lombardi, L. J. 2007, ApJ, 669, L61
- Lilly & Longair (1984) Lilly, S. J. & Longair, M. S. 1984, MNRAS, 211, 833
- McMahon et al. (1999) McMahon, R. G., Priddey, R. S., Omont, A., Snellen, I., & Withington, S. 1999, MNRAS, 309, L1
- Ogle et al. (2006) Ogle, P., Whysong, D., & Antonucci, R. 2006, ApJ, 647
- Papadopoulos et al. (2000) Papadopoulos, P. P., Röttgering, H. J. A., van der Werf, P. P., Guilloteau, S., Omont, A., van Breugel, W. J. M., & Tilanus, R. P. J. 2000, ApJ, 528, 626
- Peeters et al. (2004) Peeters, E., Spoon, H. W. W., & Tielens, A. G. G. M. 2004, ApJ, 613, 986
- Pentericci et al. (2000) Pentericci, L., Van Reeven, W., Carilli, C. L., Röttgering, H. J. A., & Miley, G. K. 2000, A&AS, 145, 121
- Pope et al. (2007) Pope, A., Chary, R.-R., Alexander, D. M., Armus, L., Dickinson, M., Elbaz, D., Frayer, D., Scott, D., & Teplitz, H. 2007, ArXiv e-prints, 711
- Reuland et al. (2004) Reuland, M., Röttgering, H., van Breugel, W., & De Breuck, C. 2004, MNRAS, 353, 377
- Reuland et al. (2003) Reuland, M. et al. 2003, ApJ, 592, 755
- Rocca-Volmerange et al. (2004) Rocca-Volmerange, B., Le Borgne, D., De Breuck, C., Fioc, M., & Moy, E. 2004, A&A, 415, 931
- Sajina et al. (2007a) Sajina, A., Yan, L., Armus, L., Choi, P., Fadda, D., Helou, G., & Spoon, H. 2007a, ApJ, 664, 713
- Sajina et al. (2007b) Sajina, A., Yan, L., Lacy, M., & Huynh, M. 2007b, ApJ, 667, L17
- Sajina et al. (2008) Sajina, A., et al. 2008, ArXiv e-prints, 805, arXiv:0805.0263
- Seymour et al. (2007) Seymour, N., Stern, D., De Breuck, C., et al. 2007, ApJS, 171, 353
- Shi et al. (2007) Shi, Y., Ogle, P., Rieke, G. H., Antonucci, R., Hines, D. C., Smith, P. S., Low, F. J., Bouwman, J., & Willmer, C. 2007, ApJ, 669, 841
- Siebenmorgen et al. (2004) Siebenmorgen, R., Freudling, W., Krügel, E., & Haas, M. 2004, A&A, 421, 129
- Vernet et al. (2001) Vernet, J., Fosbury, R. A. E., Villar-Martin, M., Cohen, M. H., Cimatti, A., di Serego Alighieri, S., & Goodrich, R. W. 2001, A&A, 366, 7
- Villar-Martín et al. (2007) Villar-Martín, M., Humphrey, A., De Breuck, C., Fosbury, R., Binette, L., & Vernet, J. 2007, MNRAS, 375, 1299
- Villar-Martín et al. (2003) Villar-Martín, M. et al. 2003, MNRAS, 346, 273
- Willott et al. (2003) Willott, C. J., McLure, R. J., & Jarvis, M. J. 2003, ApJ, 587, L15
- Yan et al. (2007) Yan, L., Sajina, A., Fadda, D., Choi, P., Armus, L., Helou, G., Teplitz, H., Frayer, D., & Surace, J. 2007, ApJ, 658, 778
| HzRG | wavelength | flux density | reference |
|---|---|---|---|
| 6C J1908+7220 | 3.6 | 1 | |
| 4.5 | 1 | ||
| 5.8 | 1 | ||
| 8.0 | 1 | ||
| 12 | 2 | ||
| 16 | 3 | ||
| 24 | 1 | ||
| 70 | 1 | ||
| 160 | 1 | ||
| 350 | 4 | ||
| 450 | 5 | ||
| 850 | 6 | ||
| 1250 | 6 | ||
| 4C +23.56 | 3.6 | 1 | |
| 4.5 | 1 | ||
| 5.8 | 1 | ||
| 8.0 | 1 | ||
| 16 | 2 | ||
| 24 | 1 | ||
| 70 | 1 | ||
| 160 | 1 | ||
| 450 | 7 | ||
| 850 | 7 |
| HzRG | z | EW | SFRFIR | ||||||
|---|---|---|---|---|---|---|---|---|---|
| ergs-1Hz-1 | yr-1 | ||||||||
| 6C J1908+7220 | 3.53 | n/aaaThe silicate feature is not covered by current observations. | |||||||
| 4C +23.56 | 2.48 | n/abbThe PAH feature is not detected in this source. |