Discovery of a strong Baldwin effect in mid-infrared AGN lines††thanks: Based on ESO observing programmes 078.B-0303, 080.B-0240, and the DDT program 280.B-5068.
We present the discovery of a Baldwin effect in 8 nearby Seyfert galaxies for the three most prominent mid-infrared forbidden emission lines observable from the ground that are commonly found in AGN, [Ar iii](), [S iv](), and [Ne ii](). The observations were carried out using the VLT/VISIR imager and spectroraph at the ESO/Paranal observatory. The bulk of the observed line emission comes from the inner 04 which corresponds to spatial scales 100 pc in our object sample. The correlation index is approximately without significant difference among the lines. This is the strongest anti-correlation between line equivalent width and continuum luminosity found so far. In the case of Circinus, we show that despite the use of mid-infrared lines, obscuration by either the host galaxy or the circumnuclear dust torus might affect the equivalent widths. Given the small observed spatial scales from which most of the line emission emanates, it is unclear how these observations fit into the favored “disappearing NLR” scenario for the narrow-line Baldwin effect.
Key Words.:
Galaxies: Seyfert – Galaxies: nuclei – Infrared: galaxies – quasars: emission lines – X-rays: galaxies1 Introduction
The Baldwin effect, a negative correlation between equivalent width, , and continuum luminosity, , is commonly found in broad UV/optical emission lines of AGN. Initially, it was reported for the C iv(1549) line (Baldwin 1977) for which , but later also found in emission lines of many other species for which the strength of the correlation depends on the ionization potential of the respective line (e.g. Dietrich et al. 2002). Although the Baldwin effect is well established, its physical origin is still a matter of debate. A common explanation refers to the spectral shape of the ionizing continuum which appears softer in high luminosity sources than in AGN with lower luminosities. This results in a relatively lower number of ionizing photons in the broad-line region (BLR) which, in turn, leads to a smaller . While this explanation is, at least, qualitatively in agreement with the observed dependence on line ionization energy, it is not clear if is the fundamental parameter that drives the broad-line Baldwin effect (BLBE). Instead, a similar effect has been observed if is replaced by the black hole mass, , or the Eddington ratio, (e.g. Wandel 1999; Warner et al. 2004).
In addition to the BLBE, several narrow optical emission lines have been found to show a Baldwin effect with similar order-of-magnitude luminosity-dependence as well (hereafter: oNLBE; e.g. Brorsen & Green 1992; McIntosh et al. 1999; Croom et al. 2002). Given the different spatial scales where the broad- and the narrow-lines are emitted, it is generally believed that the driving physical mechanisms for the BLBE and oNLBE are different (e.g. Shields 2007, and references therein). A luminosity-dependence of the equivalent width, sometimes referred to as Iwasawa-Taniguchi effect, is also known for the narrow K-line in X-rays (e.g. Iwasawa & Taniguchi 1993; Bianchi et al. 2007).
In this letter, we present our discovery of a strong Baldwin effect in nearby Seyfert galaxies for the most prominent narrow emission lines that are present in AGN mid-infrared spectra and observable from the ground, in particular [Ar iii](), [S iv](), and [Ne ii](). The Baldwin Effect in these mid-infrared forbidden lines (hereafter: iNLBE) is much stronger than for any other as yet observed. In Sect 2, we report on details about the VLT/VISIR observations. In Sect. 3, the results are presented, followed by a discussion of our finding in Sect. 4. This paper (hereafter: paper I) presents first results on line emission of our larger campaign using VLT/VISIR which is dedicated to mid-infrared spectroscopy of nearby AGN at high spatial resolution. A forthcoming paper (hereafter: paper II) will deal with the mid-infrared continuum emission of AGN. In the following, we will use cosmological parameters , , and (Spergel et al. 2007).
2 Observations
We used the mid-infrared imager and spectrograph VISIR located at the 8 m UT3 telescope of the ESO/Paranal observatory. With VISIR, we observed a sample of 8 nearby AGN of which 5 are Seyfert 2 (S1h, S1i, S2) and 3 are Seyfert 1 (S1.0, S1.5) galaxies. The -band spectra were acquired in low spectral resolution mode (R300), for which 4 different wavelength settings centered at 8.5, 9.8, 11.4, and 12.4 have to be combined for each object. With VISIR, the achieved spatial resolution in this wavelength range is , which is a factor smaller than the used slit widths of making slit losses negligible. The resulting spectra were extracted using the standard VISIR CPL pipeline (V3.0.0) and calibrated by a number of generic standard stars. For NGC 4507, a single standard star observed within the same night has been used for calibration. In addition to the 8 objects, archival VISIR data of NGC 1068 and NGC 253 has been downloaded, extracted, and calibrated in the same way. A more detailed description of the observations will be presented in paper II. NGC 4593 has been observed only in the 8.5 and 9.8 settings, corresponding to a restframe wavelength coverage of approximately . As a result, only [Ar iii]() is seen in the combined spectrum, giving data in this line on a total of 8 objects. For [S iv](), and [Ne ii](), equivalent widths of 7 objects is available.
3 The Baldwin effect in forbidden mid-IR lines
3.1 Results
| object | type a | b | scale c | ([Ar iii]) | ([S iv]) | ([Ne ii]) | ref. | |
|---|---|---|---|---|---|---|---|---|
| (Mpc) | (pc) | () | () | () | ( erg/s) | |||
| NGC 1068 | S1h | 14.4 d | 21.4 | 1 | ||||
| ESO 428–G14 | S2 | 22.3 | 33.2 | 1 | ||||
| MCG–5–23–16 | S1i | 39.5 | 58.8 | 2 | ||||
| NGC 4507 | S1h | 54.5 | 80.9 | 3 | ||||
| Circinus | S1h | 4.2 e | 6.2 | 1 | ||||
| MCG–3–34–64 | S1h | 63.3 | 94.2 | 3 | ||||
| NGC 3783 | S1.5 | 44.7 | 66.5 | 3 | ||||
| NGC 3227 | S1.5 | 20.4 | 30.4 | 4 | ||||
| NGC 4593 | S1.0 | 42.0 | 62.5 | 5 | ||||
| NGC 253 | S | 3.5 f | 5.2 | 1 |
-
— References: (1) -correlation from Horst et al. (2008) using 12 VISIR fluxes for NGC 1068 (14 Jy), Circinus (10 Jy), ESO 428–G14 (0.22 Jy), and NGC 253 (2.1 Jy)); (2) Balestra et al. (2004); (3) Horst et al. (2008); (4) mean of recent 2–10 keV (Cappi et al. 2006) and 17–60 keV (Sazanov et al. 2007) data taken, 60% error inferred due to variability; (5) Shinozaki et al. (2006)
In Table 1, we present extracted of all three lines. For all objects, the line emission was strongly peaked towards the nucleus. Except for the emission in the most nearby objects NGC 1068 (% extension in [S iv] with respect to the continuum PSF) and Circinus (50% extension in [S iv] and [Ne ii]), no spatial extension was detected in the continuum and the lines. The reduction was done in a way that even for these extended objects, almost no line flux is lost by the extraction window. The errors on represent the uncertainty due to the determination of the shape of continuum emission underlying the emission line. This uncertainty is in part due to the presence of sky lines in those spectra which were taken under unfavorable atmospheric conditions (e.g. high amount of precipitable water vapor). This affects the [Ne ii] line the most since strong atmospheric bands are present between . On the other hand, the error bars of the [Ar iii] line are predominantly caused by the general weakness of the line with respect to the continuum.
In addition to the line ś, Table 1 lists (absorption-corrected) keV X-ray luminosities, , for our sample of AGN. These are taken as a measure for the ionizing continuum luminosity since the UV/optical AGN emission of our type 2 sources is heavily affected by dust absorption from the putative circumnuclear dust torus. Unfortunately, 3 of our objects are Compton-thick to the X-ray emission (NGC 1068, Circinus, and ESO 428–G14). For these objects, we estimated the nuclear X-ray luminosity by extracting the 12 continuum emission from our spectra, which will be presented in paper II, and translating the corresponding spectral luminosity into using the most recent version of the -correlation for AGN as established from VISIR observations with similar spatial resolution (Horst et al. 2008). We adopt 50% of error on for these objects.
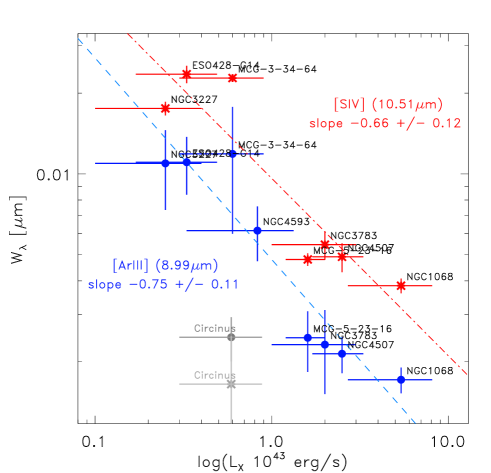
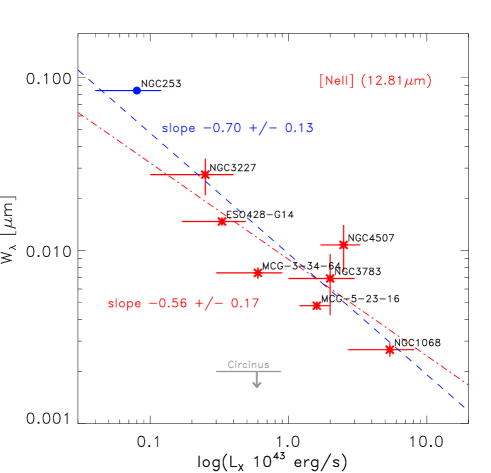
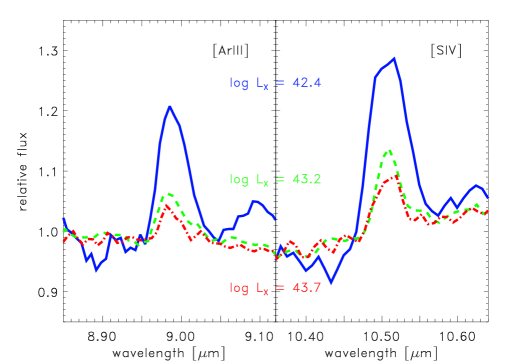
In Figs. 1 & 2, we show the measured of [Ar iii], [S iv], and [Ne ii] versus . The trend of smaller with luminosity is evident. As an illustration, the spectral regions around the [Ar iii] and [S iv] lines are presented in Fig. 3 for NGC 3227 (), MCG–5–23–16 (), and NGC 1068 (). A statistical analysis of the correlation for our sample shows Spearman ranks with significance levels in the range of . Despite the limited number of objects and luminosity coverage, correlations evolving out of the data can be confidently established. For BLBE and oNLBE studies, higher significance is achieved by averaging spectra of different objects within a narrow luminosity range. This overcomes peculiarities of individual objects (e.g. Croom et al. 2002). We aim for observations of a larger sample to make similar studies for the presented iNLBE. It is important to note that no correlation of with AGN distance, , is present in our sample (, significance for all lines).
As of yet, only one other study mentions a possible Baldwin effect in the mid-infrared. In an AAS abstract, Keremedjiev & Hao (2006) presented the detection of a Baldwin effect for the [S iv] line in AGN data obtained by the Spitzer satellite. They also note indications of a Baldwin effect for [Ne ii], admitting that their study is suffering from the low spatial resolution of the Spitzer data that they used. In the available abstract, nothing is mentioned about a slope or the scatter of the anti-correlation. Here, we demonstrate that the Baldwin effect of both the [S iv] and [Ne ii] line, and in addition the [Ar iii] line, is quite significant – and strong – when using high spatial resolution data, even with a small object sample. Thus, high spatial resolution appears to be crucial.
3.2 Relation to and
For the three type 1 AGN in our sample, black hole masses, , have been estimated based on reverberation mapping data. We adopt black hole masses for NGC 3227 () and NGC 3783 () from Onken et al. (2004), and for NGC 4593 from Denney et al. (2006). In addition, the black hole mass of the Seyfert 2 galaxy NGC 1068 could be determined by MASER cloud kinematics as (Greenhill et al. 1996). For these four AGN, we analyzed the dependence of the equivalent widths of the [Ar iii] line on . A statistical test shows no evident correlation for our limited sample of objects and the small coverage of black hole masses (, significance , for a nominal fit ([Ar iii])). Subject to the limitations, this indicates a fundamental difference of the iNLBE as compared to the BLBE for which such an anti-correlation has been found (Warner et al. 2004).
By using bolometric correction to the X-ray luminosities listed in Table 1 (Marconi et al. 2004), it is possible to estimate the Eddington ratio, , of four AGN with known . A statistical test for a correlation between [Ar iii] and reveals a Spearman rank with a significance of 0.2 for the relation ([Ar iii]). Thus, our limited sample doesn’t allow us to firmly establish a correlation, but a negative dependence of on is indicated.
3.3 The case of Circinus
We excluded Circinus from all analysis of the correlations. As can be seen in Figs. 1 & 2, the ’s of all three mid-infrared lines deviate significantly from the nominal fit to the other AGN. Although it could be a resolution effect (Circinus is the nearest AGN in the sample), NGC 1068 has about the same spatial resolution when scaled for the different luminosities (scaling ). Moreover, we did not detect extended emission in the lines down to 5% of the peak flux. This gives us some confidence to reject that a significant amount of line flux is over-resolved and lost in the noise.
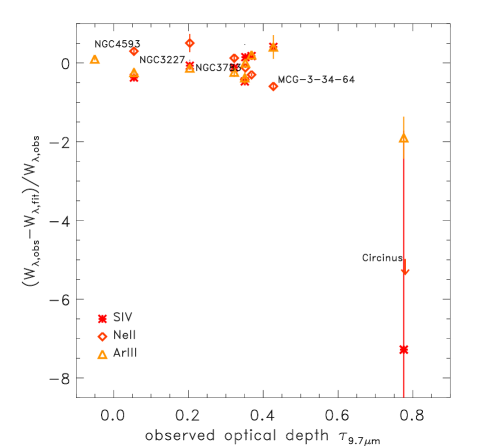
Circinus is known for strong dust extinction towards the nucleus by dust lanes in both the host and our own Galaxy. In Fig. 4, we plot the deviation from the nominal correlation with X-ray luminosity (as given in Figs. 1 & 2) of each line against the depth of the silicate feature. Circinus shows the strongest deviations from all correlations and, at the same time, has the deepest silicate feature. It is deeper than in any other type 2 AGN in our sample. In case of foreground extinction (host or our galaxy), we expect that the flux within the lines is reduced in the same way without a change in . On the other hand, if part or all of the line emission is originating from inward of the torus, the extinction in the lines could be much stronger in a more or less edge-on torus geometry. Given the fact that the bulk of line emission in all other AGN is coming from the unresolved point source, such a scale and inclination effect appears possible. Strong extinction towards the NLR based on mid-infrared spectra of Circinus was also noted by Roche et al. (2006).
4 Discussion and conclusions
4.1 A comparison to UV/optical lines
The negative correlations in the [Ar iii], [S iv], and [Ne ii] lines as observed with VLT/VISIR is much stronger than any known Baldwin effect in optical/UV broad or narrow lines. This is remarkable since the spatial resolution in the optical of the most recent studies should be similar or even better than what is achieved in the mid-infrared with the VLT. In UV/optical lines, a trend for larger correlation slopes with increasing ionization potential is observed (e.g. Dietrich et al. 2002). The potential of the presented lines is in the range of 40–47 eV and, thus, comparable to some of the optical/UV lines. From the optical/UV lines, slopes of the order of to would be expected. The measured slope of the mid-infrared lines deviates by at least 4- from that expectation (except [Ne ii] w/o NGC 253: 2-).
In Sect 3.2, we found some negative trend of ([Ar iii]) with , but possibly not with . If confirmed, this is in contrast to the observed and theoretically-expected behavior of the broad lines (e.g. Wandel 1999; Warner et al. 2004). Thus, the unsettled correlation with might imply that the iNLBE has a different physical origin than the BLBE, in particular questioning the relevance of the -dependence of the ionising continuum on the mid-infrared narrow-line emission.
4.2 Implications for the origin of the iNLBE
One suggestion for the origin of the oNLBE relates to the size scaling of the narrow-line region (NLR), for which a luminosity dependence has been found (Bennert et al. 2002). As a consequence, the NLR of luminous sources may reach galactic size scales and, thus, lose its gas. This scenario is often referred to as the “disappearing NLR” (Croom et al. 2002; Netzer et al. 2006). For the mid-infrared lines, we find that the main portion of their emission is not coming from a spatially-extended region, e.g. as for [O iii] in the optical, but from scales smaller than 100 pc. If the lack of line emission in Circinus is really an inclination-dependent obscuration effect, then the involved scales are significantly smaller. Since it is difficult to imagine how the NLR could disappear on these scales, the iNLBE probably requires a different explanation. This explanation needs to explain, in particular, (1) the steepness of the correlation of the presented lines, and (2) the fact that the mid-infrared lines do not follow the ionisation potential-dependence as observed in optical lines. Possible mechanisms might involve a luminosity-dependent increase of density in the inner NLR (thus surpressing forbidden line emission).
Acknowledgements.
We thank L. Spinoglio for helpful comments and suggestions which improved the paper. This research made use of the NASA/IPAC Extragalactic Database (NED) operated by the JPL (Caltech), under contract with NASA. PG is supported by JSPS and RIKEN Foreign postdoctoral fellowships. HH acknowledges support by DFG via SFB 439.References
- Baldwin (1977) Baldwin, J. A. 1977, ApJ, 214, 679
- Balestra et al. (2004) Balestra, I., Bianchi, S., Matt, G. 2004, A&A, 415, 437
- Bennert et al. (2002) Bennert, N., Falcke, H., Schulz, H., Wilson, A., Wills, B. J. 2002, ApJ, 574, L105
- Bianchi et al. (2007) Bianchi, S., Guainazzi, M., Matt, G., Fonseca Bonilla, N. 2007, A&A, 467, L19
- Brorsen & Green (1992) Brorsen, T. A., & Green, R. F. 1992, ApJS, 80, 109
- Cappi et al. (2006) Cappi, M., Panessa, F., Bassani, L., et al. 2006, A&A, 446, 459
- Croom et al. (2002) Croom, S. M., Rhook, K., Corbett, E. A., et al. 2002, MNRAS, 337, 275
- Denney et al. (2006) Denney, K. D., Bentz, M. C., Peterson, B. M., et al. 2006, ApJ, 653, 152
- Dietrich et al. (2002) Dietrich, M., Hamann, F., Shields, J. C., et al. 2002, ApJ, 581, 912
- Freeman et al. (1977) Freeman, K. C., Karlson, B., Lynga, J. F., et al. 1977, A&A, 55, 445
- Greenhill et al. (1996) Greenhill, L. J., Gwinn, C. R., Antonucci, R., Barvainis, R. 1996, ApJ, 472, L21
- Horst et al. (2008) Horst, H., Gandhi, P., Smette, A., Duschl, W. J. 2008, A&A, 479, 389
- Iwasawa & Taniguchi (1993) Iwasawa, K, & Taniguchi, Y. 1993, ApJ, 413, L15
- Keremedjiev & Hao (2006) Keremedjiev, M. & Hao, L. 2006, AAS, 20914912
- Marconi et al. (2004) Marconi, A., Risaliti, G., Gilli, R., et al. 2004, MNRAS, 351, 169
- McIntosh et al. (1999) McIntosh, D. H., Rieke, M. J., Rix, H.-W., Foltz, C. B., Weymann, R. J. 1999, ApJ, 514, 40
- Netzer et al. (2006) Netzer, H., Mainieri, V., Rosati, P., Trakhtenbrot, B. 2006, A&A, 453, 525
- Onken et al. (2004) Onken, C. A., Ferrarese, L., Merritt, D., et al. 2004, ApJ. 615, 645
- Rekola et al. (2005) Rekola, R., Riecher, M. G., McCall, M. L., et al. 2005, MNRAS, 361, 330
- Roche et al. (2006) Roche, P. F., Packham, C., Telesco, C. M., et al. 2006, MNRAS, 367, 1689
- Sazanov et al. (2007) Sazonov, S., Revnivtsev, M., Krivonos, R., Churazov, E., Sunyaev, R. 2007, A&A, 462, 57
- Shields (2007) Shields, J. A. 2007, ASPC, 373, 355
- Shinozaki et al. (2006) Shinozaki, K., Miyaji, T., Ishisaki, Y., Ueda, Y., Ogasaka, Y. 2006, AJ, 131, 2843
- Spergel et al. (2007) Spergel, D. N., Bean, R., Doré, O., et al. 2007, ApJS, 170, 377
- Tully (1988) Tully, R. B. 1988, Nearby Galaxies Catalogue, Cambridge Univ. Press, New York
- Veron-Cetty & Veron (2006) Veron-Cetty, M. P., Veron, P. 2006, A&A, 455, 773
- Wandel (1999) Wandel, A. 1999, ApJ, 527, 649
- Warner et al. (2004) Warner, C. Hamann, F., Dietrich, M. 2004, ApJ, 608, 136