The Effect of Composition on Nova Ignitions
Abstract
The accretion of hydrogen-rich matter onto C/O and O/Ne white dwarfs in binary systems leads to unstable thermonuclear ignition of the accreted envelope, triggering a convective thermonuclear runaway and a subsequent classical, recurrent, or symbiotic nova. Prompted by uncertainties in the composition at the base of the accreted envelope at the onset of convection, as well as the range of abundances detected in nova ejecta, we examine the effects of varying the composition of the accreted material. For high accretion rates and carbon mass fractions , we find that carbon, which is usually assumed to trigger the runaway via proton captures, is instead depleted and converted to 14N. Additionally, we quantify the importance of 3He, finding that convection is triggered by 3HeHe reactions for 3He mass fractions . These different triggering mechanisms, which occur for critical abundances relevant to many nova systems, alter the amount of mass that is accreted prior to a nova, causing the nova rate to depend on accreted composition. Upcoming deep optical surveys such as Pan-STARRS-1, Pan-STARRS-4, and the Large Synoptic Survey Telescope may allow us to detect the dependence of nova rates on accreted composition. Furthermore, the burning and depletion of 3He with a mass fraction of , which is lower than necessary for triggering convection, still has an observable effect, resulting in a pre-outburst brightening in disk quiescence to and an increase in effective temperature to K for a white dwarf accreting at .
Subject headings:
accretion, accretion disks — binaries: close — instabilities — novae, cataclysmic variables — nuclear reactions, nucleosynthesis, abundances — white dwarfs1. Introduction
White dwarfs (WDs) in cataclysmic variable (CV) and symbiotic binary systems accrete H-rich material from main sequence and red giant donors, respectively, with accretion rates of (Warner, 1995). As the accreted envelope gains mass, compression of the material at the base of the layer leads to a temperature increase, eventually triggering H-burning. Depending on , the WD mass, and the composition of the accreted material, the eventual outcome will either be steady thermally stable H-burning (Sienkiewicz, 1975, 1980; Paczynski, 1983; Fujimoto, 1982b; Shen & Bildsten, 2007; Nomoto et al., 2007), or a convective thermonuclear runaway (Starrfield et al., 1972; Fujimoto, 1982a), observable as a classical, recurrent, or symbiotic nova when the convective zone nears the WD photosphere. (Hereafter, we will refer to the onset of convection and the ignition of the nova interchangeably.)
It was first recognized from numerical simulations (e.g., Starrfield et al., 1972) that the mass fraction of CNO isotopes, , in the burning layers during a nova outburst must be times higher than the solar value in order to eject sufficient mass and produce a light-curve similar to those observed for fast novae. Abundance measurements confirm this metal enhancement in the ejecta of fast novae (for observational summaries, see Gehrz et al. 1998 and Hachisu & Kato 2006). This degree of enrichment cannot be explained by accretion from an evolved donor or nucleosynthesis during the nova outburst (e.g., Truran & Livio, 1986), thus some mechanism of core dredge-up and mixing with the envelope must be invoked.
There is on-going debate over the effectiveness of proposed mixing mechanisms, which we detail in §2. In particular, it is unclear whether convection is initiated above or below the core-envelope interface in C-poor or C-rich material. With this in mind, our work examines the effect of the accreted composition on the pre-ignition characteristics of nova systems, assuming no CNO enrichment prior to convection. We calculate ignition masses and pre-ignition luminosities for models with a large range of metallicities centered around solar (), non-zero 3He mass fractions (), high accretion rates (), and a mass range of . Note that the eventual outcome for the models with a combination of high accretion rate and low WD mass is steady and stable H-burning (Sienkiewicz, 1975, 1980; Paczynski, 1983; Fujimoto, 1982b; Shen & Bildsten, 2007; Nomoto et al., 2007), so we omit these models from our results.
In §3 and §4, we use analytic approximations to motivate the more exact numerical study described in §5. Below a critical accreted carbon mass fraction , which is coincidentally near the solar value, we find that 12C is depleted and converted to 14N prior to unstable ignition, so that convection is triggered by proton captures onto 14N. We also find that convection is triggered by 3HeHe reactions for 3He mass fractions . These different nova triggers change the pre-outburst luminosity of the nova system, which we detail in §5.5. The ignition mass is also affected by the triggering mechanism, which results in a previously unconsidered dependence of galactic nova rates on composition. This effect is especially relevant given the upcoming flood of data from optical transient surveys such as Pan-STARRS-1, Pan-STARRS-4, and the Large Synoptic Survey Telescope, which will measure nova rates in external galaxies with greater accuracy than available in current data. We speculate on the observational consequences and summarize our work in §6.
2. Motivation for our study and Justification of Assumptions
Core-envelope mixing models differ on the mechanism by which core material is brought into the accreted layer. Chemical diffusion (Prialnik & Kovetz, 1984; Kovetz & Prialnik, 1985; Prialnik & Kovetz, 1995; Yaron et al., 2005) and shear mixing caused by differential rotation of the accreted material (Kippenhahn & Thomas, 1978; Livio & Truran, 1987; Kutter & Sparks, 1989; Alexakis et al., 2004) result in pre-convective penetration of a small amount of hydrogen into the underlying material and vice versa. If the material below the layer is C-rich, C reactions trigger convection, which homogenizes the envelope and the entrained core material. These pre-convective enrichment models differ from mechanisms in which convection is triggered above the core in accreted material whose composition is determined by that of the donor star and is thus relatively C-poor. The introduction of core material into the envelope for these convective enrichment models is caused by the convective motion itself, either via convective overshoot into the core (Woosley, 1986) or shear mixing induced by the convective eddies (Glasner et al., 1997; Rosner et al., 2001).
As of yet, no mixing mechanism has definitively proven itself successful in explaining the enrichments of all novae. For example, the multi-cycle diffusion studies of Prialnik & Kovetz (1995) and Yaron et al. (2005) are initiated with matter accreted directly onto naked C/O cores, yet the accreting WD may be O/Ne in as many as 1/3 of all observed novae (Truran & Livio, 1986; Ritter et al., 1991; Livio & Truran, 1994; Gil-Pons et al., 2003). For these systems, diffusion would not lead to the initiation of convection below the accreted layer and subsequent core dredge-up because the underlying material is not C-rich. The studies of Livio & Truran (1987), Fujimoto (1988, 1993), and Piro & Bildsten (2004) rule out any significant differential rotation between the accreted layer and the core, which casts doubt on accretion-induced shear mixing mechanisms. Kercek et al. (1998, 1999) find that convective overshoot and shearing do not sufficiently enrich the envelope to produce a fast nova, although possible problems with their boundary conditions are pointed out by Glasner et al. (2005). Moreover, some recurrent nova, which are novae with recurrence times yr, do not show over-abundances of metals in their ejecta (Williams et al., 1981; Williams, 1982; Warner, 1995; Hachisu & Kato, 2001), possibly due to a large helium buffer above the core.
Thus, it is unclear how much the envelope will be enriched in metals prior to nova ignition for . Some nova studies that include the accretion phase assume that the accreting envelope is pre-enriched by the core and consists of up to 50% core material by mass (e.g., José & Hernanz, 1998; Starrfield et al., 1998). However, the uncertainties involved in the mixing mechanisms coupled with the lack of observed metal enrichment in recurrent novae lead us to examine the consequences of assuming no C-enrichment in the accreted envelope prior to the onset of convection. There are several previous studies that also follow this treatment (Starrfield et al., 1985, 1988, 2000; Truran et al., 1988; Piersanti et al., 2000; José et al., 2007), but none sufficiently samples the full parameter space in which we are interested: Starrfield et al. (1985, 1988) and Truran et al. (1988) consider accretion onto WDs; the models of Starrfield et al. (2000) have metallicity or , as motivated by novae in the Large Magellanic Cloud, with lower accretion rates than what we study; Piersanti et al. (2000) examine accretion with 3 metallicities (, , and ) onto WDs with masses , lower than our parameter range; and José et al. (2007), in their study of novae in primordial binaries, have only solar and very sub-solar metallicity models with , , or , with , which is lower than our range. Moreover, none of these studies consider the effect of 3He, which can play a dominant role in triggering the nova (Shara, 1980; Townsley & Bildsten, 2004).
In our study, we assume that the effect of chemical diffusion is negligible. This assumption, and thus our results, are invalid if the material directly below the accreted layer is C-rich. However, as we have described above, many nova systems exist in which the underlying material is C-poor and diffusion is indeed negligible. Our results only apply to these systems.
3. Carbon Depletion Prior to Unstable Ignition
If the accretion rate in a CV is lower than the minimum rate for stability, the result will be a hydrogen shell flash. In this section, we calculate the ignition conditions for these thermonuclear novae. Throughout this study, we make the assumption that the accreted layer is thin, with a pressure scale height at the envelope base, , much less than the WD core radius, . The subscript refers to the base of the accreted envelope, is the gravitational acceleration, assumed constant because , and is the WD core mass. The ratio of the scale height to the WD radius for an ideal gas equation of state is the ratio of the thermal energy to gravitational energy,
| (1) |
where is the base temperature in units of K, is the WD core mass in units of , cm, the proton mass is , and the atomic mass per particle is for solar composition. For typical ignition conditions, K, so the shell is very thin for the entire accretion phase. The base pressure is independent of the temperature in the thin-shell limit and is
| (2) |
where is the envelope mass. This assumption will not be valid once the temperature rises during the thermonuclear runaway. For a WD, when .
We first estimate the luminosity in the accreting layer following Nomoto (1982) and Townsley & Bildsten (2004). When material accretes onto the WD surface, the gravitational energy, , is released and radiated by the spreading boundary layer (Piro & Bildsten, 2004) and is not carried into the star, because the thermal timescale at the photosphere for luminosities of order the accretion luminosity is far shorter than the accretion timescale. Instead, prior to the onset of nuclear burning, the pre-ignition luminosity exiting the deep accreting layer is produced by entropy released as the material accumulates. The entropy equation yields the compressional luminosity at the surface,
| (3) |
where is the specific entropy, and we have neglected the term . The lower bound, , is the depth at which the thermal time is equal to the time for which accretion has been on-going, so that the luminosity produced there has had time to make its way through the envelope. For illustration, we assume Kramers’ opacity (), ideal gas (), and a constant luminosity above , so that . An ideal gas has , which yields . This gives
| (4) |
where is the temperature at , is the mass accretion rate in units of , and we have set . If the opacity is due to electron scattering, the pre-factor becomes instead of , so the exact relation is only weakly dependent on the form of radiative opacity.
The thermal time at is , where is the specific heat at constant pressure for an ideal gas, is the mass in the layer above , and we use a one-zone approximation, (e.g., Paczynski, 1983). The time to accrete an envelope mass is . To find the depth from which luminosity is able to escape during accretion, we set the two timescales equal and use equation (2), yielding ; i.e., most of the luminosity in the envelope comes from only the envelope itself, and so we neglect the compressional luminosity from the core (see the appendix of Townsley & Bildsten 2004 for further discussion of the core’s role). Thus, the compressional luminosity is given by equation (4), with .
Using the radiative diffusion equation with Kramers’ opacity,
| (5) |
where cm2 g-1 from fitting to OPAL opacities (Iglesias & Rogers, 1993, 1996) for solar composition around K and g cm-3, we derive the temperature at the base of the accreting layer as a function of ,
| (6) |
where g cm-3. We have assumed solar metallicity, but this result is nearly independent of composition. The bottom of the layer follows the trajectory given by equation (6) until nuclear burning becomes comparable to compressional heating, i.e., when , where is the luminosity produced by nuclear burning. For high accretion rates , H-burning occurs via CNO reactions when base conditions reach K and g cm-3 (ignoring 3He-burning). If the accreting material has near-solar isotopic ratios, the most relevant isotope is 12C, since proton captures onto 14N are slower than onto 12C, and 16O does not participate in the CNO cycle at these temperatures. Moreover, reactions are unimportant at K because the lifetime of a proton with respect to self-burning is times longer than with respect to consumption by 12C nuclei. Thus, proton captures onto 12C will be the first non-negligible reaction. These are quickly followed by the -decay of 13N (with a half-life of s) and proton captures onto 13C ( times more rapid than onto 12C), so that we approximate the first nuclear reactions of interest as the conversion of 12C to 14N at the 12C proton capture rate. This reaction chain releases a specific energy erg g-1.
Linear stability analysis (Fujimoto et al., 1981) shows that nuclear burning is unstable in a constant-pressure thin shell if
| (7) |
or , where is the nuclear energy generation rate, the one-zone approximation to the cooling rate is , and . For Kramers’ opacity and ideal gas, . The cooling rate is rewritten as
| (8) |
after substituting the expression for compressional luminosity (eq. [4]).
It is often stated that the energy released by the conversion of 12C to 14N triggers the thermonuclear runaway for high novae (e.g., Fujimoto 1982b; Townsley & Bildsten 2004; José 2005; José & Hernanz 2007). However, we show here that under some conditions this reaction will not release enough heat to trigger unstable ignition conditions before the 12C is depleted. In this case, all available 12C converts to 14N, which will ignite later at a larger pressure and temperature. Carbon depletion occurs when the accretion and burning timescales are comparable, with the C-burning timescale given by , where is the rate of energy generation from conversion of 12C to 14N. The condition for stable 12C depletion is then
| (9) |
Thus, for mass fractions below a critical value, coincidentally near the solar mass fraction of , carbon will deplete before triggering a nova. This value is certainly relevant for novae in systems with low-metallicity donors. Furthermore, low 12C/14N ratios can occur when mass transfer has revealed a CNO-processed core (Schenker et al., 2002, and references therein). In these cases, the carbon mass fraction of the accreted material will be well below the solar value because proton captures onto 14N are the slow step of the CNO cycle, and thus the donor’s CNO nuclei are mostly in the form of 14N, resulting in accreted carbon mass fractions or lower (Schenker et al., 2002). For high CV systems, evolved donors such as these are likely common. A population synthesis calculation by Podsiadlowski et al. (2003) finds that the majority of CVs with orbital periods h have an evolved secondary. Observationally, a study of UV line flux ratios of CVs both above and below the period gap (Gänsicke et al., 2003) concludes that as much as of their sample might have evolved donors with anomalously low 12C/14N abundance ratios due to CNO processing.

Figure 1 shows conditions for carbon depletion (short-dashed line) and stable vs. unstable C-burning with varying accreted metallicities (dotted lines) for a WD. The region to the left of the dashed-dotted line has Fermi energy , so that it is mildly degenerate or non-degenerate. Free-free opacity dominates in the region of interest. Also shown are the rising temperature and density at the base of accreting layers with and (solid lines). For mass fractions lower than near-solar, carbon depletes before it ignites unstably and is instead converted to 14N. In these cases, the base of the layer continues to become hotter and denser until it reaches burning conditions for proton captures onto 14N (long-dashed line). At the temperatures and densities corresponding to these ’s, the CNO cycle as a whole is thermally unstable, and ignition is inevitable. However, because the layer must be hotter and denser to burn the 14N, more material must be accreted before ignition than in the case of carbon ignition.
4. The Significance of 3He
The possible importance of 3He for novae was first studied by Schatzmann (1951) in the context of a theory of novae powered by thermonuclear detonations. MacDonald (1983) and Iben & Tutukov (1984) noted that the presence of 3He can decrease the envelope mass needed for nova ignition, and Shara (1980) and Townsley & Bildsten (2004) looked more closely at its role in triggering the convective shell burning phase of a nova. Although these studies found that 3He can play a large role in the onset of a nova, its effects have not been quantified in detail.
For typical nova conditions, 3He-burning takes place via 3He(3He, 2)4He. The next-fastest reaction that consumes 3He is 3HeHe, which has an unscreened reaction rate that is a factor of slower for , and thus 3HeHe is the only reaction to consider. To gauge the importance of 3He-burning for nova ignitions, we compare its relevant characteristics to proton captures onto 12C, the assumed trigger for nova systems with . The energy per 3He self-reaction is MeV, slightly larger than the MeV released by the reaction chain that converts 12C to 14N. Moreover, the 3He unscreened reaction timescale, i.e., the e-folding lifetime for 3He nuclei, defined for a generic nucleus as , is much shorter than that of 12C. The ratio of timescales is
| (10) |
which is roughly a factor of 200 for K, , and hydrogen mass fraction . Thus, for , 3He nuclei will begin burning via self-reactions before 12C nuclei have a chance to capture protons.
Since the 3He reaction releases a similar amount of energy and has a similar temperature dependence to that of the 12C proton capture, we must also consider the possibility of 3He depletion prior to nova ignition. An analysis like that of the previous section yields the same critical mass fraction as in equation (9). Again coincidentally, this critical mass fraction for 3He depletion is in the neighborhood of the expected value for mass-transferring binary systems. As mass loss uncovers deeper parts of the donor star, material that has been processed by H-burning can make its way to the surface. D’Antona & Mazzitelli (1982) and Iben & Tutukov (1984) find that the mass fraction of accreted 3He can reach values as high as during the evolution of systems with low-mass donors, and thus the possibility exists for 3He to trigger a nova prior to depleting. For this reason, Townsley & Bildsten (2004) included calculations with and 0.005. For , they found that ignitions were triggered by 3He, with the ignition mass roughly decreasing by a factor of 2 when increasing from to .
5. Numerical Simulation
The approximations that we have made in the analytic work of §3 and §4 and the proximity of the critical 12C and 3He abundances to relevant solar and CV abundances motivate a more exact analysis. In particular, electron degeneracy pressure, other opacities, the exchange of heat between the envelope and core, and the term that is neglected in equation (3) must be included. Moreover, the one-zone approximation of setting is problematic, because burning occurs in a narrow layer and is certainly not a linear function of the whole atmosphere.
5.1. Model
We developed a time-dependent explicit Runge-Kutta code for a one-dimensional grid of 100 zones covering a pressure range of dyne cm-2. Since the base of the envelope at ignition is typically between and dyne cm-2, this choice of zoning gives greater than a factor of 10 range in pressure above and below the region of interest. For the model with , the pressure boundaries were changed to dyne cm-2 because the accreted layer reached a depth that was too close to dyne cm-2. The zones are spaced logarithmically in pressure (thus there are roughly 33 zones per decade of pressure) to better resolve the accreted layer and to avoid over-resolution of the bottom zones. The layer is spherically symmetric, appropriate for the depths of interest if there is negligible differential rotation (Fujimoto, 1988, 1993; Piro & Bildsten, 2004), and plane-parallel, a good approximation as discussed in §3.
| Mass [] | [] | [K] |
|---|---|---|
| 0.6 | ||
| 0.6 | ||
| 0.6 | ||
| 0.6 | ||
| 1.0 | ||
| 1.0 | ||
| 1.0 | ||
| 1.0 | ||
| 1.2 | ||
| 1.2 | ||
| 1.2 | ||
| 1.2 | ||
| 1.35 | ||
| 1.35 | ||
| 1.35 | ||
| 1.35 |
The thermal evolution of the core during CN cycles was considered in detail by Townsley & Bildsten (2004), who found that heating and cooling during the nova cycle results in an equilibrium core temperature, .111CVs spend only a short amount of time at (Howell et al., 2001), and so it is unclear if the core temperature will have time to reach equilibrium before the system has evolved appreciably (Epelstain et al., 2007). However, as mentioned later, the results of our study are largely unaffected by the core temperature. Thus, for our models, the initial thermal profile prior to accretion is assumed to be a radiative-zero solution that gives a core temperature . The equilibrium depends on the accreted composition, but, in order to limit the parameters of this study, a single representative is used for each and model; these are extrapolated from Townsley & Bildsten (2004) and Townsley (2007, priv. comm.) and are shown in Table 1. Fortunately, the properties of the accreting layer are relatively insensitive to for these high ’s. For example, increasing by a factor of 2 decreases by only .
At each time-step, the temperature for the top-most zone is set with respect to that of the zone directly below it according to a power-law solution obtained by assuming a radiative-zero atmosphere above our grid.222Changing the upper boundary condition to a constant temperature has a negligible effect on the long-term evolution of the layer. This is unsurprising because, for the pressure at the top of the grid, , the ratio of the thermal time to the accretion time at the base is . For the grid we use and typical ignition pressures, this ratio is , and so any differences in thermal conditions at the top of the grid are radiated away and not carried deeper into the star. The thermal boundary condition for the bottom-most zone is such that the flux there is equal to that of the zone directly above it. While locally incorrect, this bottom boundary condition has no effect on the thermal properties of the accreted envelope as the thermal time at the bottom of our grid is much longer than the accretion time prior to ignition. Thus, any inaccuracies in the bottom-most zones will have no effect on the region of interest.
The WD core structure is assumed to be constant during the nova cycle. This is an excellent approximation, as the WD’s central pressure, dyne cm-2 for , is much larger than that of the accreted layer. The WD core radius is calculated for an isothermal core that is half 12C and half 16O by mass with outer boundary condition dyne cm-2. The radius is relatively insensitive to for , so all radii are calculated with K. The resulting radii and gravitational accelerations for our 4 models are shown in Table 2. Calculations for O/Ne WDs give the same radii to within , because 12C, 16O, and 20Ne have the same charge-to-mass ratio.
| Mass | Radius | |
|---|---|---|
| 0.6 | ||
| 1.0 | ||
| 1.2 | ||
| 1.35 |
The equation of state (Saumon et al., 1995; Timmes & Swesty, 2000; Rogers & Nayfonov, 2002), opacity (Iglesias & Rogers, 1993, 1996), nuclear burning network (Timmes, 1999), neutrino cooling (Itoh et al., 1996), and electron screening (Graboske et al., 1973; Alastuey & Jancovici, 1978; Itoh et al., 1979) are calculated using the MESA code package.333http://mesa.sourceforge.net/ The MESA basic nuclear network, which tracks the abundances of 1H, 4He, 12C, 14N, 16O, 20Ne, and 24Mg, has been modified to explicitly follow the 3He reactions 3HeHe and 3HeHe. The nuclear reactions consist of the - chains (including the reaction, although for our high ’s , it typically has a negligible contribution; Starrfield et al. 2007), the CNO cycles, -burning up to 24Mg, and C/O burning. Isotopes that are not explicitly tracked are assumed to have equilibrium abundances.
| Element | Mass fraction |
|---|---|
| 1H | 0.749 |
| 4He | 0.237 |
| 12C | |
| 14N | |
| 16O | |
| 20Ne | |
| 24Mg |
Solar composition of the accreted material is defined by the recommended solar photosphere abundances in Lodders (2003). The relevant elemental abundances by mass fraction are shown in Table 3; note the reduction in solar metallicity as compared to previous studies, such as Grevesse & Sauval (1998). For models with non-solar metallicities, the mass fractions of 12C, 14N, 16O, 20Ne, and 24Mg are adjusted by the same multiplicative factor444As noted in §3, systems do exist where the mass fractions of accreted 12C and 14N are non-solar while the other metals still have their solar values. However, for the sake of consistency and convenience, we scale all the metals by the same value in each model. and the difference made up in . Likewise, any non-zero 3He mass fraction is subtracted from .
A monotonic transport first-order advection scheme (van Leer, 1974; Hawley et al., 1984), modified for logarithmic coordinates, is utilized to simulate accretion. While certainly more accurate than zeroth-order donor cell advection, it is still subject to numerical advection that smoothes out what should be a step-function accretion front in the absence of diffusion, which we have neglected for the reasons given in §2. If unaccounted for, this non-physical excess advection into C-rich material leads to premature burning of the small amount of hydrogen that precedes the accretion front. Thus, when calculating the burning rate and compositional changes, the core C/O is treated as 24Mg, which is essentially inert in the nuclear reaction network at these temperatures. For all other calculations, the core remains half 12C and half 16O by mass.
The code is evolved until any local thermal gradient is steeper than the local adiabatic gradient and convection sets in, at which point we consider ignition to have occurred. We define the ignition mass to be the total accreted mass at the onset of convection, , taking into account the time required for the accretion front to reach the top of our grid prior to the beginning of the code run.
5.2. Representative results


Figures 2 and 3 show envelope profiles for a WD accreting at with . Figure 2 has , and Figure 3 has . Each panel shows profiles at 4 different times, each separated by 317 yr in Figure 2 and by 634 yr in Figure 3. The thick solid lines in both figures show the envelope profile just prior to convection.
Figure 2 shows a typical C ignition. The cause of the ignition is the onset of C burning, which releases more heat than can be radiatively transported away. At ignition, the accreted carbon mass fraction (solid line in the third panel) at the envelope base (vertical dotted line) is essentially the same as in the rest of the accreted layer because it has not had a chance to deplete before ignition conditions are met. Thus, the 14N mass fraction (dashed line in the third panel) in the layer is also unchanged, except near the base, where the small amount of C-burning has slightly raised the 14N mass fraction.
Contrast this sequence of events with the case shown in Figure 3. Here, carbon has already been depleted prior to ignition. At the time of ignition, the carbon mass fraction at the base is several orders of magnitude lower than in the rest of the layer (solid line in the third panel), and the difference has been added to the 14N mass fraction (dashed line in the third panel). The energy generation profile (second panel) clearly shows two peaks in the envelope: the shallower occurs where 12C is burned and depleted, and the deeper peak is due to full CNO cycle burning. It is at the deeper location that begins to spike and convection occurs. Since the layer must become hotter and denser to burn 14N, more mass accumulates prior to ignition. The ignition mass in this case is , 3 times higher than the C-triggered case, which has .

5.3. Ignition masses


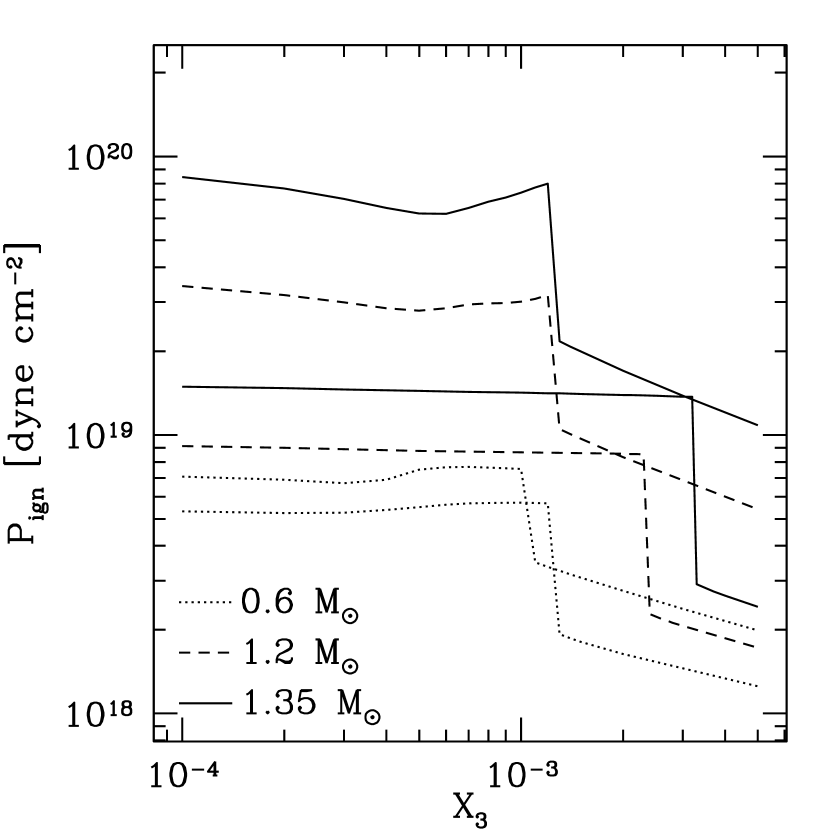
In this section, we show the resulting for a range of , , and composition. Figure 5 shows vs. accreted metallicity with , and Figure 6 shows vs. 3He mass fraction with solar metallicity. The dotted, dashed, and solid lines represent WDs, respectively. The top (higher ) curve for each WD mass has . The bottom (lower ) curve has for and for and . The highest shown for differs from that of the other masses because a WD accreting at burns hydrogen stably without any novae (Sienkiewicz, 1975, 1980; Paczynski, 1983; Fujimoto, 1982b; Shen & Bildsten, 2007; Nomoto et al., 2007).
Some general trends are clear. Increasing the WD mass and accretion rate lower the ignition mass. A larger mass is equivalent to a smaller radius, both of which contribute to a higher value of , resulting in a higher temperature and density for a given envelope mass, and thus ignition conditions are reached at lower envelope masses. Higher accretion rates translate into higher compressional luminosities and higher temperatures, also resulting in ignition for smaller envelope masses. The basic trend of lower ignition mass with higher values of 12C and 3He is also sensible: more fuel means more burning and quicker buildup to ignition.
However, as we have discussed previously, changing the composition does not just lead to a change in the energy generation rate. If the 3He or 12C is depleted, conditions for burning the next fuel will have to be reached for ignition. This is the cause of the inflections that are present in most of the -curves in Figure 5, and for the abrupt changes in that are seen in Figure 6. Once a critical 12C- or 3He-mass fraction is reached, the ignition becomes qualitatively different. Note that carbon depletion does not have as drastic an effect as 3He depletion because depleted carbon is converted to another burning catalyst, 14N, whereas 3He is depleted to hydrogen and 4He, negligibly increasing the amount of hydrogen fuel.
The long-dashed lines in Figures 5 and 6 show the analytic power-law scaling of with and as derived from equation (7). Assuming that the constant pressure logarithmic temperature dependences of the 12C- and 3He-burning rates are yields for 12C-triggered novae and for 3He-triggered novae. The difference in the exponent is due to 3He burning via self-reactions, as opposed to 12C burning via proton captures. The numerical results of Figure 5 match the analytic scaling fairly well. The high models of Figure 6 also match the analytic expectation well. However, for lower values of , 3He is depleted and does not release enough heat to trigger the nova. These novae are instead triggered by 12C or 14N, and since the metallicity is constant along each curve, is also roughly constant below a critical value of .

Figure 7 shows lines of constant as a function of and (solid lines) for and , obtained by quadratically fitting the numerical results detailed above. The contours are evenly spaced with 0.2 dex of between each line. The thick solid lines have and as labeled. Also shown are contours of constant recurrence time (dotted lines), labeled in years. The hatched region where hydrogen burns stably in a steady state is taken from Nomoto et al. (2007). It is clear that a recurrent nova system accreting solar metallicity material with low 3He mass fraction must have a WD to achieve a recurrence time yr.
Our ignition masses are a factor of times higher than the analytic estimates of Fujimoto (1982b) and times lower than the work of MacDonald (1983). Given the differences in method and updates in equations of state and opacity, these discrepancies are not significant. The work of Yaron et al. (2005) assumes diffusive accretion onto initially bare C/O cores, which invalidates our assumption of accretion onto C-poor material, so the fact that their ’s are times lower than ours is not surprising. A comparison of our results with those of Townsley & Bildsten (2004) (and Fig. 1 of Townsley & Bildsten 2005) reveals a large discrepancy, with our ’s higher by a factor of . The difference is predominantly due to their lack of abundance evolution, which eliminates the possibility of 3He depletion. Theirs is a valid assumption for higher mass fractions , but is not correct for , and leads to premature nova ignitions.
Throughout this study, we have assumed that and are the accreted mass and accretion time prior to the onset of convection. However, the convective zone takes some time to grow and reach the surface, at which point the nova outburst becomes observable. It is conceivable that a significant amount of mass is accreted during the convective phase, which would cause the we have calculated to be lower than the actual time between novae. To quantify this error, we consider the growth time of the convective zone, which is , where the temperature and burning rate are evaluated at the onset of convection. For each model, we find that is always times shorter than the time to the onset of convection, so that the ignition times and masses we have calculated are only smaller than the actual values by a few percent, and our assumption is justified.
5.4. Ignition pressures and the misuse of “”

Fujimoto (1982a) is often cited to support the claim of a critical ignition pressure for nova ignition, , which, depending on the study making the claim, has a value between dyne cm-2. However, the ignition pressure is clearly not constant, as we show in Figures 8 and 9. These figures are identical to Figures 5 and 6 but with along the ordinate axis instead of ; the ignition pressure is related to through equation (2). The ignition pressure varies by a factor of 100 from one extreme of high accretion rate, mass, and to the other extreme and is not constant. Moreover, the original paper actually makes no such assertion. Instead, Fujimoto (1982a) states that there is a minimum ignition pressure necessary to produce a strong nova-like outburst powered by hydrostatic shell expansion. The ignition pressure is left as a free parameter and is calculated in Fujimoto (1982b) as a function of WD masses and accretion rates.
5.5. Pre-ignition luminosities
The depletion of fuel will increase the WD surface luminosity above the compressional luminosity. Such an increase in the pre-nova light curve would be a sign that the carbon abundance is not enhanced, or that the 3He abundance is non-negligible. There are several energy scales to keep in mind: the accretion, thermal, 12C-burning, and 3He-burning energies per mass are given, respectively, as
| (11) |
The luminosities associated with these energies can be obtained by multiplying them by the accretion rate, with an additional factor for the thermal/compressional luminosity. The radius is typically a few cm, so the accretion energy is roughly two orders of magnitude larger than the thermal or nuclear energy available during the accretion phase. However, the accretion luminosity from a disk is variable and greatly reduced in disk quiescence. Thus, it is still possible to observe the luminosity produced from the interior of the accreted envelope, as demonstrated by Townsley & Bildsten (2003) in their work on relating effective temperature, , to .

Figure 10 shows the surface luminosity, ignoring the accretion luminosity, and effective temperature as a function of time for a WD with , , and metallicities of 0.1, 0.2, 0.5, 1.0, 2.0, & 5.0 , increasing from right to left. The 0.5 model is interesting in that there is enough carbon to power significant nuclear luminosity, but not enough to trigger a nova. For this case, the compressional luminosity is and K for of the nova cycle. Four thousand years after the onset of accretion, carbon is burned and depleted, causing the luminosity from inside the envelope to double within a span of only 1000 yr. The burning of 14N begins yr after C-depletion, and the luminosity and effective temperature rise to and K just prior to the CNO cycle-triggered ignition.

Changing also has an effect on the surface luminosity and . Figure 11 shows the surface luminosity and effective temperature as in Figure 10, but with fixed metallicity and varying 3He mass fractions of 0.1, 0.2, 0.5, 1.0, 2.0, & , increasing from right to left. Here, the interesting case is , which has enough 3He to produce significant energy, but not enough to trigger the nova. The surface luminosity reaches and rises to K after only 1500 yr of accretion, but the surface then cools as the envelope succeeds in depleting the accumulated 3He. The surface brightens when C-burning commences, and again dims when carbon is depleted, finally rising to and K when 14N begins burning.
6. Conclusions
Motivated by uncertainties in classical nova core-mixing mechanisms and the lack of metal enhancements in some nova ejecta, we have quantified the effects of composition on nova ignitions (see Fig. 5) under the assumption that the underlying material is C-poor and diffusion thus unimportant, as appropriate for accretors with large helium buffers or O/Ne cores. We have found that for carbon mass fractions , 12C is depleted and converted to 14N without releasing enough heat to trigger a nuclear instability. The layer continues to accrete until 14N can capture protons, leading to a nova triggered by the full CNO cycle and an ignition mass larger than the carbon-ignited case. Thus, the ignition mass increases by a factor of as the metallicity is decreased from to . The critical carbon mass fraction is near-solar and is thus relevant to sub-solar metallicity systems as well as systems with evolved secondaries that have undergone CNO processing of 12C to 14N. We have also examined the effect of accreted 3He (see Fig. 6), which can reach mass fractions of as an evolved donor’s interior is uncovered by mass transfer. For , 3He+3He reactions trigger novae with a factor of times smaller than the C-triggered case.
The dependence of on accreted composition will affect population-averaged nova rates: naively, high-metallicity environments would have nova rates higher by a factor of than systems with sub-solar metallicities (such as novae in globular clusters; Shafter & Quimby 2007) or evolved donors that have undergone CNO processing. However, the existence of 3He would have to be taken into account, because old systems with donors that have undergone significant mass loss could have and would thus have high nova rates, regardless of the accreted metallicity. A proper prediction of the effect of donor composition requires a population-synthesis calculation that includes further complications such as binary and donor evolution. We leave this exercise for future work.
To date, most observations only report galactically-averaged nova rates, although some M31 studies (Ciardullo et al., 1987; Capaccioli et al., 1989; Darnley et al., 2006) have found that M31’s bulge produces more novae per stellar luminosity than its disk by a factor of . On the other hand, galactically-averaged nova rates do not see any morphology dependence, finding instead that the luminosity-specific nova rate (LSNR) is roughly constant across all galaxy types at a value of yr-1 (Williams & Shafter, 2004), where is the K-band solar luminosity. The LMC and SMC (and possibly Virgo dwarf elliptical galaxies; Neill & Shara 2005), which have LSNRs higher by a factor of 3, are exceptions. These measurements have large error bars due to small number statistics and issues of completion caused by both extinction and infrequent observations. A better measurement of nova rates will come with new deep optical surveys with high cadences such as Pan-STARRS-1, Pan-STARRS-4, and the Large Synoptic Survey Telescope, which will see thousands of novae every year. These will reduce the nova rate error bars and also possibly allow us to measure rates in different populations within other galaxies besides M31.
In addition to this population-averaged observable, the composition could also have a detectable effect on individual systems. In particular, the depletion of fuel can significantly increase the surface luminosity above the baseline set by the entropy released during compression of the accreted layer (see Figs. 10 and 11). While this increase is still well below the accretion luminosity associated with gravitational energy release, it would be visible while the system was in disk quiescence. Recurrent novae, in particular, would be ideal systems in which to observe this brightening in quiescent luminosity due to their short recurrence times of yr.
These observables are dependent on the assumption that convection is not initiated in C-enhanced material. If instead H-rich envelope material penetrates into C-rich material and triggers convection there, the accreted composition will have little effect. Thus, if these composition-dependent effects are observed, they will provide evidence that convection for many novae is initiated in C-poor material, and that CNO enrichment for these novae is due to convective shear mixing or overshoot.
References
- Alastuey & Jancovici (1978) Alastuey, A., & Jancovici, B. 1978, ApJ, 226, 1034
- Alexakis et al. (2004) Alexakis, A., et al. 2004, ApJ, 602, 931
- Arras et al. (2006) Arras, P., Townsley, D. M., & Bildsten, L. 2006, ApJ, L119
- Capaccioli et al. (1989) Capaccioli, M., Della Valle, M., D’Onofrio, M., & Rosino, L. 1989, AJ, 97, 6
- Cassisi et al. (1998) Cassisi, S., Iben, I., Jr., & Tornambè, A. 1998, ApJ, 496, 376
- Ciardullo et al. (1987) Ciardullo, R., Ford, H. C., Neill, J. D., Jacoby, G. H., & Shafter, A. W. 1987, ApJ, 318, 520
- D’Antona & Mazzitelli (1982) D’Antona, F., & Mazzitelli, I. 1982, ApJ, 260, 722
- Darnley et al. (2006) Darnley, M. J., et al. 2006, MNRAS, 369, 257
- Epelstain et al. (2007) Epelstain, N., Yaron, O., Kovetz, A., & Prialnik, D. 2007, MNRAS, 374, 1449
- Fujimoto (1982a) Fujimoto, M. Y. 1982a, ApJ, 257, 752
- Fujimoto (1982b) Fujimoto, M. Y. 1982b, ApJ, 257, 767
- Fujimoto (1988) Fujimoto, M. Y. 1988, A&A, 198, 163
- Fujimoto (1993) Fujimoto, M. Y. 1993, ApJ, 419, 768
- Fujimoto et al. (1981) Fujimoto, M. Y., Hanawa, T., & Miyaji, S. 1981, ApJ, 247, 267
- Gänsicke et al. (2003) Gänsicke, B. T., et al. 2003, ApJ, 594, 443
- Gehrz et al. (1998) Gehrz, R. D., Truran, J. W., Williams, R. E., & Starrfield, S. 1998, PASP, 110, 3
- Gil-Pons et al. (2003) Gil-Pons, P., García-Berro, E., José, J., Hernanz, M., & Truran, J. W. 2003, A&A, 407, 1021
- Glasner et al. (1997) Glasner, S. A., Livne, E., & Truran, J. W. 1997, ApJ, 475, 754
- Glasner et al. (2005) Glasner, S. A., Livne, E., & Truran, J. W. 2005, ApJ, 625, 347
- Graboske et al. (1973) Graboske, H. C., Dewitt, H. E., Grossman, A. S., & Cooper, M. S. 1973, ApJ, 181, 457
- Grevesse & Sauval (1998) Grevesse, N., & Sauval, A. J. 1998, Space Sci. Rev., 85, 161
- Hachisu & Kato (2001) Hachisu, I., & Kato, M. 2001 ApJ, 558, 323
- Hachisu & Kato (2006) Hachisu, I., & Kato, M. 2006, ApJS, 167, 59
- Hawley et al. (1984) Hawley, J. F., Smarr, L. L., & Wilson, J. R. 1984, ApJS, 55, 211
- Howell et al. (2001) Howell, S. B., Nelson, L. A., & Rappaport, S. 2001, ApJ, 550, 897
- Iben et al. (1992) Iben, I., Jr., Fujimoto, M. Y., & MacDonald, J. 1992, ApJ, 388, 521
- Iben & Tutukov (1984) Iben, I., Jr., & Tutukov, A. V. 1984, ApJ, 284, 719
- Iben & Tutukov (1985) Iben, I., Jr., & Tutukov, A. V. 1985, ApJS, 58, 661
- Iglesias & Rogers (1993) Iglesias, C. A., & Rogers, F. J. 1993, ApJ, 412, 752
- Iglesias & Rogers (1996) Iglesias, C. A., & Rogers, F. J. 1996, ApJ, 464, 943
- Itoh et al. (1996) Itoh, N., Hayashi, H., Nishikawa, A., & Kohyama, Y. 1996, ApJS, 102, 411
- Itoh et al. (1979) Itoh, N., Totsuji, H., Ichimaru, S., & Dewitt, H. E. 1979, ApJ, 234, 1079
- José (2005) José, J. 2007, Nuc. Phys. A, 758, 713
- José et al. (2007) José, J., García-Berro, E., Hernanz, M., & Gil-Pons, P. 2007, ApJ, 662, L103
- José & Hernanz (1998) José, J., & Hernanz, M. 1998, ApJ, 494, 680
- José & Hernanz (2007) José, J., & Hernanz, M. 2007, J. Phys. G: Nucl. Part. Phys., 34, R431
- José et al. (1993) José, J., Hernanz, M., & Isern, J. 1993, A&A, 269, 291
- Kercek et al. (1998) Kercek, A., Hillebrandt, W., & Truran, J. W. 1998, A&A, 337, 379
- Kercek et al. (1999) Kercek, A., Hillebrandt, W., & Truran, J. W. 1999, A&A, 345, 831
- Kippenhahn & Thomas (1978) Kippenhahn, R., & Thomas, H.-C. 1978, A&A, 63, 265
- Kovetz & Prialnik (1985) Kovetz, A., & Prialnik, D. 1985, ApJ, 291, 812
- Kutter & Sparks (1989) Kutter, G. S., & Sparks, W. M. 1989, ApJ, 340, 985
- Livio & Truran (1987) Livio, M., & Truran, J. W. 1987, ApJ, 318, 316
- Livio & Truran (1992) Livio, M., & Truran, J. W. 1992, ApJ, 389, 695
- Livio & Truran (1994) Livio, M., & Truran, J. W. 1994, ApJ, 425, 797
- Lodders (2003) Lodders, K. 2003, ApJ, 591, 1220
- MacDonald (1983) MacDonald, J. 1983, ApJ, 267, 732
- MacDonald (1984) MacDonald, J. 1984, ApJ, 283, 241
- Neill & Shara (2005) Neill, J. D., & Shara, M. M. 2005, ApJ, 129, 1873
- Nomoto (1982) Nomoto, K. 1982, ApJ, 253, 798
- Nomoto et al. (2007) Nomoto, K., Saio, H., Kato, M., & Hachisu, I. 2007, ApJ, 663, 1269
- Paczynski (1983) Paczynski, B. 1983, ApJ, 264, 282
- Piersanti et al. (2000) Piersanti, L., Cassisi, S., Iben, I., Jr., & Tornambé, A. 2000, ApJ, 535, 932
- Piro & Bildsten (2004) Piro, A. L, & Bildsten, L. 2004, ApJ, 610, 977
- Podsiadlowski et al. (2003) Podsiadlowski, P., Han, Z., & Rappaport, S. 2003, MNRAS, 340, 1214
- Prialnik & Kovetz (1984) Prialnik, D., & Kovetz, A. 1984, ApJ, 281, 367
- Prialnik & Kovetz (1995) Prialnik, D., & Kovetz, A. 1995, ApJ, 445, 789
- Prialnik & Livio (1995) Prialnik, D., & Livio, M. 1995, PASP, 107, 1201
- Prialnik & Shara (1986) Prialnik, D., & Shara, M. M. 1984, ApJ, 311, 172
- Ritter et al. (1991) Ritter, H., Politano, M. J., Livio, M., & Webbink, R. F. 1991, ApJ, 376, 177
- Rogers & Nayfonov (2002) Rogers, F. J., & Nayfonov, A. 2002, ApJ, 576, 1064
- Rosner et al. (2001) Rosner, R., Alexakis, A., Young, Y.-N., Truran, J. W., & Hillebrandt, W. ApJ, 562, L177
- Saumon et al. (1995) Saumon, D., Chabrier, G., & van Horn, H. M. 1995, ApJS, 99, 713
- Schatzmann (1951) Schatzmann, E. 1951, Ann. Ap., 14, 294
- Schenker et al. (2002) Schenker, K., King, A. R., Kolb, U., Wynn, G. A., & Zhang, Z. 2002, MNRAS, 337, 1105
- Shafter & Quimby (2007) Shafter, A. W., & Quimby, R. M. 2007, ApJ, in press (astro-ph/0711.0378)
- Shara (1980) Shara, M. M. 1980, ApJ, 239, 581
- Shen & Bildsten (2007) Shen, K. J., & Bildsten, L. 2007, ApJ, 660, 1444
- Sienkiewicz (1975) Sienkiewicz, R. 1975, A&A, 45, 411
- Sienkiewicz (1980) Sienkiewicz, R. 1980, A&A, 85, 295
- Starrfield et al. (2007) Starrfield, S., Iliadis, C., Hix, W. R., Timmes, F. X., & Sparks, W. M. 2007, in AIP Conf. Proc. 891, Tours Symposium on Nuclear Physics VI, ed. M. Arnould et al. (Melville: AIP), 364
- Starrfield et al. (2000) Starrfield, S., Schwarz, G., Truran, J. W., & Sparks, W. M. 2000, in AIP Conf. Proc. 522, Cosmic Explosions, ed. S. S. Holt & W. W. Zhang (Melville: AIP), 379
- Starrfield et al. (1988) Starrfield, S., Sparks, W. M., & Shaviv, G. 1988, ApJ, 325, L35
- Starrfield et al. (1985) Starrfield, S., Sparks, W. M., & Truran, J. W. 1985, ApJ, 291, 136
- Starrfield et al. (1972) Starrfield, S., Truran, J. W., Sparks, W. M., & Kutter, G. S. 1972, ApJ, 176, 169
- Starrfield et al. (1998) Starrfield, S., Truran, J. W., Wiescher, M. C., & Sparks, W. M. 1998, MNRAS, 296, 502
- Timmes (1999) Timmes, F. X. 1999, ApJS, 124, 241
- Timmes & Swesty (2000) Timmes, F. X., & Swesty, F. D. 2000, ApJS, 126, 501
- Townsley & Bildsten (2003) Townsley, D. M., & Bildsten, L. 2003, ApJ, 596, L227
- Townsley & Bildsten (2004) Townsley, D. M., & Bildsten, L. 2004, ApJ, 600, 390
- Townsley & Bildsten (2005) Townsley, D. M., & Bildsten, L. 2005, ApJ, 628, 395
- Truran & Livio (1986) Truran, J. W., & Livio, M. 1986, ApJ, 308, 721
- Truran et al. (1988) Truran, J. W., Livio, M., Hayes, J., Starrfield, S., & Sparks, W. M. 1988, ApJ, 324, 345
- van Leer (1974) van Leer, Bram 1974, J. Comput. Phys., 14, 361
- Warner (1995) Warner, B. 1995, Cataclysmic Variable Stars (Cambridge: Cambridge Univ. Press)
- Williams (1982) Williams, R. E. 1982, ApJ, 261, 170
- Williams et al. (1981) Williams, R. E., Sparks, W. M., Gallagher, J. S., Ney, E. P., Starrfield, S. G., & Truran, J. W. 1981, ApJ, 251, 221
- Williams & Shafter (2004) Williams, S. J., & Shafter, A. W. 2004, ApJ, 612, 867
- Woosley (1986) Woosley, S. E. 1986, in Nucleosynthesis and Chemical Evolution, ed. B. Hauck, A. Maeder, & G. Magnet (Sauverny: Geneva Observatory)
- Yaron et al. (2005) Yaron, O., Prialnik, D., Shara, M. M., & Kovetz, A. 2005, ApJ, 623, 398