A model of dissociated cortical tissue
A MODEL OF DISSOCIATED CORTICAL TISSUE***A more
complete version of this paper is available at http://faculty.washingon.edu/stiber/Public/NC07.pdf.
| Michael Stiber†††To whom correspondence should be sent. Fumitaka Kawasaki | |
| Computing & Software Systems Program | |
| University of Washington, Bothell | |
| Bothell, WA, 98011-8246 USA | |
| stiber@u.washington.edu – http://faculty.washington.edu/stiber | |
| fumik@u.washington.edu | Dongming Xu |
| Linear Technology | |
| 15100 Weston Parkway Suite 202 | |
| Cary, NC 27513 USA | |
| dxu@linear.com |
ABSTRACT
A powerful experimental approach for investigating computation in networks of biological neurons is the use of cultured dissociated cortical cells grown into networks on a multi-electrode array. Such preparations allow investigation of network development, activity, plasticity, responses to stimuli, and the effects of pharmacological agents. They also exhibit whole-culture pathological bursting; understanding the mechanisms that underlie this could allow creation of more useful cell cultures and possibly have medical applications [1, 2].
This paper presents preliminary results of a computational study of the interplay of individual neuron activity, cell culture development, and the network behavior. We investigate whether bursting can occur in an initially unconnected “network” that develops connections according to an experimentally-verified model of cell culture connectivity growth.
Neuron Model
An integrate-and-fire neuron model with dynamical synapses that exhibit activity-dependent facilitation and depression was used [3, 4, 5]. It includes synaptic, constant, and noise currents, with a reset of its membrane voltage to a fixed value upon exceeding threshold and generating a spike and a fixed absolute refractory period thereafter.
The synapse has four state variables: three that govern the fraction of synaptic resources in particular states — (recovered state), (active state), and (inactive state) — and one, , that represents synaptic efficiency (see the more complete paper11footnotemark: 1 for detailed equations). See [5] for parameter values used.
Network Model
Simulations were conducted by constructing networks with model neurons on a rectangular grid. Connectivity was determined by incorporating a model of cortical cell culture connectivity development [6] that model’s neurite outgrowth as a radius of connectivity that changes at a rate inversely proportional to a sigmoidal function of cell firing rate:
| (1) | ||||
| (2) |
where is the radius of connectivity of neuron , is neuron ’s normalized firing rate, is a rate constant, is a constant that sets the “null point” for outgrowth (the normalized target firing rate that causes no outgrowth or retraction), and determines the slope of . One of the parameters varied in these simulations was .
Synaptic strengths were computed for all pairs of neurons that had overlapping connectivity regions as the area of their circles’ overlap. The bulk of the neurons in the network were excitatory; a small number were chosen to be inhibitory. Similarly, most neurons were not spontaneously active, but a few had lowered firing thresholds to produce spontaneous firing at a rate of between 0.02 and 6 spikes/sec. To produce more consistent simulation results, a set of standardized layouts was chosen to maximize spacing among inhibitory and spontaneously active cells and reduce edge effects. The fraction of cells that were inhibitory was the other simulation parameter varied.
Computer Implementation
We used CSIM (A Neural Circuit SIMulator) version 1.1 for the simulations. The original code was pared down to a small core that was linked to a stand-alone C++ program to run on Linux, Windows, and Macintosh computers. Generally speaking, each simulation took between two and 20 hours on computers with 2–3GHz microprocessors.
Simulations consisted of networks of 100 neurons in a 10x10 arrangement simulated for 30,000–60,000 seconds. While the rate of neurite outgrowth was greatly sped up compared to the living preparation, numerical investigation indicated that this did not introduce instability in the simulation.
Analysis Methods
To examine global behavior, average neuron firing rate and burstiness index (BI) [2] were calculated and plotted versus the two simulation parameters. BI was computed by first calculating a spike count vs. time histogram for the entire network during the last 5,000sec of the simulation. The fraction, , of the total number of spikes contained by the 15% most populous bins was then normalized to produce the burstiness index, BI, as . Detailed examination of single simulations involved plots of neurons’ connectivity radii and firing rate versus time.
| A | 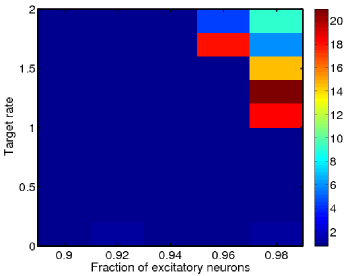 |
B | 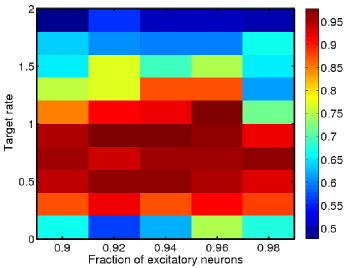 |
Results
An initial set of 50 simulations was performed with target rates in the range 0.1–1.9 (inclusive, in 10 steps) and fraction of excitatory neurons 0.9–0.98 (inclusive, in five steps). Figure 1(A) shows normalized firing rates for the final 5,000sec of each simulation. Only the simulations with higher target rates and fewer inhibitory neurons showed the great increase in firing rate that might be associated with bursting. Longer (60,000sec) simulations exhibited some bursting type of behaviors with the fraction of bursting as low as 0.9 for the higher target rates. Figure 1(B) indicates that the fraction of excitatory neurons in this range has only a modest effect on burstiness index (for 30,000sec simulations), and that moderate target rates produce the highest BI values. This apparent conflict with the previous observation of bursting at higher target rates can be explained by examining the detailed behavior of individual simulations.
 |
 |
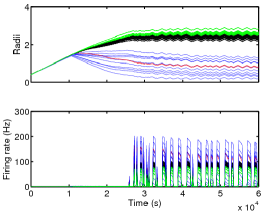 |
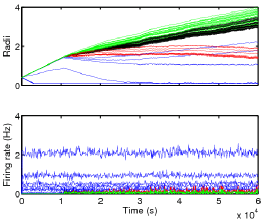
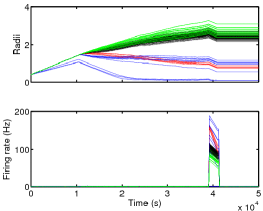
Figure 2 shows detailed information for simulations with three sets of parameters: (target rate, fraction excitatory cells) = (0.1, 0.9), (0.9, 0.94), and (1.9, 0.98). These include the parameter extremes and a central value and both bursting and non-bursting activity. In these cases, 60,000sec simulations were performed. Note that some of the simulations that weren’t bursting at 30,000sec were bursting shortly thereafter, as evidenced by the (0.9, 0.94) one.
Nevertheless, this confirms that the low BI values for low target rates correspond to non-bursting behaviors (and that the connectivity radii had not stabilized for cells that were not inhibitory or spontaneously active). Low BI values for high target rates were a possible result of the very broad or frequent bursts. For the bursting behaviors, connectivity radii have stabilized, excepting small variations during bursting. In all simulations, connectivity radii for edge neurons are larger than others, inhibitory neurons had moderate radii, while spontaneously active neurons had a wide range of different connectivities, likely due to the variability in their firing thresholds.
In either bursting or non-bursting behaviors, spontaneously active neurons tended to be the most active. This is not surprising, as their lowered thresholds would make them more excitable. The next higher firing rates belonged to the inhibitory cells, then non-edge cells, then edge cells.
 |
 |
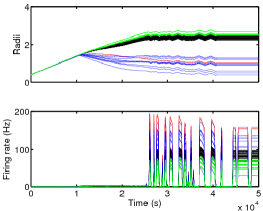 |
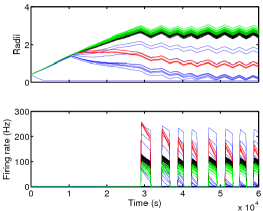
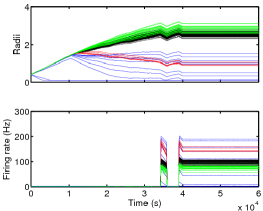
In the results in figure 2, it seems possible that the mechanism for burst initiation and termination is the variation in connectivity. Figure 3 presents simulations in which connectivity was fixed either during bursts (left, middle) or in between bursts (right). For the lower target rate/lower fraction of excitatory cells simulation, it does indeed seem that bursting is controlled by connectivity. However, for a higher rate/higher fraction of excitatory cells, bursting can continue even in the absence of variation in connectivity (this simulation also produced bursts when growth was stopped during a burst).
Discussion
Bursting occurred with sufficiently small inhibition and high target firing rate. One might expect the latter to produce greater connectivity for every neuron, which in turn would be the mechanism for whole-culture bursting. However, in the low-target-rate, non-bursting simulations, such as figure 2(left), non-inhibitory, non-spontaneously active cells grow large connectivity radii. Spontaneously active cells, on the other hand, tend to have large connectivity radii in the bursting simulations. Presumably, lowering these cells autonomous firing rate would result in bursting at lower target rates.
In previous investigations of bursting with randomly connected networks [4], the model synapses’ depression and facilitation were, neglecting the influence of noise, the mechanism underlying burst initiation and termination. Our preliminary results indicate that this is possibly the case under certain circumstances, but not all. For some regions of parameter space, it may be the case that the mechanism is a hysteresis effect involving changing connectivity radii. There are a number of possible reasons for this difference:
-
•
A number of parameters were set arbitrarily or not fully explored. These include fraction of excitatory cells, scaling of synaptic weights from area of connectivity overlap, and no differential scaling based on type of synapse (i.e., inhibitory vs. excitatory).
-
•
In the current simulations, only spontaneously active cells had any parameter variability; all other cells of a given type (inhibitory or excitatory) had identical parameters.
-
•
The overriding issue here is likely the small network size. Edge effects were great (edge neurons’ connectivity radii were always the greatest of all neurons and 36/100 of the cells were edge neurons) and there were small numbers of inhibitory and spontaneously active cells. The final networks were almost completely connected. Increasing network size to, say, 100x100, could have little impact on final connectivity radii but with each neuron having connections to less than 10% of the network.
Increasing network size will have computational consequences that must be addressed: in its current form, a 60,000sec simulation of a 100x100 network would take at least 2,000 hours (83 days).
There are also fundamental differences between the connectivity patterns generated by this model (perhaps most similar to radial basis functions) and many other models of cortex or recurrent networks (in which either network topology is irrelevant or a power law-type distribution is used that produces mostly local connections with a few long-range ones). It will be instructive to investigate the detailed correlation structure of inter- and intra-burst neuron firing.
Keywords: cortical cultures, network development, bursting.
References
- [1] J. V. Pelt, M. Corner, P. Wolters, W. Rutten, and G. Ramakers, “Longterm stability and developmental changes in spontaneous network burst firing patterns in dissociated rat cerebral cortex cell cultures on multielectrode arrays,” Neurosci. Lett., vol. 361, pp. 86–89, 2004.
- [2] D. A. Wagenaar, R. Madhavan, J. Pine, and S. M. Potter, “Controlling bursting in cortical cultures with closed-loop multi-electrode stimulation,” J. Neurosci., vol. 25, pp. 680–8, Jan. 2005.
- [3] M. Tsodyks, K. Pawelzik, and H. Markram, “Neural networks with dynamic synapses,” Neural Comp., vol. 10, pp. 821–35, 1998.
- [4] M. Tsodyks, A. Uziel, and H. Markram, “Synchrony generation in recurrent networks with frequency-dependent synapses,” J. Neurosci., vol. 20, no. RC50, pp. 1–5, 2000.
- [5] W. Maass, T. Natschläger, and H. Markram, “Real-time computing without stable states: A new framework for neural computation based on perturbations,” Neural Comp., vol. 14, pp. 2531–60, Nov. 2002.
- [6] A. Van Ooyen, J. Van Pelt, and M. Corner, “Implications of activity dependent neurite outgrowth for neuronal morphology and network development,” J. Theor. Biol., vol. 172, pp. 63–82, 1995.