11email: glamer@aip.de
2XMM J083026+524133:
The most X-ray luminous cluster at redshift 1
Abstract
Aims. In the distant universe X-ray luminous clusters of galaxies are rare objects. Large area surveys are therefore needed to probe the high luminosity end of the cluster population at redshifts .
Methods. We correlated extended X-ray sources from the second XMM-Newton source catalogue (2XMM) with the SDSS in order to identify new clusters of galaxies. Distant cluster candidates in empty SDSS fields were imaged in the - and -bands with the Large Binocular Telescope. We extracted the X-ray spectra of the cluster candidates and fitted thermal plasma models to the data.
Results. We determined the redshift for 2XMM J083026.2+524133 from its X-ray spectrum. With a bolometric luminosity of this is the most X-ray luminous cluster at redshifts . We measured a gas temperature of keV and estimate a cluster mass . The optical imaging revealed a rich cluster of galaxies.
Key Words.:
Galaxies:clusters:individual:2XMM J083026.2+524133 – X-rays:galaxies:clusters1 Introduction
Clusters of galaxies play an important role as cosmological probes and as laboratories for the evolution of galaxies. There is observational evidence that the cosmological evolution of the cluster X-ray luminosity function makes very massive, X-ray luminous clusters rare objects at high redshifts (e.g. Henry et al., 1992; Rosati, Borgani & Norman, 2002). At the same time, simulations show that the number counts of the most massive distant clusters depend strongly on the cosmological parameters, making them the most interesting cluster sample for cosmological studies (e.g. Borgani & Guzzo, 2001; Romer et al., 2001).
After the identification of the ROSAT surveys only a handful of clusters at redshifts beyond were known, since only few ROSAT observations were deep enough to reach the necessary flux limits. The identification of serendipitously detected XMM-Newton sources pushed the redshift limit for X-ray selected clusters beyond , where two clusters with X-ray luminosities of several have been discovered (Mullis et al., 2005; Stanford et al., 2006). Clusters at redshifts are now routinely identified from serendipitous XMM-Newton sources or in dedicated survey fields (e.g. Pierre et al., 2006; Finoguenov et al., 2007). However, the majority of these clusters have luminosities of only few times or less, placing them in the transition regime between clusters and groups of galaxies. In order to probe the high-luminosity part of the distant cluster population, large area surveys are needed to find high luminosity, distant clusters. To date the largest medium sensitivity X-ray survey is the serendipitous XMM-Newton survey, which contains all sources found with the EPIC cameras in the public XMM-Newton observations.
In section 2 of this paper we describe the selection of cluster candidates from XMM-Newton sources. The analysis of the X-ray data and optical observations of a new distant and very luminous cluster is described in sections 3 and 4 respectively. Section 5 concludes the paper with a brief discussion and outlook.
The cosmological parameters , and have been used throughout this paper, unless mentioned otherwise. With these parameters the linear scale at is .
2 Cluster candidate selection
We have started a programme to identify the extended source content of the second XMM-Newton catalogue (2XMM Watson et al., 2008). 2XMM is based on a compilation of EPIC observations performed before May 2007. It covers a sky area of square degrees and comprises 192,000 unique X-ray sources. The source detection software, based on the XMM-SAS version 7.1, was configured to discern point like and extended X-ray sources and a -model profile is fitted to the images of extended sources. Since the spurious detection rate among the extended sources in 2XMM is relatively high, we have cleaned the sample of extended sources for obviously spurious detections by means of visual inspection of the X-ray images.
We have correlated the confirmed extended sources with the spectroscopic and photometric databases of the Sloan Digital Sky Survey (SDSS). The 2XMM survey area within the SDSS DR6 footprint is square degrees. The results on the 2XMM cluster candidates detected in the SDSS will be reported elsewhere. For a relatively small number of extended X-ray sources no cluster or galaxy counterpart is visible in the SDSS images. These sources can be considered as candidates for distant clusters beyond redshifts of . The cluster 2XMM J083026.2+524133 was the brightest X-ray source among these “empty field” candidates.
3 X-ray data
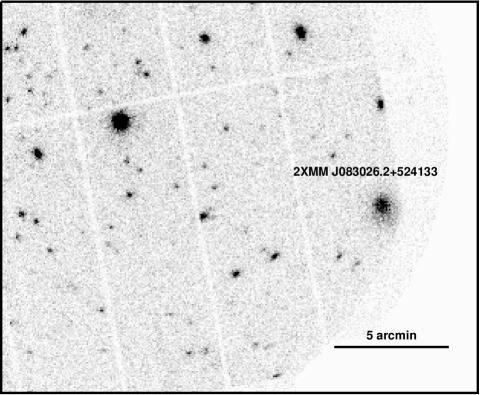
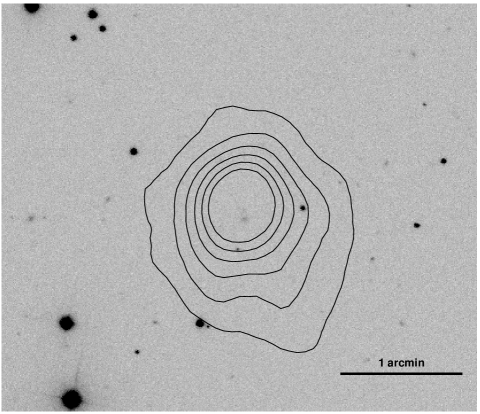
2XMM J083026.2+524133 has been serendipitously detected in XMM EPIC observations of the quasar APM 08279+5255 (Observation IDs 0092800101, 0092800201) and entered the 2XMM source catalogue as an extended X-ray source. The extended nature was clearly confirmed by our visual screening (see Fig. 1). Some catalogue parameters of the source, henceforth referred to as 2XMM 0830 are summarised in Table 1.
| ObsID | 0092800101 | 0092800201 |
|---|---|---|
| PN paramater | ||
| ONTIME [s] | 13896 | 72133 |
| OFFAX [′′] | 13.2 | 10.9 |
| CR .2-12 keV [s-1] | ||
| PN flux | ||
| .2-12 keV [] | ||
| .5-2 keV [] | ||
| COUNTS |
With more than 4000 detected source counts in the EPIC PN camera the
source is bright enough to attempt a redshift determination based on
its X-ray spectrum.
We extracted the source counts from the merged data files and created
the spectra, the detector response matrix, and the effective area
using XMM SAS version 7.1. In the MOS2 image the cluster centre
unfortunately lies on a gap between two CCDs. Therefore we excluded
this camera from our analysis. We varied the aperture of the source
extraction region and found that with a radius of the
cluster redshift and temperature are determined with smallest
uncertainties.
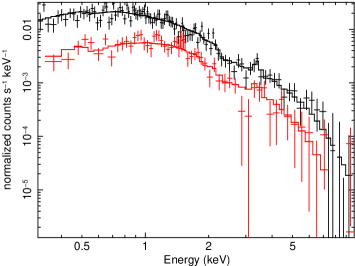
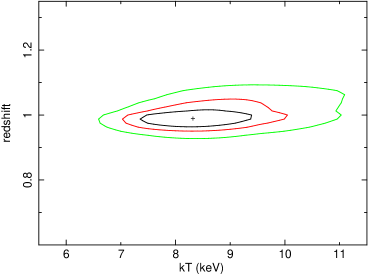
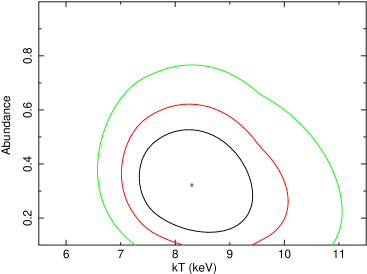
We used XSPEC version 12.0 to subtract the background spectra and to fit MEKAL plasma models. The MEKAL code (Kaastra, 1992; Liedahl, 1995) allows to set a metal abundance parameter relative to the solar values provided by Anders & Grevesse (1989). Fits were carried out using the Cash-statistics and a binning with at least one photon per spectral bin. The Galactic neutral hydrogen column density in the direction of 2XMM 0830 is , as obtained from radio data (Dickey & Lockman, 1990). The Fe K-line is visible in both spectra at , see Fig. 2. Hence, the redshift of 2XMM 0830 is unambiguously determined by the X-ray data, see Fig. 3. The best-fit redshift, temperature, and metallicity are , , and . The latter is in agreement with the results of Balestra et al. (2007) and Maughan et al. (2008), who analysed the Chandra spectra of larger cluster samples and found and as the mean abundances at .
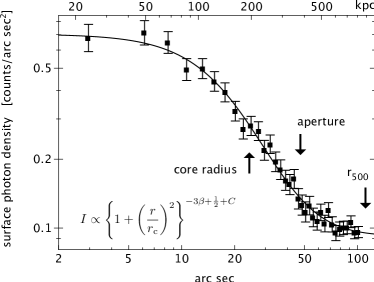
The spectral fit provides also the background subtracted bolometric
X-ray flux within the aperture of . Using the concordance
cosmological model allows to calculate the intrinsic luminosity of
the cluster. However, the used aperture corresponds to a radius
significantly smaller than . We estimate the
missing flux by approximating a -model. Fig. 4 shows the
spherically averaged surface photon density for the MOS1 image.
Allowing all parameters to vary in a least-square fit we find for the
slope and for the core radius . Now, we determine by the temperature-radius
relation given in O’Hara et al. (2007). For the redshift and temperature
of 2XMM 0830 derived above we obtain ,
corresponding to . With the results of the
-profile fit we find for the intrinsic luminosity of 2XMM 0830 .
The mass of a cluster can be estimated by a model based on spherical symmetry and hydrostatic equilibrium. Since for 2XMM 0830 the determination of the temperature profile is not possible, we additionally assume isothermality. As a result, the total mass is given by
| (1) |
(see e.g Hicks et al., 2007).
Using the properties of 2XMM 0830 as derived above we obtain for the mass
, where we set
as expected for a fully ionised ICM. For comparison, the
mass-temperature relation of Vikhlinin et al. (2006) predicts
, which is within of
our derived value.
The luminosity of this cluster agrees within the errors with the local relation (Markevitch, 1998). However, Kotov & Vikhlinin (1998) and Maughan et al. (2006) argued that the luminosity scales with redshift roughly in concordance with the expectations of self-similar cluster evolution. Contrarily, O’Hara et al. (2007) found only very little evolution of the -relation in a recent analysis of a sample of 70 clusters observed with Chandra. A similar discrepancy has been found for the most distant cluster, XMMXCS J2215.9-1738; it is under-luminous even compared to the local -relation (Hilton et al., 2007). This illustrates that the evolution of gas scaling properties is still poorly constrained. Hence, a larger high redshift cluster sample is needed and selection effects have to be modelled properly.
4 Optical imaging
No cluster galaxies or any other plausible optical counterparts for an extended X-ray source are visible in SDSS images at the position of 2XMM 0830 (Fig. 5). A rather blue galaxy (SDSS J083026.39+524130.5, ) with disk-like appearance some 6 arcsec south of the X-ray position is most likely a foreground spiral galaxy.
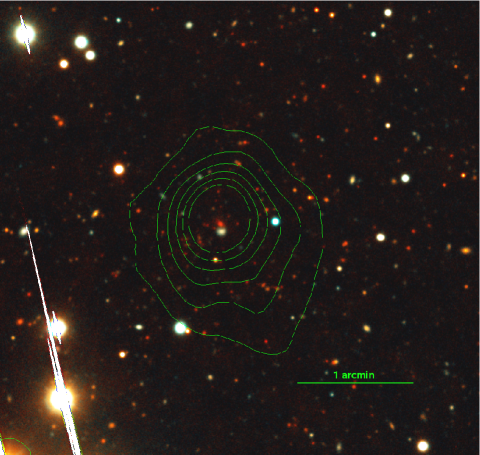
We have obtained deep and images in the field of 2XMM 0830 using the LBC cameras of the LBT. The -band image was taken with the blue LBC camera and the -band image with the red camera. Both bands have total exposure times of 18 minutes ( minutes) and were taken on May 10th, 2008. The data reduction was accomplished with a pipeline software based on the Garching-Bonn Deep Survey (GaBoDS) pipeline, which has been modified at AIP to process the LBC data. The astrometry and photometry of the stacked images has been tied to the SDSS. The image quality of the reduced images is FWHM=1.1 arcsec in the -band image and 1.5 arcsec in the -band. A colour composite of the two images is shown in Fig. 6. The LBT images reveal a clear overdensity of red galaxies within the X-ray contours. The brightest cluster galaxy is located close to the peak of the X-ray emission. Its z-band magnitude of 19.44 and colour =2.15 are consistent with the X-ray redshift . A detailed analysis of the LBT data will be presented in a forthcoming paper.
5 Summary
Based on the X-ray data we show that 2XMM J083026.2+524133 is a massive cluster at . Its luminosity of and temperature of keV are unsurpassed at its distance and beyond. The only comparable known cluster is CL J1226.9+3332 (Ebeling et al., 2001) which is less distant at , but even more luminous and hotter (, , Maughan et al., 2007).
The luminosity of 2XMM 0830 is possibly enhanced by a cool core. Since its X-ray flux makes 2XMM 0830 an ideal target for more detailed investigations in X-rays, we have applied for a deep Chandra observation in order to investigate a possible cool core of the cluster and to establish an improved mass model.
How likely is it to find a cluster with the mass of 2XMM 0830 in the XMM-Newton serendipitous survey data? We have estimated the number of clusters with expected in the redshift shell and of the sky corresponding to our survey area in the 2XMM-SDSS overlap. The mass function of Gottlöber et al. (2006), based on the large MareNostrum Universe SPH simulation using the “WMAP first year” cosmology () predicts 5 clusters. Calculating the mass function following Press & Schechter (1974) for the “WMAP 3 years” cosmological parameters with predicts 0.1 clusters in our survey. Changing to increases the expected cluster count to 0.4. Given the uncertainty of our mass estimate, we conclude that the XMM-Newton discovery of one or few clusters like 2XMM 0830 is within the expectations. However, we will have to await the eROSITA all-sky survey (Predehl et al., 2006) to find a larger number of these very massive clusters.
Acknowledgements.
GL and MH acknowledge support by the Deutsches Zentrum für Luft- und Raumfahrt (DLR) under contracts 50 QR 0802 and 50 OX 0201. JK is supported by the DFG priority programme SPP1177 (grant no. SCHW563/23-1). This work is based on observations obtained with XMM-Newton and on data acquired using the Large Binocular Telescope (LBT). We thank Alexander Knebe for providing code to calculate the Press-Schechter mass function.References
- Anders & Grevesse (1989) Anders, E., and Grevesse, N., 1989, Geochim. Cosmochim. Acta, 53, 197
- Balestra et al. (2007) Balestra, I., Tozzi, P., Ettori, S., Rosati, P., Borgani, S., Mainieri, V., Norman, C. and Viola, M. 2007, A&A, 462, 429
- Borgani & Guzzo (2001) Borgani, S., & Guzzo, L., 2001, Nature, 409, 39
- Dickey & Lockman (1990) Dickey, J. M., and Lockman, F. J., 1990, ARA&A, 28, 215
- Ebeling et al. (2001) Ebeling, H., Jones, L.R., Fairley, B.W., Perlman, E., Scharf, C., and Horner, D., 2001, ApJ, 548, L23
- Finoguenov et al. (2007) Finoguenov, A. Guzzo, L., Hasinger, G. et al., 2007, ApJS, 172, 254
- Gottlöber et al. (2006) Gottlöber, S., Yepes, G., Khalatyan, A., Sevilla, R., and Turchaninov, V., 2006, in “THE DARK SIDE OF THE UNIVERSE, DSU 2006”, AIP Conference Proceedings, Volume 878, 3
- Henry et al. (1992) Henry, J.P., Gioia, I.M, Maccacaro, T., Morris, S.L., Stocke, J. T., and Wolter, A., 1992, ApJ, 386, 408
- Hicks et al. (2007) Hicks, A. K., Ellingson, E.,Hoekstra, H., Gladders, M., Yee, H. K. C., Bautz, M., Gilbank, D., Webb, T., and Ivison, R., 2007, arXiv 0708.3671
- Hilton et al. (2007) Hilton, M., Collins, C. A., Stanford, S. A., Lidman, C., Dawson, K. S., Davidson, M., Kay, S. T., Liddle, A. R., Mann, R. G., Miller, C. J., Nichol, R. C., Romer, A. K., Sabirli, K., Viana, P. T. P., and West, M. J. , 2007, ApJ, 670, 1000
- Kaastra (1992) Kaastra, J.S., 1992, Internal SRON-Leiden Report, updated version 2.0
- Kotov & Vikhlinin (1998) Kotov, O. and Vikhlinin, A., 2005, ApJ, 633, 781
- Liedahl (1995) Liedahl, D.A., Osterheld, A.L., and Goldstein, W.H., 1995, ApJ, 438, L115
- Markevitch (1998) Markevitch, M., 1998, ApJ, 504, 27
- Maughan et al. (2006) Maughan, B. J., Jones, L. R., Ebeling, H., and Scharf, C., 2006, MNRAS, 365, 509
- Maughan et al. (2007) Maughan, B.J., Jones, C., Jones, L.R., and Van Speybroeck, L., 2007, ApJ, 659, 1125
- Maughan et al. (2008) Maughan, B. J., Jones, L. R., Forman, H., and Van Speyboeck, L., 2008, ApJS, 174, 117
- Mullis et al. (2005) Mullis, C.R., Rosati, P., Lamer, G., Böhringer, H., Schwope, A., Schuecker, P., and Fassbender, R., 2005, ApJ, 623, L85
- O’Hara et al. (2007) O’Hara, T. B., Mohr, J. J., and Sanderson, A. J. R., 2007, arXiv 0710.5782
- Pierre et al. (2006) Pierre, M., Pacaud, F., Duc, P.A., et al., 2006, MNRAS, 372, 591
- Predehl et al. (2006) Predehl, P., Hasinger, G., Böhringer, H., et al., 2006, Proceedings of the SPIE, 6266, p. 62660
- Press & Schechter (1974) Press, W.H., and Schechter, P. , 1974, ApJ, 187, 425
- Romer et al. (2001) Romer, K.A., Viana, P.T.P, Liddle, A.R., and Mann, R.G., 2001, ApJ, 547, 594
- Rosati, Borgani & Norman (2002) Rosati, P., Borgani, S., and Norman, C., 2002, ARA&A, 40, 539
- Poole et al. (2008) Poole, G. B., Babul, A., McCarthy, I. G., Sanderson, A. J. R., and Fardal, M. A. 2008, arXiv 0804.1552
- Stanford et al. (2006) Stanford, S.A., Romer, K.A., Sabirli, K., et al., 2006, ApJ, 646, L13
- Vikhlinin et al. (2006) Vikhlinin, A., Kravtsov, A., Forman, W., Jones, C., Markevitch, M.,Murray, S. S., and Van Speybroeck, L., 2006, ApJ, 640, 691
- Watson et al. (2008) Watson, M.G. et al., 2008, A&A, in preparation