Crossover from one-dimensional copper-oxygen chains to two-dimensional ladders charge transport in (La,Y)y(Sr,Ca)14-yCu24O41
Abstract
The charge transport in the copper-oxygen chain/ladder layers of (La,Y)y(Sr,Ca)14-yCu24O41 is investigated along two crystallographic directions in the temperature range from 50 K to 700 K and for doping levels from (number of holes ) to (number of holes ). A crossover from a one-dimensional hopping transport along the chains for to a quasi-two-dimensional charge conduction in the ladder planes for is observed. This is attributed to a partial hole transfer from chains to ladders when the hole doping exceeds and approaches fully doped value . For a weak dielectric relaxation at radio-frequencies and a microwave mode are detected, which might be recognized as signatures of a charge-density wave phase developed at short length scales in the ladders planes.
pacs:
74.72.Jt, 71.27.+a, 72.20.Ee, 71.45.LrI Introduction
The spin-ladder and spin-chain systems (La,Y)y(Sr,Ca)14-yCu24O41 belong to a vast class of strongly correlated materials, transition metal oxides, which exhibit some of the most intriguing phenomena in condensed matter physics.Maekawa04 The huge literature on the topics of spin-chains and spin-ladders accumulated in the last decade (for a review see Ref. Vuletic06, ) has been triggered by the discovery of superconductivity under pressure in the compound Sr14-xCaxCu24O41, , mostly since this system is the first superconducting copper oxide material with a non-square-lattice.Uehara96 The parent material, Sr14Cu24O41, of this cuprate superconductor is a charge density wave (CDW) insulator with a spin gap.Gorshunov02 ; Blumberg02 ; Abbamonte04 ; Kumagai97 Substituting isovalent Ca for Sr suppresses the CDW insulating phase as shown by dc and ac transport measurements,Vuletic03PRL while the spin gap remains constant.Kumagai97 ; Vuletic06 Nevertheless, recent resonant soft X-ray scattering results Rusydi06 indicate that the CDW might stabilize even for the highest Ca substitution but with a different periodicity indicating strong commensurability effects. When for the compounds with high Ca content external pressure is applied, the spin gap decreases in size, but remains finite even when SC sets in.Piskunov01 Applying pressure also increases interladder coupling leading to metallic transport along both the legs and rungs of the ladders, Nagata98 as well as raises the number of mobile quasi-particles at low temperature.Fujiwara03 ; Piskunov04 These particles have a finite density of states at the Fermi level and might contribute to the superconducting instability. All these results together with an indication for the existence of a Hebel-Slichter coherence peak in the SC state as well as the significant level of disorder in the doped ladders of Sr14-xCaxCu24O41, indicate that the superconducting pairing mechanism and symmetry are probably different compared to theoretical predictions for pure single ladders.
By now it is well understood that the amount of doped holes and their distribution between chains and ladders determines electronic phases and the spin and charge dynamics. In the fully doped material Sr14Cu24O41 the total number of holes () is six per formula unit. The hole distribution between chains and ladders is probed most directly by the polarization-dependent near-edge X-ray absorption fine structure (NEXAFS): at room temperature (RT) according to Nücker et al. Nuecker00 there is close to one hole per formula unit transferred in the ladders (equivalent to holes per ladder copper site) and about five remain in the chains. Very recently, a quite different distribution of close to three holes per formula unit on both ladders and chains is suggested by Rusydi et al.Rusydi07 The two-dimensional (2D) ladders present a dominant charge transport channel: RT conductivity along the -axis is cm-1 and along the -axis cm-1. Although is rather high, it shows an insulating behavior, i.e. it decreases with lowering temperature down to the charge-density wave phase transition; a similar behavior is found in as well.Vuletic05 At the same time, the remaining holes in the chains negligibly contribute to the charge transport: spin dimers are formed between those Cu2+ spins that are separated by a localized Zhang-Rice singlet (Cu3+), that is, a site occupied by a localized hole. In this way the antiferromagnetic (AF) dimer pattern is created in chains together with the charge order, both inducing gaps in the spin and charge sector, respectively.Matsuda96 ; Matsuda96a ; Takigawa98 ; Regnault99 ; note1 On the other hand, in the underdoped materials (La,Y)y(Sr,Ca)14-yCu24O41 () the absence of holes in ladders eliminates the ladder CDW phase, and suppresses the charge-ordered gapped state in chains in favor of disorder-driven insulating phase with charge transport by variable range hopping (VRH).Vuletic03PRB ; VuleticJPF05 The hopping transport originates in the non-periodic potential in which holes reside and which is induced by strong local distortions of the chains due to the irregular coordination of La3+, Y3+, Sr2+ and Ca2+ ions. The VRH conductivity can then be explained as a result of the distorted distribution of microscopic conductivities, as predicted in Anderson’s localization theory. In short, the copper-oxygen chains in the underdoped quasi-1D cuprates can be considered like a one-dimensional system in which disorder, associated with random distribution of holes, causes the Anderson localization.
In our previous work Vuletic03PRB ; Vuletic06 ; VuleticJPF05 we have suggested that these results reveal an intriguing possibility for the existence of a phase transition close to in the phase diagram of (La,Y)y(Sr,Ca)14-yCu24O41 compounds and that further experiments on materials with very low La/Y content, which corresponds to , should elucidate our proposal. In this article we attempt to answer this intriguing question on how and why and at which doping level the one-dimensional hopping transport along the chains crosses over into a quasi-two-dimensional charge conduction in the ladder planes. In order to clarify this issue, we have undertaken dc and ac conductivity-anisotropy measurements on single crystals of (La,Y)y(Sr,Ca)14-yCu24O41 with different La/Y content (a particular emphasis was put on La/Y contents approaching ) in a wide frequency and temperature range. We show that for the systems with () variable-range hopping fails as a relevant picture for the observed conductivity and that the charge sector bears features encountered in the fully doped systems: conductivity anisotropy is of similar order of magnitude and the logarithmic derivative of resistivity presents (wide) maxima. These results suggest that in the underdoped systems with doping levels ladders start contributing to charge transport properties and prevail over chains as an electrical transport channel. Concomitantly, frequency-dependent conductivity seems to indicate that charge ordering at short scales starts to develop in the ladders.
II Sample characterization and experimental methods
High-quality single crystals of materials with low Y content were synthesized: (Sr14Cu24O41), (Y0.55Sr13.45Cu24O41), (Y1.6Sr12.4Cu24O41). Samples were characterized by powder X-ray diffraction and Y content was determined by an electron probe microanalyzer. In this study needle-like samples of about 0.4 mm3 in size were used, cut out of bulk single crystals of these materials, together with previously synthesized (La3Sr3Ca8Cu24O41) and (La5.2Ca8.8Cu24O41). Crystallographic orientation of crystals used in the resistivity anisotropy measurements was determined by taking X-ray back-reflection Laue patterns, and their subsequent simulation using OrientExpress 3.3 software.Ognjensw Simulated meshes of two overlapping sublattice unit cells ( nm, nm, nm, Fmmm - for ladders; and nm, nm, nm, Amma - for chains) fitted well with the recorded patterns in case of proper crystallographic alignment. The same crystallographic orientations were found in all single crystals: the crystallographic plane was found to be parallel to the largest faces of the needle-like prismatic shape crystals: either -axis or -axis were properly oriented lengthwise, along the needle axis. dc resistivity was measured between 50 K and 700 K.
A Hewlett Packard 4284A and an Agilent 4294A impedance analyzers were used to measure complex conductivities of , 0.55 and 1.6 at frequencies between 20 Hz and 10 MHz.Pinteric01 The data at the lowest frequency matched our four-probe dc measurements. The complex dielectric function at frequencies 5–25 cm-1 was obtained by complex transmission measurements using a coherent-source THz spectrometer.BWO For latter measurements crystals with plane-parallel faces were prepared by polishing, with thickness of about 0.5 mm and of transverse dimensions about mm2. All measurements were done along the two crystallographic axes defining chain and ladder layers: -axis (along the ladders legs and chains) and the -axis (along the ladders rungs).
III Results and analysis
III.1 dc transport
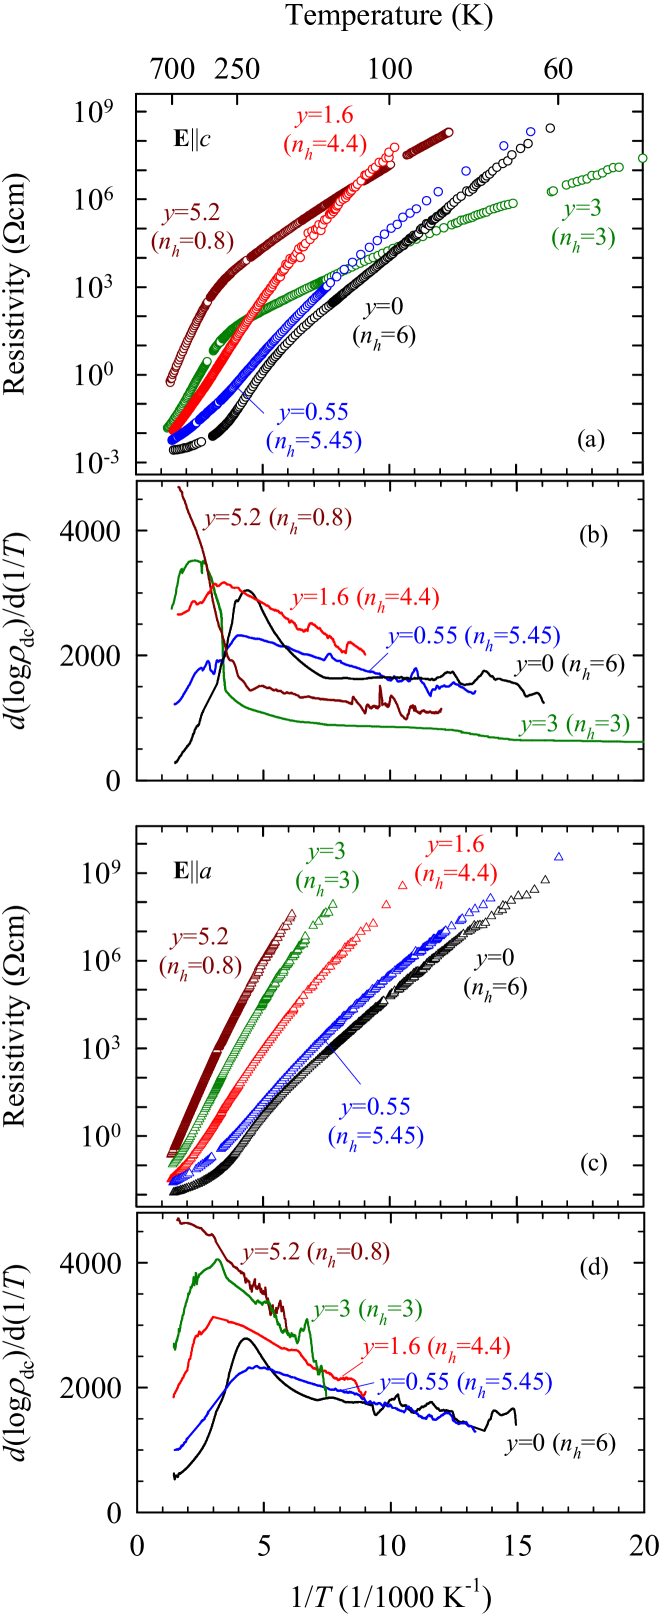
Fig. 1 shows the behavior of dc resistivity and its logarithmic derivative for different La/Y content ranging from to along the -axis [panels (a) and (b)] and the -axis [panels (c) and (d)] in the wide temperature range from 50 K (the lowest temperature obtained in our experiment) up to 700 K. While for two compounds with high and 3 the dc resistivity curves along the -axis and the -axis markedly differ below about 300 K, the one along the -axis presenting a much smaller increase with lowering temperature, one finds an almost identical behavior of dc resistivity along the both axes for , 0.55 and 0. An immediate conclusion that can be drawn from observed behaviors is that the conductivity anisotropy becomes significantly enhanced for high La/Y content (i.e. low hole count ), whereas it remains small and temperature-independent for low (high ), as depicted in Fig. 2. The qualitative difference between the two kinds of behavior is emphasized in Fig. 2, which shows conductivity anisotropies normalized to the corresponding RT values. The conductivity anisotropy at RT is in the range of 1-30 and basically does not correlate with La/Y content.

The next significant difference between low and high La/Y contents is found in the temperature dependence of the dc conductivity curves. As already reported for and 3, the dc conductivity along the -axis follows a variable-range hopping behavior with the dimension of the system , and crosses over around to nearest neighbor hopping at high temperatures.Vuletic03PRB ; Vuletic06 ; VuleticJPF05 The observation of type of VRH conduction is in accord with a rather small interchain coupling in (La,Y)y(Sr,Ca)14-yCu24O41. Conversely, VRH fits
| (1) |
to the curves for and fail to give a meaningful description: the respective values of the VRH activation energy meV and 9000 meV, obtained from the fit of our data by expression (1) are much larger than those for and 3. This result is at variance with the behavior expected in the VRH mechanism: the more conductive the sample, the lower is expected. Indeed, these values are markedly different from the ones expected theoretically: meV and 700 meV, see Table 1. Here the energy of sites available for hops near the Fermi energy has a uniform distribution in the range to , is the distance between the nearest Cu chain sites and is the localization length. In particular, the experimental values are so high that the usual interpretation of the hopping parameters also leads to values too low for the density of states for and 0.55, when compared with and 3. It can be noted that the one-dimensional VRH conducting channel along the -axis, which is present in , is more efficient when compared with the transport in .
Comparing compounds with high and low the behavior of dc resistivity along the -axis, , differs in a manner that is qualitatively alike . The slope of vs. curves for and 3 shows that the activation energy is much larger at high temperatures and becomes smaller with decreasing , whereas for and 0 we find an opposite behavior: a smaller activation energy at high temperatures and a larger one at low temperatures. It appears that the compound is situated somewhere at the border between these two distinct behaviors. We recall that for a smaller activation energy at high temperatures and a larger at low temperatures is a feature associated with an insulator-to-insulator phase transition into the CDW phase in the ladders.Vuletic05
| Compound | (meV) | (K) | (meV) | (Å) | (meV) | |
|---|---|---|---|---|---|---|
| Y0.55Sr13.45Cu24O41 | 0.55 | 0.960 | 750 | |||
| Y1.6Sr12.4Cu24O41 | 1.6 | 0.677 | 1900 | |||
| La3Sr3Ca8Cu24O41 | 3 | 0.481 | 3400 | |||
| La5.2Ca8.8Cu24O41 | 5.2 | 0.435 | 4600 |
Another difference between compounds with low and high contents becomes obvious when looking at the logarithmic derivative curves (Fig. 1, panels (b) and (d)). For (but not and 5.2), both and orientation show a broad and flat maximum in centred at about 210 K, similar to where this feature, albeit more narrow, is recognized as a signature of the CDW phase transition in the ladders. This feature remains visible for ; however it is now extremely broad and flat, shifted to 300 K and more pronounced for than in orientation.

Finally, an unusual result concerns the magnitude of RT conductivityBorisnote along both axes which increases substantially with total hole count (see Fig. 3). It is evident that the increased number of holes per formula unit cannot account completely for this orders-of-magnitude rise in conductivity. Theoretically, doping could create a finite density of states at the Fermi level by shifting the Fermi level from the gap into the region with high density of states, which then might partially account for the observed conductivity rise. Nevertheless, an overall rise hints to an extraordinary increase of mobility which happens for smaller than two.
III.2 ac conductivity and dielectric function
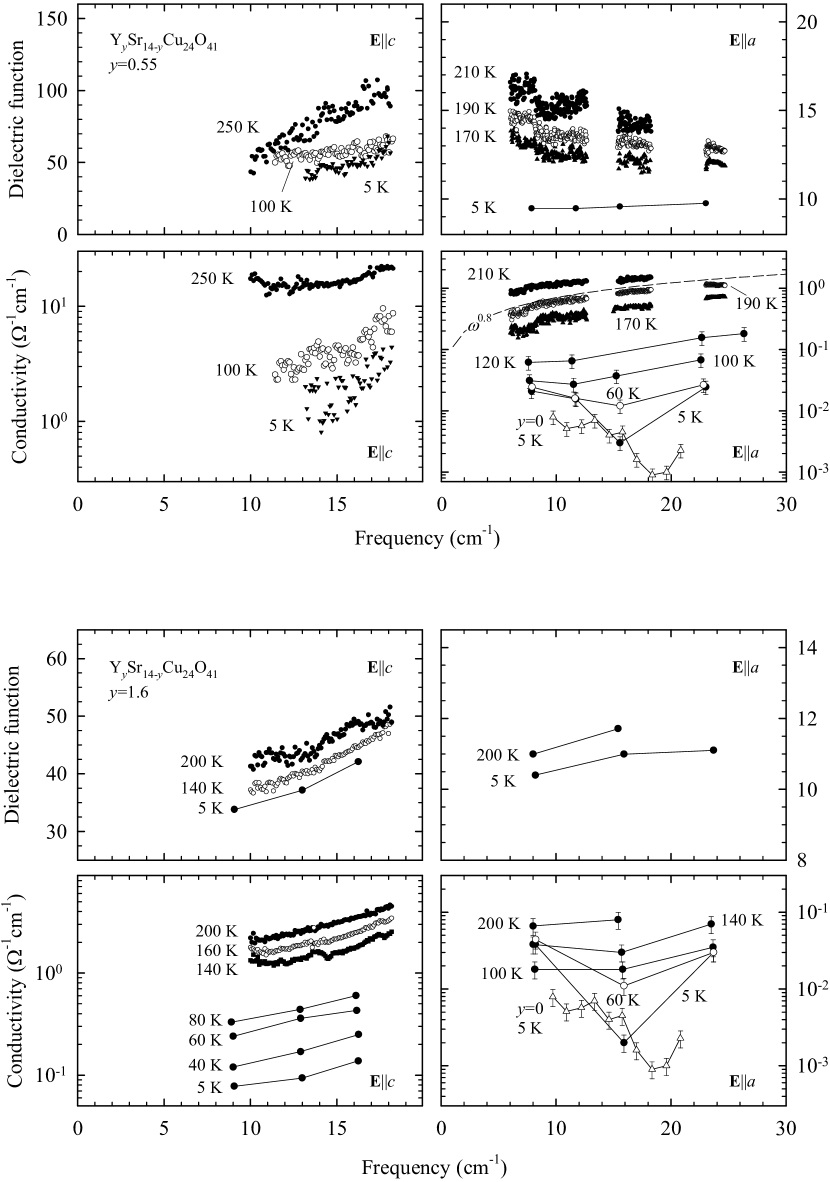
We now turn to other features derived from a comparative analysis of dc and ac conductivity data. The conductivity spectra of (La,Y)y(Sr,Ca)14-yCu24O41 for and 1.6 in the frequency range between 5 and 25 cm-1 at several representative temperatures are shown in Fig. 4. An almost dispersionless conductivity spectrum at RT revealing the existence of a metallic response of in the infrared conductivity along both -axis and -axis (see Fig. 67 in Ref. Vuletic06, ) is also evident for and 1.6.note2 This result indicates the appearance of a certain amount of free charges not detected for and 5.2 (see Inset of Fig. 3 in Ref. Vuletic03PRB, ) and indicates that the observed spectra could be attributed to the charge excitations in the ladders similarly as for .Vuletic06 We will address this behavior once more at the end of this Section. On lowering the temperature below 200 K, a suppression of the Drude weight is clearly visible in the conductivity spectra along the -axis and -axis indicating that an insulating behavior develops.
We note that in all studied cases (here we point out in particular and ) the conductivity behavior in the dc limit (see Fig. 1) is followed by a conductivity rise leading to a relatively high ac conductivity in the infrared, as compared to the dc conductivity. A mechanism standardly responsible for such a conductivity rise is electronic hopping conduction characterized by a power-law dispersion . Indeed, hopping conduction with has already been established in the ladders of compound for and , as well as in the chains of and 5.2 for .Vuletic03PRB ; Vuletic06 ; VuleticJPF05 In this study, the power-law behavior is found only for () between 200 K and 100 K, freezing out at lower temperatures. There are two reasons which prevented detection of hopping conduction for other cases. The first is related to the phonon tail masking the hopping dispersion for orientation.note3 Indeed, for the -axis response of and 1.6, at the lowest temperature ( K) we see a typical phonon tail in the THz range. It seems that for these two compositions the lowest frequency phonon sits at about 25 cm-1, i.e. at the same frequency where the lowest frequency phonon for the (see Fig. 3 in Ref. Vuletic03PRB, ) and for Sr11Ca3Cu24O41 compound was found. The second reason preventing electronic hopping detection for below about 100 K is due to a clear conductivity increase below 20 cm-1. We propose that this increase might be an indication of a pinned CDW mode located in the microwave range. It is noteworthy that this feature is also visible for compound (see Fig. 4 for ). Having only the higher frequency slope of the mode we cannot make a quantitative fit and determine parameters like eigenfrequency, dielectric strength and damping. Nevertheless, estimates based on our dielectric function and conductivity data indicate that these parameters would be much different from those of the pinned CDW mode at 1.8 cm-1 as inferred by Kitano et al.Kitano01 for fully doped compound Sr14Cu24O41 based on some distinct microwave points, and as discussed at length in Ref. Vuletic06, . On the other hand, for we do not detect any signature of this pinned mode in the THz range, which might be either due to its location at lower frequencies, or the mode being masked by a contribution of free carriers or a nearby phonon. It is noteworthy that this mode, which we tentatively attribute to the pinned CDW mode, is absent in the THz spectra of and 5.2 compounds. This behavior indicates that an alternative assignment of the CDW pinned mode emerging from our data, although at delicate grounds due to a very narrow frequency range, might be of relevance which should not be neglected. The issue of pinned CDW mode and its evolution in YySr14-yCu24O41 obviously deserves more attention in the future. As far as dielectric constant of and 1.6 is concerned, we note that it coincides well with the dielectric constant of the fully doped compound Sr11Ca3Cu24O41 (see Fig. 66 in Ref. Vuletic06, ), meaning that the infrared phonon spectra of all these three materials could be very similar.
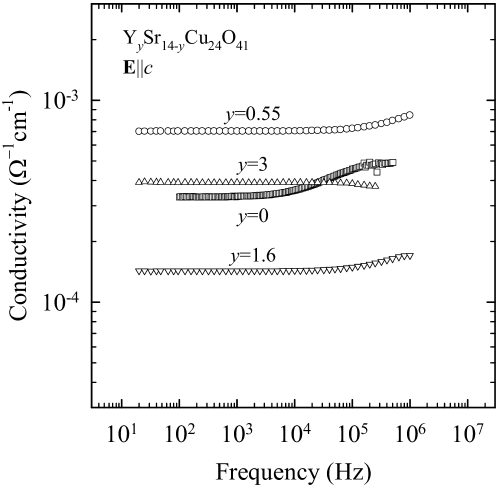
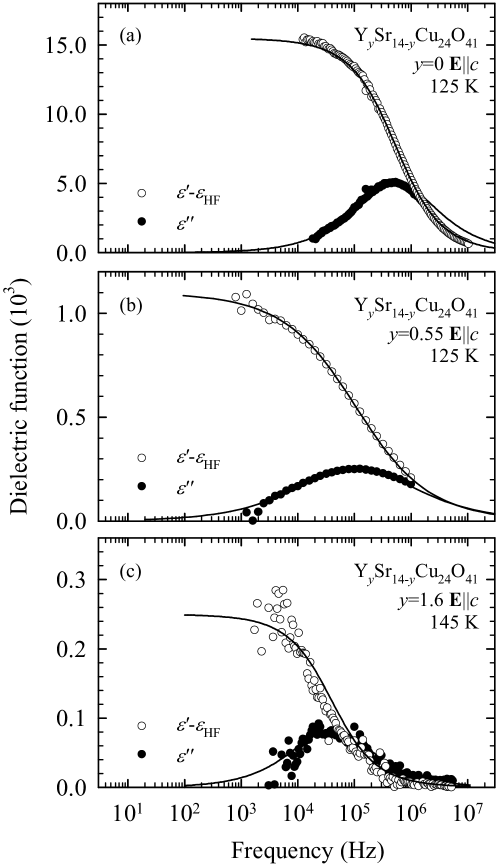
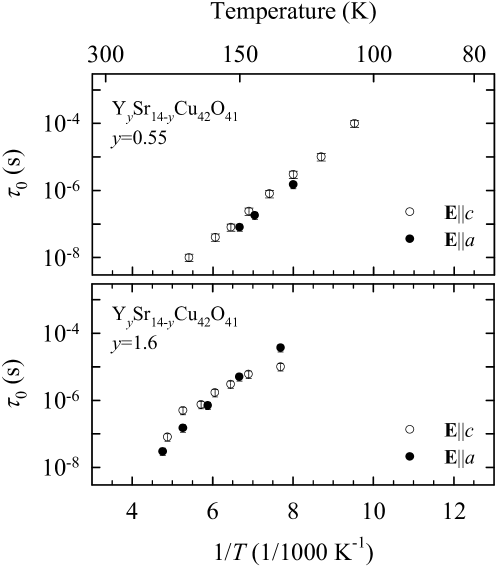
We turn now to the radio-frequency results. While for compound the CDW develops in the ladders yielding a pronounced step-like conductivity increase in the radio-frequency range, the frequency dependence is much weaker for and 1.6 and even comparable to compound (see Fig. 5). We recall that for as well as for the frequency independent behavior is found in the radio-frequency range for all temperatures.Vuletic03PRB ; Vuletic06 ; VuleticJPF05 However, unlike for and y = 5.2, when the complex dielectric function for and 1.6 is calculated from complex conductivity, a weak dielectric relaxation mode emerges (see Fig. 6): a characteristic step-like drop in the real part of dielectric function and a wide maximum in the imaginary part, resembling that of the fully-doped Sr14Cu24O41 parent system (), where CDW is fully developed. A similar behavior is observed for both polarizations and , as in the case of . Also, the mean relaxation time has comparable values and temperature dependence when measured along both the - and -axis (Fig. 7).Vuletic05 ; Vuletic06 However, contrary to the case, the temperature range in which we were able to track the mode for and 1.6 was rather narrow (see Fig. 7). Still, a systematic trend in the behavior upon doping is clearly visible. In this range the dielectric strength is small ( and for and , respectively) when compared to the value for ( at same temperatures). Another worrisome issue is that, because of the small low-frequency capacitance, we were not able to follow its disappearance. Nevertheless, we are tempted to qualitatively associate this weak mode with a ladder CDW order which persists only at short length scales for and 1.6, whereas it fully disappears for and 5.2.
Finally, coming back to the crossover from metallic to insulating behavior upon doping (i.e. increasing ), we compare the RT ac conductivity at 10 cm-1 with dc conductivity and find the following interesting feature (see Fig. 3). RT conductivity data clearly show how the metallic-like character of charge transport in ( is close to ) gradually deteriorates with ( values differ from ) and becomes typical for dielectrics for and 5.2. It is hard to quantify where this change starts since for and 1.6 the highest temperatures at which was measured were 210 K and 250 K, respectively,Borisnote so that actual RT are higher than those shown in Fig. 3. Taking this into account, the dc and ac conductivity contributions differ substantially along both orientations for , i.e. when the total hole count is smaller than four. At temperatures lower than about 200 K, reliable estimates of infrared conductivity are prevented due to either a phonon or a pinned CDW-like mode influence, so that we can only make crude estimates. However, we can say that cm ratio for all La/Y contents increases with lowering temperature, indicating the evolution of the insulating behavior.
IV Discussion
From the above analysis we conclude that the one-dimensional hopping transport along the chains for (hole-doping from zero to three injects holes uniquely into chains) crosses over into a quasi-two-dimensional charge conduction in ladders for smaller . Supports for this conjecture are: a weak and temperature-independent conductivity anisotropy (see Fig. 2) for ; a maximum in centered around 210 K (see Fig. 1) which becomes broader and flatter going from to 1.6; a smaller activation energy at high temperatures and larger at low temperatures: this difference disappears for .
These results might be attributed to the CDW, whose long-range order (with coherence length of about 260 Å) as developed in compoundAbbamonte04 is destroyed, but domains developed at short range scale still persist until . Indeed, a weak dielectric relaxation mode is detected in the radio-frequency range; it resembles a CDW loss peak. The increase of conductivity below 20 cm-1 and the considerably larger value compared to the dc conductivity infer some excitation which suggests an additional mode somewhere in the microwave range. One might be tempted to ascribe it to the pinned CDW mode, although the parameters seem to be different from those of the peak that was proposed to be the pinned mode in compound.
Further, we remind that neutron scattering and static susceptibility measurements show that with increasing from zero to one () AF dimer long-range order in chains (AF dimers separated by a site occupied by a localized hole) is also gradually destroyed.Matsuda97 ; Kato96 ; Herak In addition, NMR measurements of spin-lattice relaxation rate revealed that the spin gap associated with AF dimer order in chains persists until .Kumagai97 The latter result signals that antiferromagnetic and charge correlations for (total hole count ) are already strong enough that domains of AF dimers and related charge order (CO) form dynamically and so exist at short time scales. Concomitantly, chains cease to be a favorable charge transport channel and the beginning of hole transfer to ladders is induced. A partial hole transfer from chains into ladders starts once the total hole count becomes close to four and larger. Although probably only a tiny amount of holes is transferred to ladders for , it appears that the observed conduction with a weak and temperature-independent anisotropy happens predominantly in ladders. For it is evident that the charge transport along the chains is almost completely frozen due to rather well developed AF dimers and CO, and taken over by two-dimensional ladders in which transferred amount of holes bears a much larger mobility, yielding an important conductivity rise toward .
Our results therefore suggest that ladders at La/Y content prevail over chains as the conduction channel. A question arises why do holes, which are doped only into the chains as La/Y content is varied from to , start to be distributed between chains and ladders once their total count is larger than 4. In other words, it appears that doping more than 4 holes in the chains is energetically favorable only if at least a tiny amount of holes is concomitantly doped in the ladders. A subtle interaction between chains and ladders and stability of respective electronic phases in the charge and spin sector is already evidenced for fully doped compounds: the chain CO and AF dimer pattern on one side and ladder CDW on the other are both being suppressed at a similar rate.Kataev01 ; Vuletic06 Our results in the underdoped series follow on this idea and additionally reveal that the formation of these two distinct electronic phases is also mutually interdependent, in the sense that one cannot develop without the other.
As a final remark we note that the proposed scenario fits perfectly well to the hole distribution proposed by Nücker et al. Nuecker00 for compound, Sr14Cu24O41: close to 5 holes per formula unit in the chains and close to 1 hole per formula unit in the ladders. However, this hole distribution cannot account for the observed periodicity of CDW in ladders.Abbamonte04 Conversely, a hole distribution of close to three hole per formula unit in both ladders and chains, recently proposed by Rusydi et al.,Rusydi07 demonstrates opposite problems in explaining formation of electronic phases in the underdoped series towards fully doped systems when La/Y content decreases from to , i.e. when the total hole count increases from three to six. Namely, a gradual doping of holes from zero to three in ladders nicely explains formation of the CDW in ladders and its eventual periodicity found in compound when long-range order is developed. On the other hand, a fixed hole count in chains in the range , encounters difficulties to explain short range AF dimer and CO domains therein, which dynamically appear at and grow in size as La/Y content decreases to . It also stays in contradiction with the susceptibility results, which show that on decreasing in the range the number of spins in chains decreases, meaning a gradual increase of hole count in chains.Kato96 ; Herak Obviously, more experimental efforts are needed to clarify and reconcile these contradictory findings in order to construct a self-consistent picture of physics of chains and ladders in (La,Y)y(Sr,Ca)14-yCu24O41.
V Conclusion
In conclusion, we demonstrated the crossover from a one-dimensional hopping charge transport in the chain subsystem for to a quasi-two-dimensional charge conduction in the ladder planes for . We suggest that, while holes are doped only into the chains for low hole counts, they are distributed between chains and ladders once the total hole count exceeds four. We propose that a clue which determines the hole distribution is associated with a mutually interdependent formation of antiferromagnetic dimer and charge order in chains and charge-density wave in ladders. Our results confirm once more a profound interplay between chain and ladder sub-units, showing clearly that any decent theoretical model attempting to give a proper and self-consistent description of electronic phases in (La,Y)y(Sr,Ca)14-yCu24O41 should take this into account.
Acknowledgements
We thank G. Untereiner for the samples preparation, and M. Herak and M. Miljak for useful discussions. This work was supported by the Croatian Ministry of Science, Education and Sports under Grants No.035-0000000-2836 and 035-0352843-2844, the Deutsche Forschungsgemeinschaft (DFG), and by the Program for Fundamental Research “Problems of Radiophysics” of the Department of Physical Sciences, Russian Academy of Sciences. This work was partly supported by the 21st COE program, “High-Tech Research Center” Project for Private Universities: matching fund subsidy from MEXT (Ministry of Education, Culture, Sports, Science and Technology; 2002-2004), and a Grant-in-Aid for Scientific Research on Priority Area from the Ministry of Education, Culture, Sports, Science and Technology of Japan.
References
- (1) S. Maekawa, T. Tohyama, S. E. Barnes, S. Ishihara, W. Koshibae, and G. Khaliullin, Physics of Transition Metal Oxides, Springer, Berlin (2004).
- (2) T. Vuletić, B. Korin-Hamzić, T. Ivek, S. Tomić, B. Gorshunov, M. Dressel, and J. Akimitsu, Phys. Rep. 428, 169 (2006).
- (3) M. Uehara, T. Nagata, J. Akimitsu, H. Takahashi, N. Môri, and K. Kinoshita, J. Phys. Soc. Jpn 65, 2764 (1996).
- (4) B. Gorshunov, P. Haas, T. Rõõm, M. Dressel, T. Vuletić, B. Korin-Hamzić, S. Tomić, J. Akimitsu, and T. Nagata, Phys. Rev. B 66, 060508(R) (2002).
- (5) G. Blumberg, P. Littlewood, A. Gozar, B. S. Dennis, N. Motoyama, H. Eisaki, and S. Uchida, Science 297, 584 (2002).
- (6) P. Abbamonte, G. Blumberg, A. Rusydi, A. Gozar, P. G. Evans, T. Siegrist, L. Venema, H. Eisaki, E. D. Isaacs, and G. A. Sawatzky, Nature 431, 1078 (2004).
- (7) K. I. Kumagai, S. Tsuji, M. Kato, and Y. Koike, Phys. Rev. Lett. 78, 1992 (1997).
- (8) T. Vuletić, B. Korin-Hamzić, S. Tomić, B. Gorshunov, P. Haas, T. Rõõm, M. Dressel, J. Akimitsu, T. Sasaki, and T. Nagata, Phys. Rev. Lett. 90, 257002 (2003).
- (9) A. Rusydi, P. Abbamonte, H. Eisaki, Y. Fujimaki, G. Blumberg, S. Uchida, and G. A. Sawatzky, Phys. Rev. Lett. 97, 016403 (2006).
- (10) Y. Piskunov, D. Jérome, P. Auban-Senzier, P. Wzietek, C. Bourbonnais, U. Ammerahl, G. Dhalenne, and A. Revcolevschi, Eur. Phys. J. B 24, 443 (2001).
- (11) T. Nagata, M. Uehara, J. Goto, J. Akimitsu, N. Motoyama, H. Eisaki, S. Uchida, H. Takahashi, T. Nakanishi, and N. Môri, Phys. Rev. Lett. 81, 1090 (1998).
- (12) N. Fujiwara, N. Môri, Y. Uwatoko, T. Matsumoto, N. Motoyama, and S. Uchida, Phys. Rev. Lett. 90, 137001 (2003).
- (13) Y. Piskunov, D. Jérome, P. Auban-Senzier, P. Wzietek, and A. Yakubovsky, Phys. Rev. B 69, 014510 (2004).
- (14) N. Nücker, M. Merz, C. A. Kuntscher, S. Gerhold, S. Schuppler, R. Neudert, M. S. Golden, J. Fink, D. Schild, S. Stadler, V. Chakarian, J. Freeland, Y. U. Idzerda, K. Conder, M. Uehara, T. Nagata, J. Goto, J. Akimitsu, N. Motoyama, H. Eisaki, S. Uchida, U. Ammerahl, and A. Revcolevschi, Phys. Rev. B 62, 14384 (2000).
- (15) A. Rusydi, M. Berciu, P. Abbamonte, S. Smadici, H. Eisaki, Y. Fujimaki, S. Uchida, M. Rübhausen, and G. A. Sawatzky, Phys. Rev. B 75, 104510 (2007).
- (16) T. Vuletić, T. Ivek, B. Korin-Hamzić, S. Tomić, B. Gorshunov, P. Haas, M. Dressel, J. Akimitsu, T. Sasaki, and T. Nagata, Phys. Rev. B 71, 012508 (2005).
- (17) M. Matsuda and K. Katsumata, Phys. Rev. B 53, 12201 (1996).
- (18) M. Matsuda, K. Katsumata, T. Yokoo, S. M. Shapiro, G. Shirane, Phys. Rev. B 54, R15626 (1996).
- (19) M. Takigawa, N. Motoyama, H. Eisaki, and S. Uchida, Phys. Rev. B 57, 1124 (1998).
- (20) L. P. Regnault, J. P. Boucher, H. Moudden, J. E. Lorenzo, A. Hiess, U. Ammerahl, G. Dhalenne, A. Revcolevschi, Phys. Rev. B 59, 1055 (1999).
- (21) The main condition to establish AF dimer + CO is that the number of holes in the chains per formula unit is close to six. This requirement is satisfied according to Ref. Nuecker00, , while it cannot be reconciled with the hole distribution suggested in Ref. Rusydi07, .
- (22) T. Vuletić, B. Korin-Hamzić, S. Tomić, B. Gorshunov, P. Haas, M. Dressel, J. Akimitsu, T. Sasaki, and T. Nagata, Phys. Rev. B 67, 184521 (2003).
- (23) T. Vuletić, T. Ivek, B. Korin-Hamzić, S. Tomić, B. Gorshunov, M. Dressel, C. Hess, B. Büchner, and J. Akimitsu, J. Phys. IV France 131, 299 (2005).
- (24) http://www.ccp14.ac.uk/tutorial/lmgp/orientexpress.htm
- (25) M. Pinterić, T. Vuletić, S. Tomić, and J. U. von Schütz, Eur. Phys. J. B 22, 335 (2001).
- (26) B. Gorshunov, A. Volkov, I. Spektor, A. Prokhorov, A. Mukhin, M. Dressel, S. Uchida, and A. Loidl, Int. J. Infrared and Millimeter Waves 26, 1217 (2005).
- (27) The measurement of ac conductivity for y = 0.55 and 1.6 was done at 250 K and 200 K, respectively, due to too high conductivity values causing too low transmittivity of prepared plane-parallel samples.
- (28) While Drude response is clearly visible at RT for , and , , it is masked by the phonon tail for , .
- (29) We remind that only at low temperatures one standardly expects that due to frozen charge carriers a low-energy phonon contribution prevails over electronic hopping.
- (30) M. Matsuda, K. Katsumata, T. Osafune, N. Motoyama, H. Eisaki, S. Uchida, T. Yokoo, S. M. Shapiro, G. Shirane, J. L. Zarestky, Phys. Rev. B 56, 14499 (1997).
- (31) M. Kato, T. Adachi, and Y. Koike, Physica C 265 107 (1996).
- (32) M. Herak, M. Miljak, unpublished.
- (33) V. Kataev, K. Y. Choi, M. Grüninger, U. Ammerahl, B. Büchner, A. Freimuth, A. Revcolevschi, Phys. Rev. B 64, 104422 (2001).
- (34) H. Kitano, R. Isobe, T. Hanaguri, A. Maeda, N. Motoyama, M. Takaba, K. Kojima, H. Eisaki, S. Uchida, Europhys. Lett. 56 434 (2001).