STAR Collaboration
Charge Independent(CI) and Charge Dependent(CD) correlations as a function of Centrality formed from Charged Pair Correlations in Minimum Bias Au+Au Collisions at 200 GeV
Abstract
We report high precision charged-particle pair (2-D) correlation analyses in the space of (azimuth) and (pseudorapidity), for minimum bias Au + Au collisions at = 200 GeV as a function of centrality (0-80%). The intermediate transverse momenta region chosen GeV/c corresponds to an emission source size fm obtained from HBT measurements and should resolve substructures at the scale of fm. The difference and the sum of unlike-sign and like-sign charged pairs form Charge Dependent (CD) correlations and Charge Independent (CI) correlations respectively. The CD displays the initial correlation at hadronization of the opposite sign pairs emitted from the same space-time region as modified by further medium interactions before kinetic freeze-out. Our analysis of the CD correlations shows approximately jet-like structure, independent of centrality and is consistent with the initial correlation which is predicted by Pythia (or HIJING) jets. The CI correlation displays the average structure of the correlated emitting sources after kinetic freeze-out. For the most central bins, the width of the CI correlation on the near side ( around ) is elongated by a factor 3 destroying the jet-like symmetry. This elongation decreases continually with decreasing centrality and essentially restores the jet-like symmetric structure in the most peripheral bins. The Pythia and HIJING event generators together with a QCD inspired Parton Bubble Model (PBM), which motivated this analysis, are used to compare to our data. We discuss the arguments for substructure, surface emission, and opacity in the central fireball region.
pacs:
25.75.Gz, 12.38.MhI introduction
The Search for a Quark-Gluon Plasma (QGP) whitepaper ; QuarkM has been a high priority task at the Relativistic Heavy Ion Collider, RHIC RHIC . Central Au + Au collisions at RHIC exceed transenergy the initial energy density that is predicted by lattice Quantum Chromodynamics (QCD) to be sufficient for production of QGP LQCD . Observations of substructure have historically played an important role in advancing scientific progress in nuclear and particle physics. Correlations are a powerful tool in the search for substructures. The correlations generated by particle pairs (e.g. HBT ; mikhail ; aya ; centralproduction ) have been investigated. For central Au + Au collisions one might expect particle pair correlations to be reduced by thermalization. However, correlations could come from two possible sources. One source could be detectable correlations from substructures which form on the surface of the fireball at kinetic freeze-out PBM ; themodel ; VanHove ; LL . The other is correlations from initial hard scatterings that have only been modified by interactions with the medium of the fireball interior but not destroyed aya 111There are different types of models employed. Various models are discussed and comparisons with analyses are made in Section VI.
In this paper we analyze the Charge Independent (CI) and Charge Dependent (CD) correlations in the two dimensional space — and — of charged pairs resulting from minimum bias Au + Au collisions at = 200 GeV. The correlations were formed by particles in the intermediate range 0.8 4.0 GeV/c. The two types of charge pairs are the unlike-sign (US) and the like-sign (LS). The total correlations which are physically significant are CI = US + LS and CD = US - LS (Section IV and VI). If the background (equation 2 of Section III C) is subtracted from these correlations we obtain the corresponding signal correlations (CI signal and CD signal).
We have performed the present analyses using a model independent method so that these intermediate range correlation results can be theoretically analyzed in any way. However, in order to extract the signals we are interested in, we assume that the background is composed of known, expected, and instrumental effects. This does introduce some model dependence in the signal determined by subtracting the background from the total correlation to the extent of inaccuracies of the background. However, the robustness and characteristics of the signals obtained by this method imply that these signals are reasonably accurate. One should note that in comparing with theoretical models (Section VI) we use total correlations in the model and data analysis to eliminate any model dependence due to the separation of signals and background.
In this paper we present an analysis of charged particle pair correlations in two dimensions — and — based on 13.5 million minimum bias Au + Au events observed in the STAR detector at = 200 GeV STARTPC 222 and . One should note that only the minimum bias trigger was used.
The paper analyzes independently the correlations in each of the STAR minimum bias centrality bins from 0 to 80% minbias and then makes comparisons with quantitative models and draws conclusions. The data analysis is very similar to that used in Ref. centralproduction ; the differences will be discussed. Data cuts were applied to make track merging effects, HBT correlations, and Coulomb effects negligible.
The analysis leads to a multi-term correlation function similar to that of equations (3 + 4 + 5) of Section III C and E of Ref. centralproduction . This multi-term function fits the distribution well. It includes terms describing correlations known to be present: collective flow, momentum and charge conservation, and instrumental effects (equation (1) Section III C). The sum of these terms are considered background defined as Bk in equation (2) (Section III A-C). What remains are correlations which we assume to represent our signals; equations (3) and (4) Section III E. Their robustness, characteristics and significance in the fits are clearly consistent with their being signals in the unlike-sign charge pairs (US) and like-sign charge pairs (LS). Without the signal terms the fits to our data are highly rejected, but with the addition of the signal terms the data are well fit with reasonable parameterizations of the signals such as discussed in Ref. centralproduction .
This paper is organized as follows:
Section II describes data utilized and method of data analysis. Section III describes parameterization of the data. Section IV discusses the CI and CD signals and has a comparison with other data. Section V discusses systematic, parameter, and fit errors. Section VI contains a discussion and comparison with models. Section VII contains Summary and Conclusions. The last section is an Appendix A which contains parameters of the fits as a function of centrality percentage.
II Data Analysis
II.1 Data Utilized
The data reported here is from STAR events taken at RHIC during the 2004 running period for Au + Au collisions at = 200 GeV. The data were taken using a minimum bias trigger with the full STAR magnetic field (0.5 Tesla).
The experimental arrangement is very similar to that described in Ref. centralproduction . The data analysis and parameterization methods used previously for the most central (approximately 0-10%) centrality region were employed with slight modification. The same parameterization was successfully used in each of the 9 centrality bins in this analysis. These parameters (see Section III and Appendix A) were independently fit in each of the nine centrality bins.
About half the data were taken with the magnetic field parallel to the beam axis direction (z) and the other half in the reverse field direction in order to determine if directional biases are present. The procedure described later in this subsection for our analyses demonstrated there was no evidence of any difference in the data samples from the two field directions: the distribution of the difference of the two field directions in the and bins were consistent with a normal distribution expected for the Degrees of Freedom (DOF). There was no evidence for directional biases.
The track reconstruction for each field direction was done using the same reconstruction program. Events used in the analysis were required to have at least 14 primary tracks lying inside . Tracks that we use are required to have at least 23 hits in the TPC (which for STAR eliminates split tracks), and have pseudo-rapidity, , between -1 and 1. These are tracks that are consistent with the criteria that they are produced by a Au + Au interaction. The surviving events totaled 7.6 million for the forward field and 5.9 million for the reverse field. The transverse momentum selection GeV/c was then applied. The upper limit of centralproduction was raised to 4 GeV/c since, as discussed in PBM (Section 1, last paragraph) jet contamination is negligible if you use minimum bias data without a jet trigger.
Each of the nine centrality bins was treated separately and fit separately. In each centrality bin the event records were sorted according to the z (collider axis) position of the primary vertex into ten 5 cm wide bins along z from -25 cm to +25 cm relative to the center of the STAR TPC. This produced ten files for each sign of the magnetic field in each centrality bin. The events for the same bin, thus the same acceptance, were then merged to produce 20 files, one for each z vertex bin, for each sign of the magnetic field.
The files were analyzed in two-dimensional (2-D) histograms of the difference in (), and the difference in () for all the track pairs in each event. Each 2-D histogram for each centrality bin had 72 bins () from to and 38 bins (0.1) from -1.9 to 1.9. The sign of the difference variable was chosen by labeling the positive charged track as the first of the pair for the unlike-sign charge pairs, and the larger track as the first for the like-sign charge pairs. Our labeling of the order of the tracks in a pair allows us to range over four - quadrants, and to investigate possible asymmetric systematic errors due to geometry, magnetic field direction, behavior of opposite charge tracks, and dependence. Our consistently satisfactory results for our extensive tests of the data for these quadrants revealed no evidence for such effects.
Then we compared the - data for the two field directions on a bin by bin basis. In the reverse field data, we reversed the track curvature due to the change in the field direction, and changed the sign of the z axis making the magnetic field be in the same direction as the positive z direction. This is done by reflecting along the z axis, and simultaneously reflecting along the y axis. In the two dimensional - space this transformation is equivalent to a reflection in and . For each pair we changed the sign of its and in the reverse field data. We then calculated a based on the difference between the forward field and the reverse field, summing over the - histograms divided by the errors added in quadrature. The distribution of the difference of the two field directions in the and bins was consistent with a normal distribution for random fluctuations of a statistical nature. Therefore considering the above clear justification we added the data for the two field directions in each centrality bin.
We compared the central z vertex bins with the outer z vertex bins in each individual centrality bin. We found no evidence of differences. Therefore we added the files for those 10 bins in each centrality bin.
II.2 Analysis Method
Separate - histograms were made in each centrality bin for the two basic pair types unlike-sign charge pairs (US) and like-sign charge pairs (LS) from the same-event-pairs, since their characteristics were different. Both histograms are needed later to determine the CD and the CI correlations. Similar histograms were made with each track paired with tracks from a different event (mixed-event-pairs), adjacent in time, from the same z vertex bin and thus the same acceptance. This allows use of the technique of dividing the histograms of the same-events-pairs by the histograms of the mixed-events-pairs which strongly suppresses instrumental effects such as acceptance etc., but leaves small residual effects.
The resulting 2-D total correlation function is defined by
where is the number of pairs at the corresponding values of coming from the same event after having summed over all the events. is the number of pairs at the corresponding values of coming from the mixed events after we have summed over all our mixed events. is constructed separately for US and LS pairs and each is normalized to a mean of 1.
The symmetries in the data allowed us to fold all four - quadrants into the one quadrant where both and were positive. After the cuts described later in this subsection, we compared the unfolded bins to the folded average for unlike-sign charge pairs and like-sign charge pairs separately. The folded and unfolded distributions were statistically consistent. We searched in a number of ways to find asymmetries in the data via extensive analyses and observation of fit behavior; none of any significance were found. By folding four quadrants into one we quadrupled the statistics in each bin analyzed.
Henceforth the folded data will be used for our fits which increases our statistics per bin by a factor of 4. We used the same method of as described in Ref. centralproduction Section II C to eliminate bins which exhibited non-negligible track merging effects. At small and (i.e. small space angles) track merging effects occur. To determine the cuts needed to reduce these effects to a negligible level, we varied small and small cuts. Simultaneously the of an approximate fit to the data using equations (2) + (3) + (4) (see Sections III) was studied as a function of the bins included in the fit. With larger cuts the behaved properly until one or more of the bins affected by merging was included in the fit. This caused a huge increase in , revealing that those bin(s) were distorted. We confirmed by visual inspection that track merging clearly became important in the bins eliminated which caused a substantial reduction in track recognition efficiency. The resultant cuts also made the HBT and the Coulomb effects negligible. The required removal of bins was made by the following cuts:
For the unlike-sign charge pairs (US) 0.0 0.1 and , and 0.1 0.2 and were eliminated.
For the like-sign charge pairs (LS) 0.0 0.2 and were eliminated.
The track topology differs for US and LS pairs due to their different curvatures in the magnetic field. The two tracks in the unlike-sign charge pairs curve in opposite directions while for the like-sign charge pairs the two tracks curve in the same direction. This makes the merging characteristics different and requires the cuts to be different in order to make the track merging effects negligible.
The fits to the data were made over the whole and ranges except for the above cuts. The data for 1.5 were cut out of the fits, since statistics were low and variations in efficiency are large. However the fits create an extrapolation for small and bins where we have cut and thus correct the fits for the loss of the cut-out small angle bins.
III Parameterization of data.
We wanted to obtain a set of functions which will fit the data well and are interpretable to the extent practical. We utilized parameterizations representing known, expected physics, or attributable to instrumentation (or other non relevant to this analysis) effects. Any remaining terms required to obtain good fits to the data can be considered as signals of new physical effects. Thus signal data - (known and expected) effects. For the three known effects (elliptic flow, residual instrumental effects, momentum and charge conservation) appropriate terms were parameterized. We then found parameters for the signal terms which are necessary in order to achieve a good fit to our high statistical precision data.
III.1 Parameters Related to Elliptic Flow
The parameters related to elliptic flow flow were represented by the usual large term . We also needed a term in order to obtain good fits in our intermediate range.
III.2 Instrumental Effects
There is a independent effect which we attribute to losses in the larger tracking in the TPC and perhaps part of a long range correlation which is of no interest to this analysis and cannot be analyzed in detail because of the smallness of the effect. We utilized mixed-event-pairs with a similar -vertex to take into account these effects. Imperfections in this procedure leave a small depression near larger to be represented in the fit by a Gaussian term labeled “etabump amp” and “etabump width”. The width of this effect should be independent of the charge of the tracks, so we constrained it to be the same for like and unlike-sign charge pairs to improve the fit stability. We found that choosing a fixed center of 1.25 and a fixed width of 1.57 for all centrality bins was adequate. However the amplitude was allowed to vary. Thus the functional form for this effect (which was treated as a background) is:
| (1) |
The residual sector effects due to the lack of readout in the boundary regions (gaps between the 12 readout sectors) clearly needed corrections for the 2001 data utilized in Ref. centralproduction . However in this analysis the division by mixed pairs was sufficient to make them negligible. This was due to the fact that in the 2004 run, the data were corrected for the space charge event by event. We had attributed the need for residual sector corrections in the 2001 run to space charge effects centralproduction .
III.3 Correlations associated with Momentum and Charge Conservation
It is important to ensure that momentum and charge conservation correlation requirements are satisfied. For random emission of single particles with transverse momentum conservation globally imposed, a negative () term alone can represent this effect since random emission of single particles results in no correlations between them. It has been shown borghini that the () term alone is correct for conserving transverse momentum when there are no other correlations present. However, the complex correlations that occur at RHIC result from multiple sources which are presently not understood. It was not possible to fit our data with the () term alone. Fits were rejected by or greater for both the unlike-sign charge pairs and like-sign charge pairs in the 0-50% centrality region. This was not surprising since random emission of single particles with transverse momentum conservation would not lead to the particle correlations observed at RHIC. Therefore we suspected that a more complete description of momentum and charge conservation was required. No one has succeeded in solving this complex problem in closed form even in the theoretical case where you observe all particles. It appears that a solution to this problem would require a knowledge of all the correlations present in a particular analysis and this is not attainable in practice. Hence a reasonable approach was to try to solve it for the tracks we are observing in order to obtain a good fit. For the two variables we have, and , we used Fourier analysis and polynomial expansion respectively.

Assuming that the () term for random single particle emission was the first term in a Fourier expansion of odd terms, a second term (3) was added and found to account for almost all of the rejection. Based on the residual analysis we concluded the remaining few % required dependent terms for its removal in order to obtain good fits. Therefore we multiplied terms of the type () and (3) by a term which when added reduced the remaining rejection and led to good fits.
In addition we found that we needed a term in our background. Such a term was added to the background fit parameters since it is probably part of a long range correlation not relevant to this analysis.
If we take the sum of the terms described in subsections A, B and C we obtain the following for our background Bk.
III.4 Fitting with Bk
We used the well known result probability that for a large number of degrees of freedom (DOF), where the number of parameters is a small fraction of DOF and the statistics are high, the distribution is normally distributed about the DOF. The significance of the fit decreases by whenever the value of increases by which for our 521 DOF is equal to 32.
If we fit the functional form of the background Bk (equation (2)) to US in each centrality bin the fits are rejected by or greater. If we fit LS to the background Bk in each centrality bin the fits are rejected by or greater.
III.5 Signal Terms and Multiplicity Scaling
Many signal terms in physics are Gaussian-like. We therefore tried fitting the signal data using two dimensional (2-D) Gaussian or approximate Gaussian parametric forms which successfully parameterized our signals in the previous central production analyses centralproduction . The values of the signal and background (Bk) parameters in each centrality bin were independently fit for that particular centrality bin.
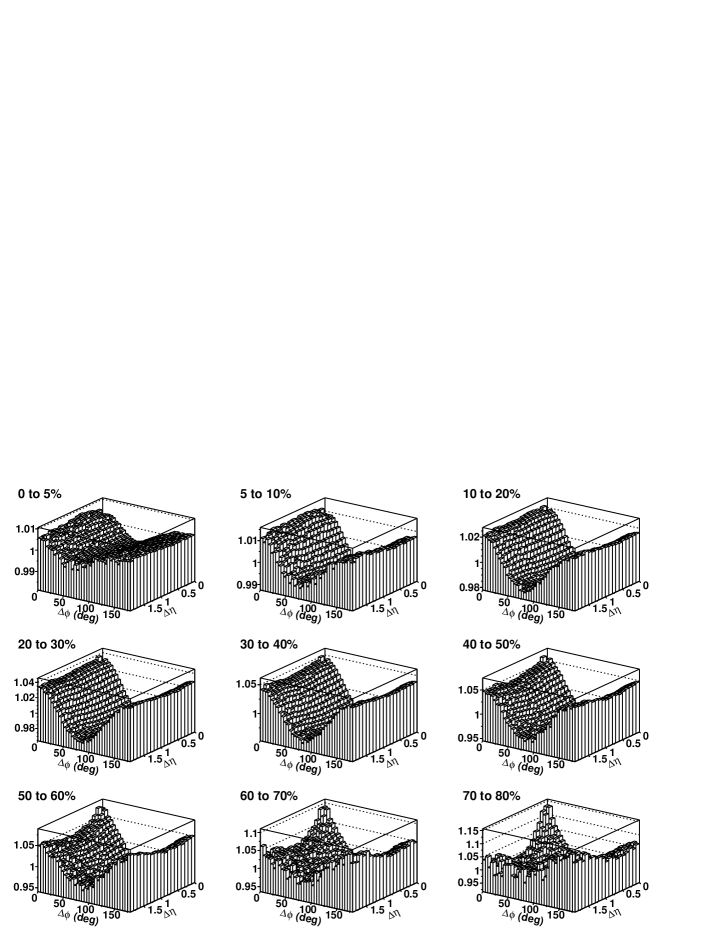
The physical characteristics of elliptic flow have been extensively investigated. They are reasonably understood and are essentially charge independent. Therefore the same large flow term was used in US and LS fits and its value determined as part of our best fit to the data set. The US in each centrality bin shown in Fig 1 were well fit (), by adding to Bk an additional 2-D approximate Gaussian in and given by:
| (3) |
Considering the enormous improvement in fit quality afforded by the addition of this signal term, we conclude that this function in equation (3) provides a compact analytic description of the signal component of the unlike-sign charged pairs correlation data. The fit was improved by the addition of a term dependent on in the exponent (called “fourth”). This was previously found to be the case in Ref. centralproduction .
Our normalization is such that the correlation is normalized to a mean of 1. When one compares different centralities the signal term is proportional to the number of correlated signal particles within our cuts. This is so since when two particles form a correlated pair they are in general not correlated with the remaining signal particles. Thus the pool of correlated particles is reduced by two every time a pair of correlated particles is picked. Hence the signal term is proportional to the number of correlated signal pairs which is 1/2 the number of signal particles within our cuts. On the other hand the number of entries to the correlation calculation grows as the number of particles squared. This quadratic increase dilutes the signal by a large factor of 1/(particles). If we multiply the signal by efficiency corrected multiplicity (column 3 table I) we cancel this dilution. For all signal comparisons as a function of centrality and comparisons with other experiments we utilize signal X multiplicity or equivalently multiplicity scaling or multiplicity scaled. The multiplicity used is the efficiency corrected multiplicity. The observed average multiplicity in the TPC and the efficiency corrected average multiplicity for each centrality is given in table I. The fits for the multiplicity scaled US signal data as a function of centrality for the folded - after - cuts data are shown in Fig. 3.
| Centrality | Average Multiplicity TPC | Corrected |
|---|---|---|
| 0 to 5% | 216 | 292 |
| 5 to 10% | 180 | 237 |
| 10 to 20% | 140 | 176 |
| 20 to 30% | 98 | 120 |
| 30 to 40% | 65.4 | 78 |
| 40 to 50% | 41.5 | 48.2 |
| 50 to 60% | 24.4 | 27.8 |
| 60 to 70% | 13.1 | 14.6 |
| 70 to 80% | 6.2 | 6.9 |
The LS data which also could not be fit by Bk alone, were well described () when we added (see Fig. 2) a positive 2-D Gaussian and a small negative 2-D Gaussian dip given by:
| (4) |
The significance of the small dip is in the 0-30% centrality region. This dip is a physical effect not due to track merging. Since gluons prefer to emit US (pairs) and suppress emission of LS (pairs) in the same phase space region we attribute the dip in the LS as likely due to this suppression. The US (pairs) do not have a dip as expected.
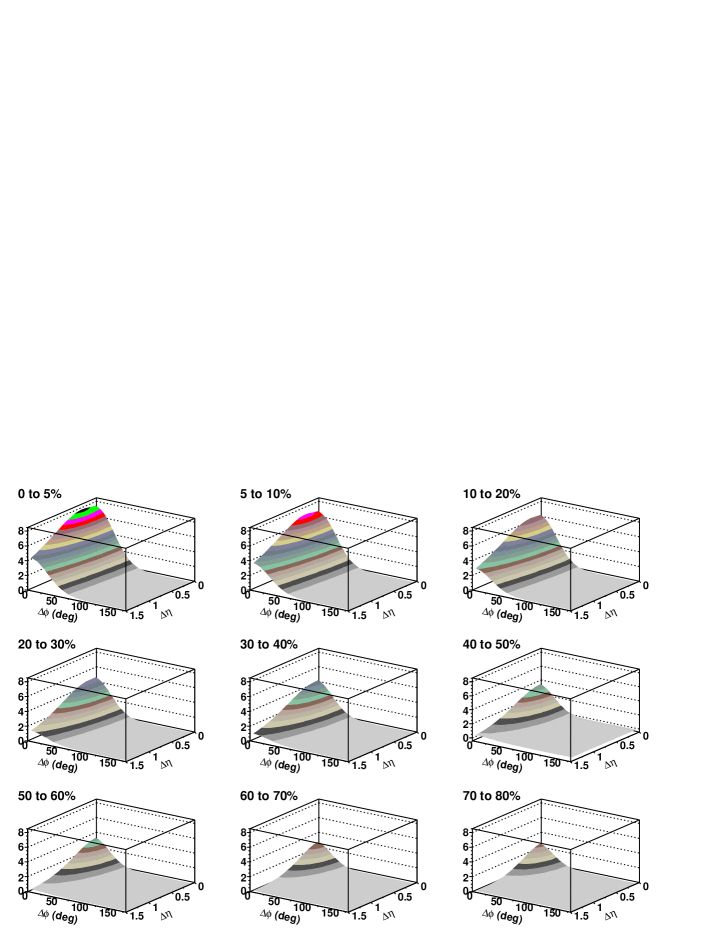
Therefore, we conclude that equation (4) provides an efficient description of the signal component of the LS data. The large signal is referred to as “lump” in the LS and is a 2-D Gaussian centered at the origin. It is accompanied by a small narrower 2-D Gaussian “dip” (also centered at the origin) subtracted from it. Fig. 4 shows a 2-D perspective plot of the multiplicity scaled LS signals (background subtracted) as a function of centrality.
All the above fits are consistent with significance of . Note that both US and LS signal fits show a elongation in the central region such that the corresponding angle is much larger than the angle. These elongations reduce as centrality decreases and virtually disappear in the peripheral region leading to approximately jet-like symmetry.
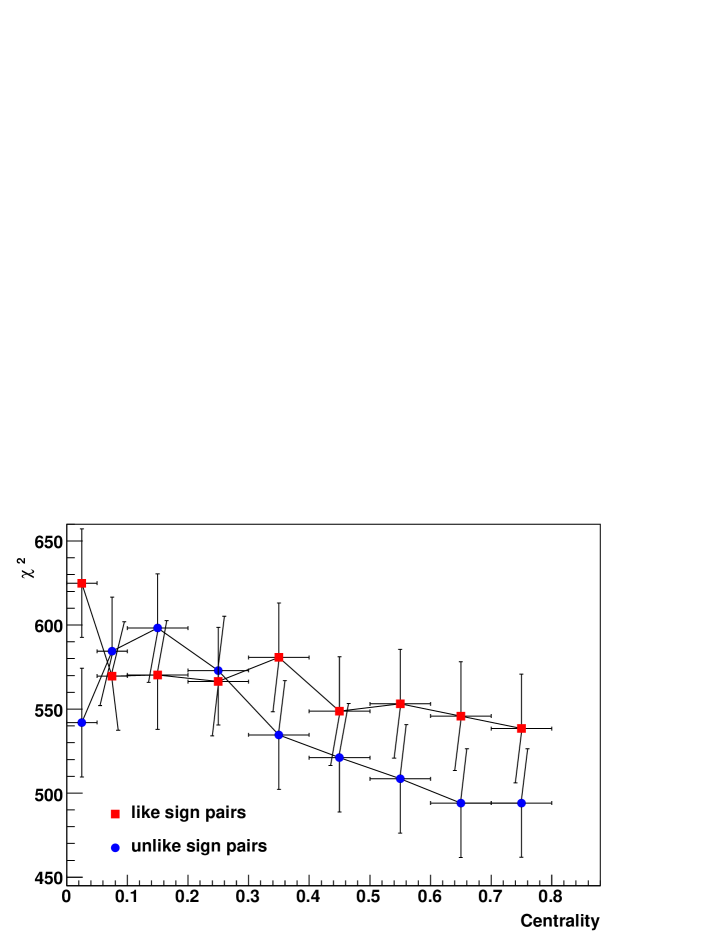
Appendix A contains the plots of the fitted parameters as a function of centrality which produce the US and the LS fits accompanied by explanatory material. The signals are to some degree model dependent because of the background (Bk) subtraction, but are robust and represent the characteristics of the underlying structures. Fig. 5 shows the dependence of as a function of centrality bin for the fits of both the US and LS. A larger value of above 521 means we have exceeded the DOF. The difference of this divided by 32 gives the number of ’s by which the value of departs (e.g. is increased) compared to an ideal fit ( = DOF). All the parameters fit together, signal plus background, represent a model independent measure of the correlation function, which can be theoretically analyzed in any way chosen.
The complex multi-dimensional surface makes the change non linearly with the number of error ranges () shown on the plots in Appendix A. Therefore, in order to determine the significance of a parameter or group of parameters one must fit without them, and determine by how many the fit has worsened. Then one uses the normal distribution curve to determine the significance of the omitted parameter(s).
IV CI and CD Signals
IV.1 Charge Independent (CI) Signals
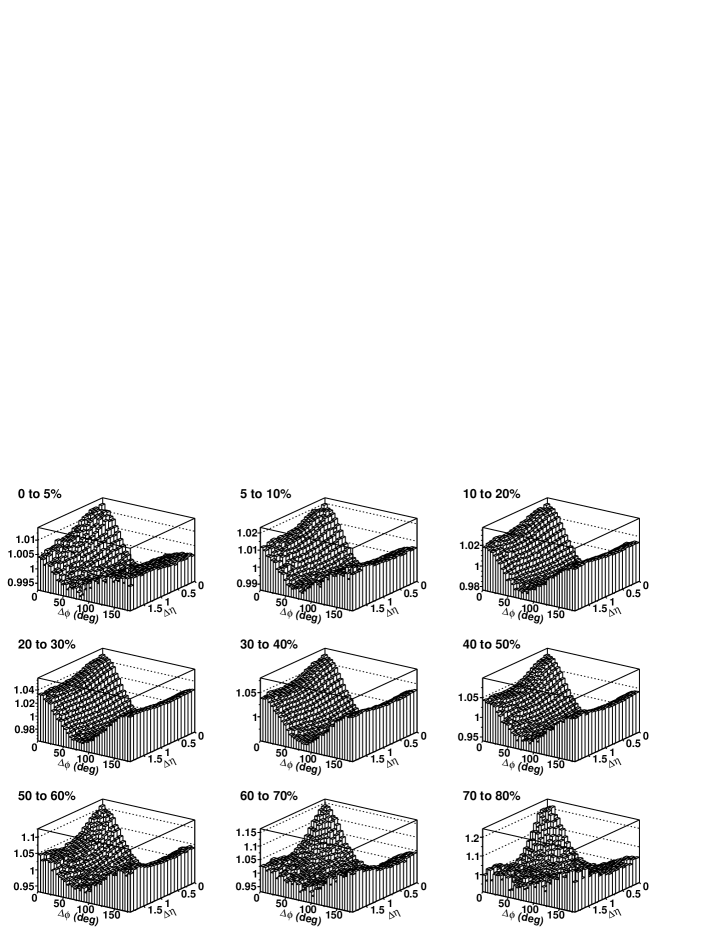
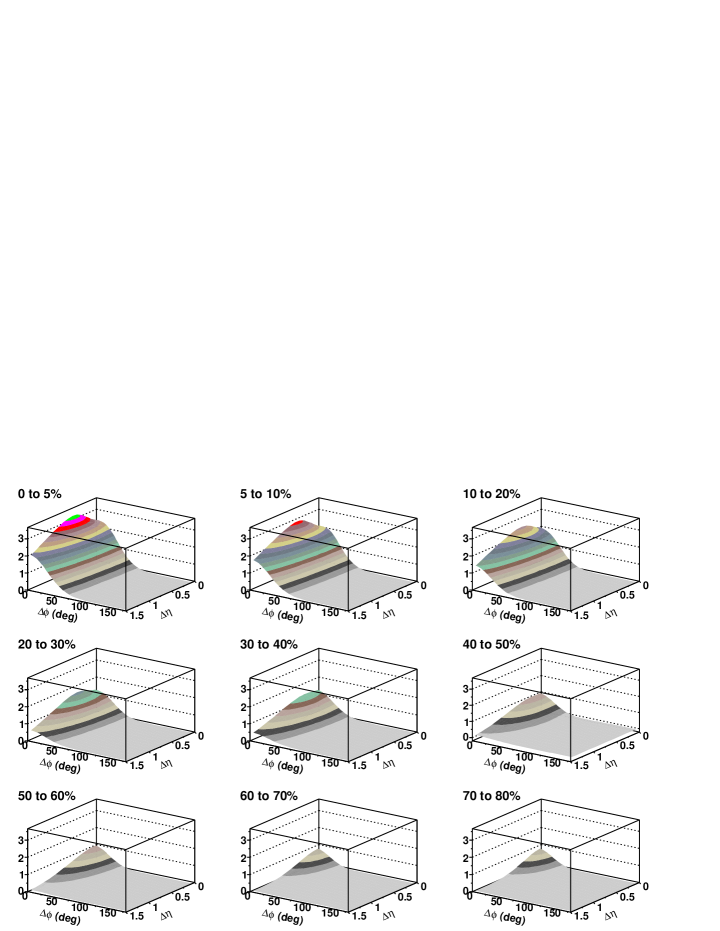
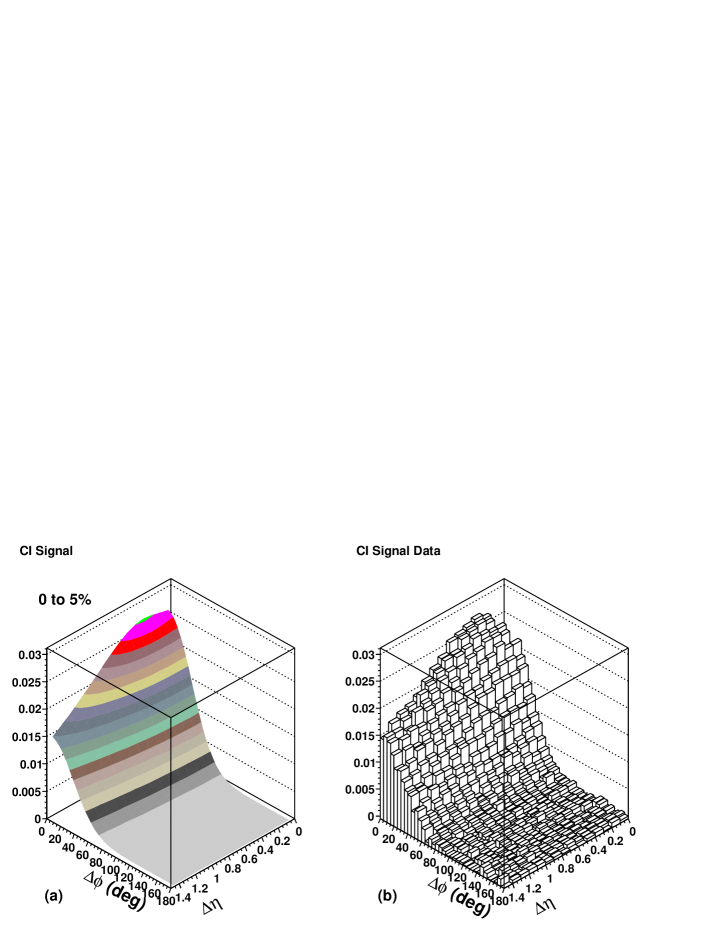
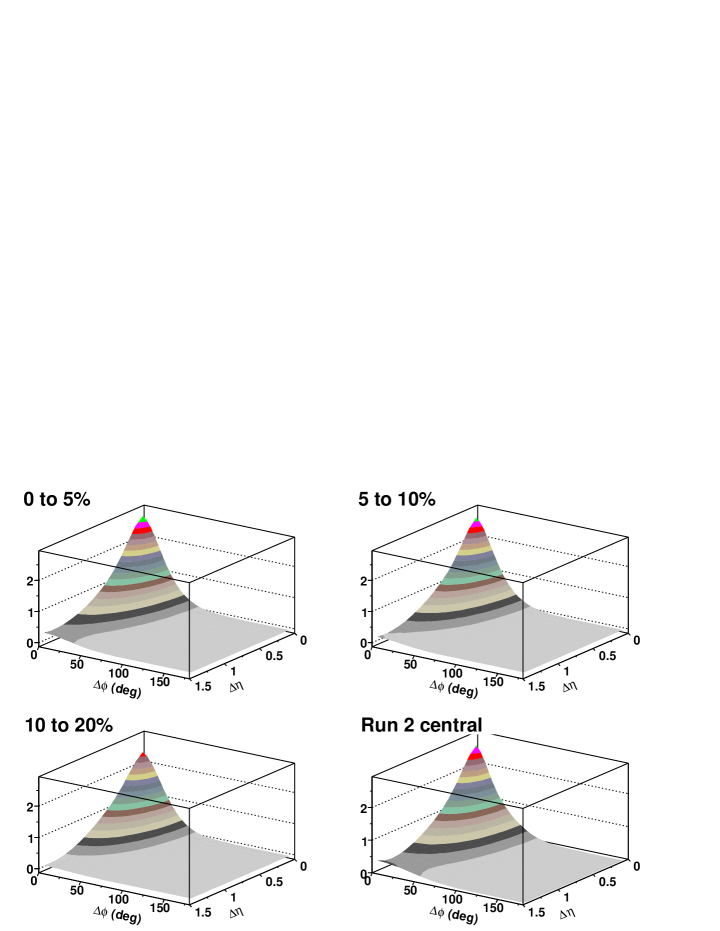
We obtain our signals by subtracting the background (Bk) given in equation (2) from the total US and LS correlations. If we add the US signal which has background subtracted to the LS signal with its background subtracted, we obtain the CI signal = US signal + LS signal. The CI signal fit and the data with background subtracted in the most central 0-5% bin that was fitted are shown as 2-D perspective plots in Fig. 6a-b. The CI signal displays the average structure of the correlated emitting sources at kinetic freeze-out. One should note the large elongation of the corresponding in the 0-5% bin was previously observed in Ref. centralproduction . The CI signal fit and the corresponding data in the most peripheral (70-80%) bin that were fit are shown as 2-D perspective plots in Fig. 7a-b. We note the large elongation has disappeared and we have approximate jet-like symmetry.
In order to compare signals in different centrality bins or to compare with different analyses we must use multiplicity scaling. In Fig. 8 we show the multiplicity scaled CI signals for all the nine centrality bins. In the 0-20% region the large elongation mostly persists. In the 20-60% region this elongation gradually decreases with the decrease in centrality. In the two most peripheral bins the elongation is gone.
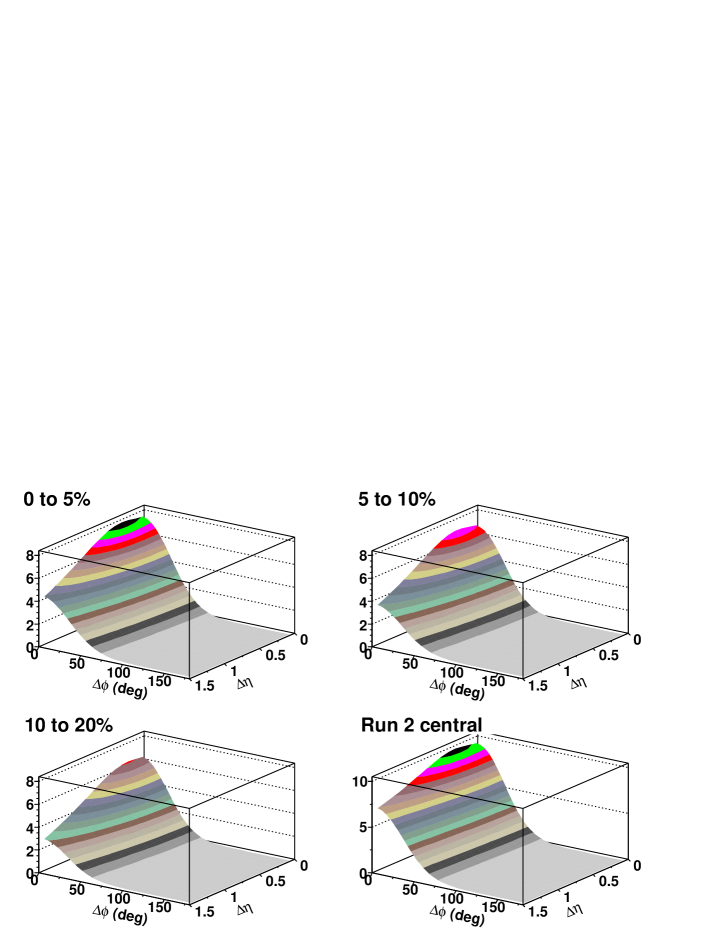
In Fig. 9 we compare the central region CI signal multiplied by multiplicity for the present 2004 minimum bias Au + Au analysis with the previous 2001 central trigger analysis. They appear quite similar and considering the differences in the analyses and the errors they agree well.
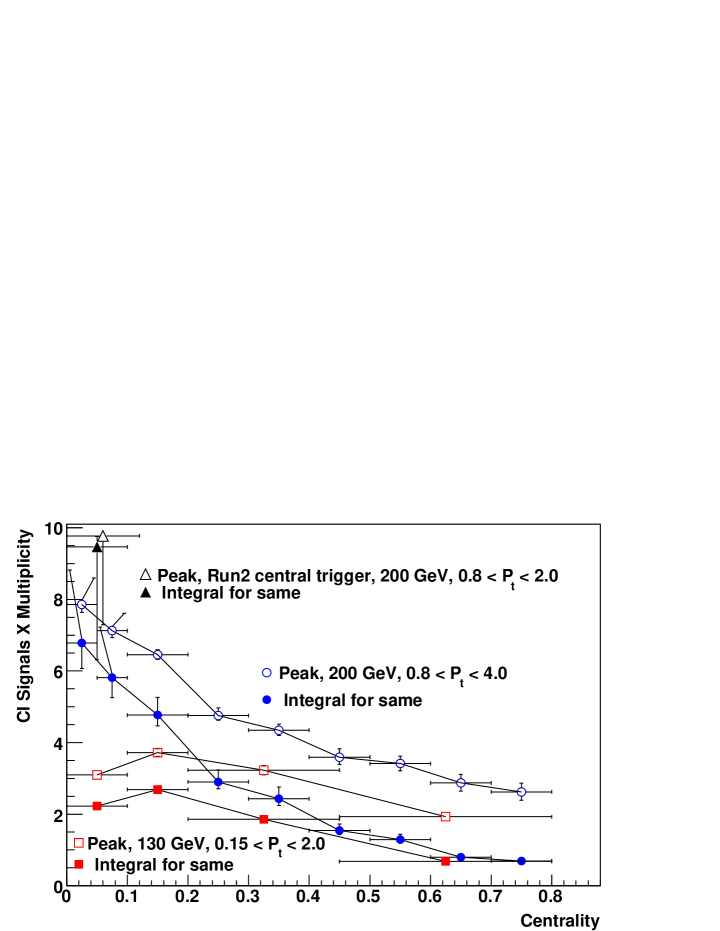
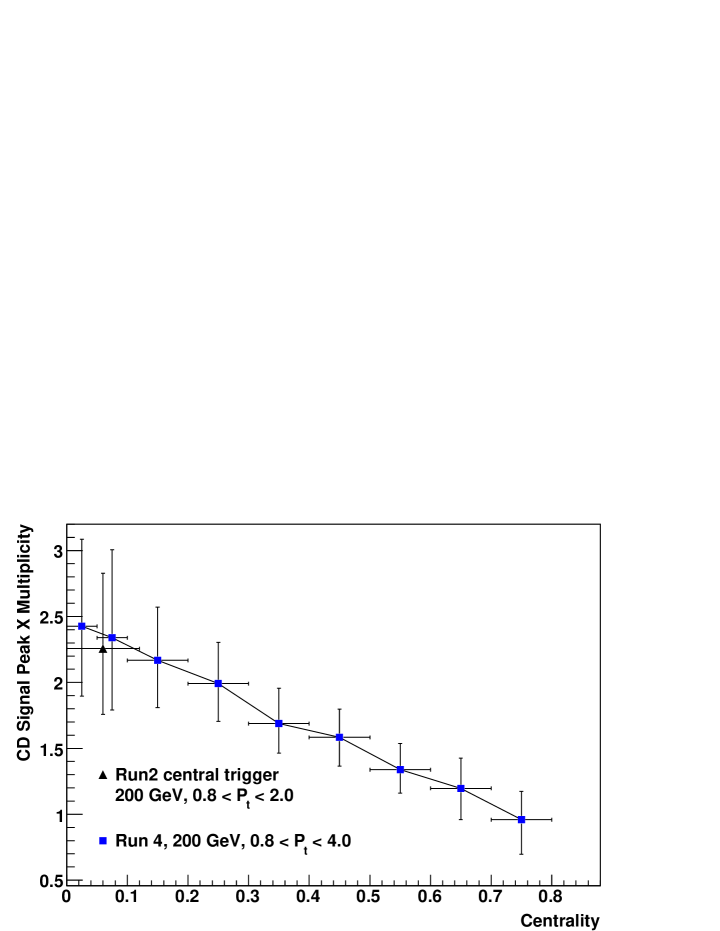
The for the fits to each CI centrality bin are consistent with a significance of or better. Fig. 10 shows the multiplicity scaled peak CI signal vs. centrality, and the integral of the multiplicity scaled CI signal vs. centrality. Both have their maximum at the most central bin, and decrease continuously by a factor of approximately 3 (amplitude) and 8 (integral) as one proceeds to their minimum values in the most peripheral bin. A comparison with the prior central trigger analysis centralproduction shows agreement within the errors in the overlap region. Also shown is a comparison with the results of a = 130 GeV analysis with a lower cut of 0.15 GeV/c aya . We attribute the observed differences, especially the dip at the most central CI bins, to the preponderance of low energy particles in that analysis.
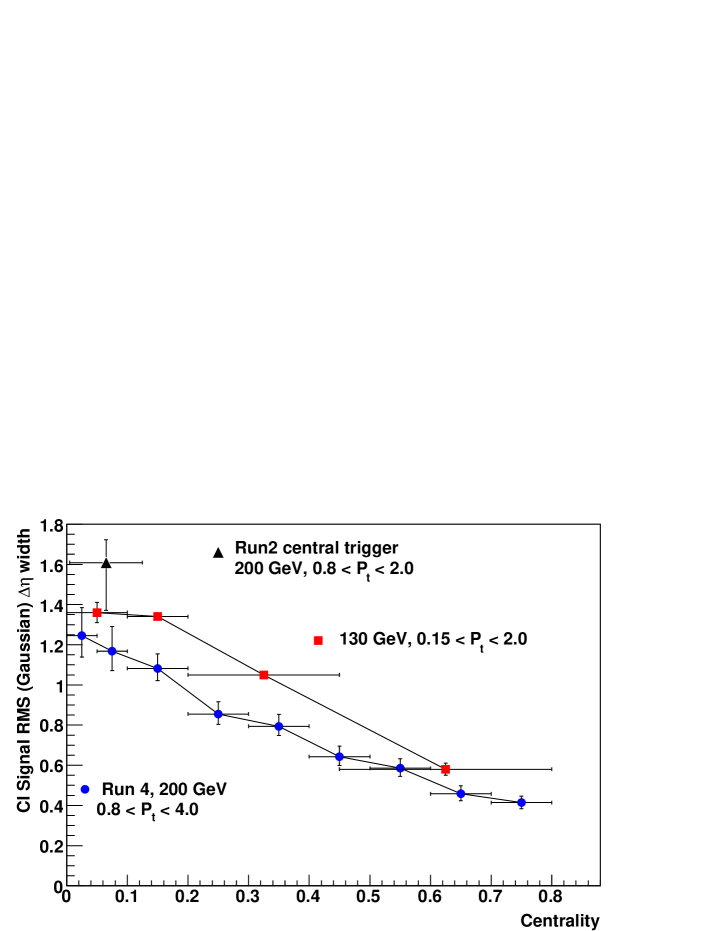
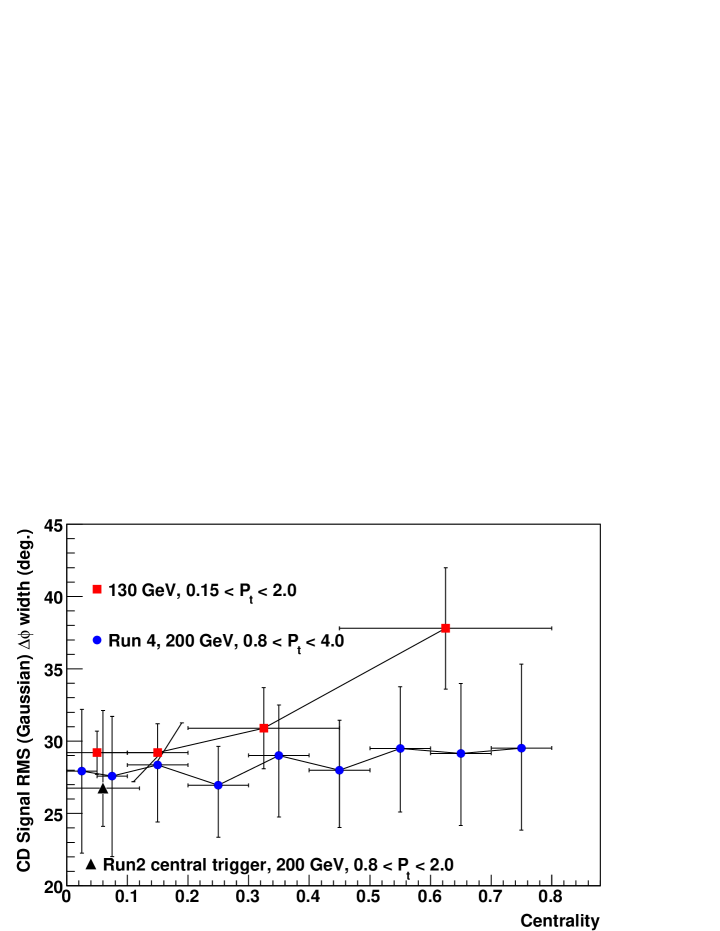
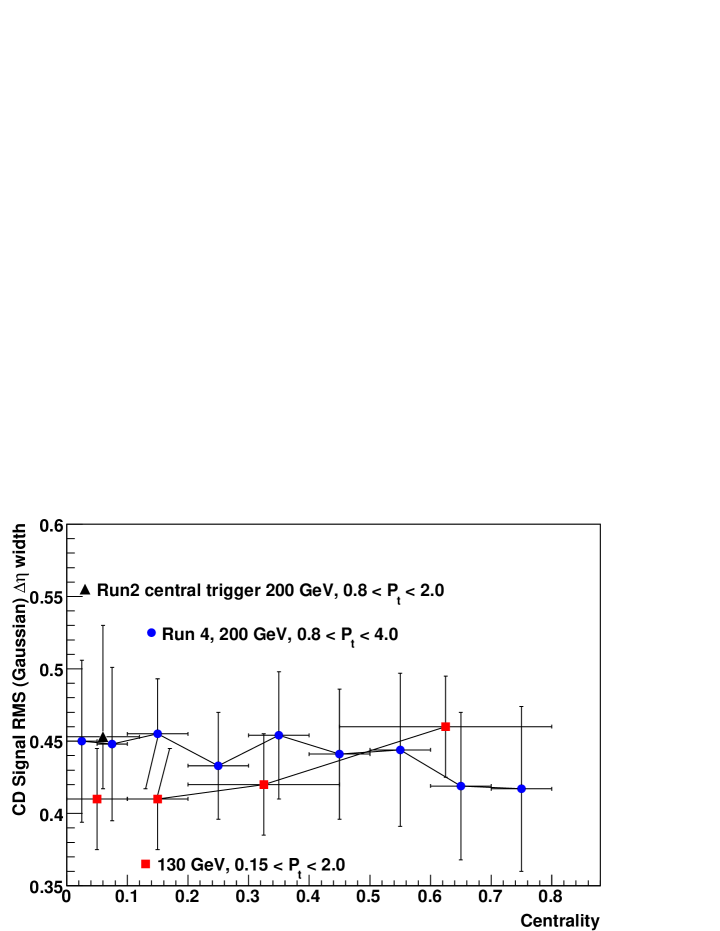
Fig. 11 shows the width as a function of centrality for the different analyses, while Fig. 12 shows the width for the same centralities. The present analysis and the central trigger prior analysis agree well. However in the 130 GeV analysis the width is decreasing with increasing centrality, while in the 200 GeV analysis the width is essentially flat within the errors. However the trend shows a modest increase with centrality. We attribute the difference in behavior to the preponderance of low energy particles in the 130 GeV analysis.
IV.2 Charge Dependent (CD) Signal
If we subtract the total LS correlation from the total US correlation we obtain the CD correlation. However, it is observed that the background (Bk) of the two terms are close enough in value within the errors to cancel each other in the subtraction. Thus the CD signal is essentially the same as the total CD correlation. The subtraction of the LS in the CD is considered equivalent to removal of the opposite sign charge pairs which are not from the same space time region centralproduction ; balfun . Therefore if no further interactions occurred after the opposite charge pairs hadronization the CD would represent the initial correlation of those opposite sign charge pairs which are emitted from the same space and time region.
The CD signal and the corresponding data in the most central bin (0-5%) are shown as 2-D perspective plots in Fig. 13a-b. The large elongation found in the CI is mostly gone in the CD most central bin, and we find close to jet-like symmetry. In the subtraction in forming the CD signals the background terms nearly cancel out leaving small residual background terms. Therefore to take into account this systematic we use a procedure described in Section V.
The CD signal and the corresponding data in the most peripheral (70-80%) bin that were fit are shown as 2-D perspective plots in Fig. 14a-b. Here we find virtually jet-like symmetry.
Fig. 15 shows the multiplicity scaled CD signal vs. centrality for all 0-80% bins. All nine plots have the same approximately jet-like shape.
Fig. 16 compares the multiplicity scaled CD signal for the present 2004 minimum bias central region (0-20%) with the 2001 STAR/RHIC central trigger analysis. They agree well.
Fig. 17 shows the multiplicity scaled CD signal peak amplitude vs. centrality. The CD signal peak amplitude shows a decreasing trend towards the most peripheral bins. A comparison with the 2001 analysis (run 2) is quite good.
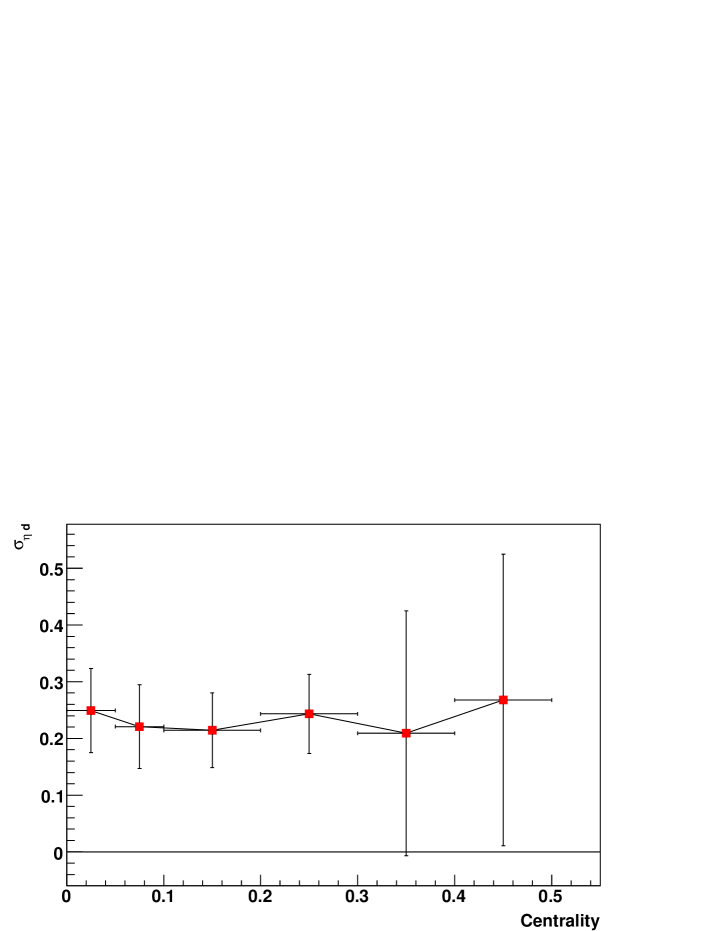
Fig. 18 shows the CD width vs. centrality. Within the errors it is independent of centrality. The comparison with the 2001 central trigger analysis is in good agreement and the 130 GeV analysis is also approximately within the errors.
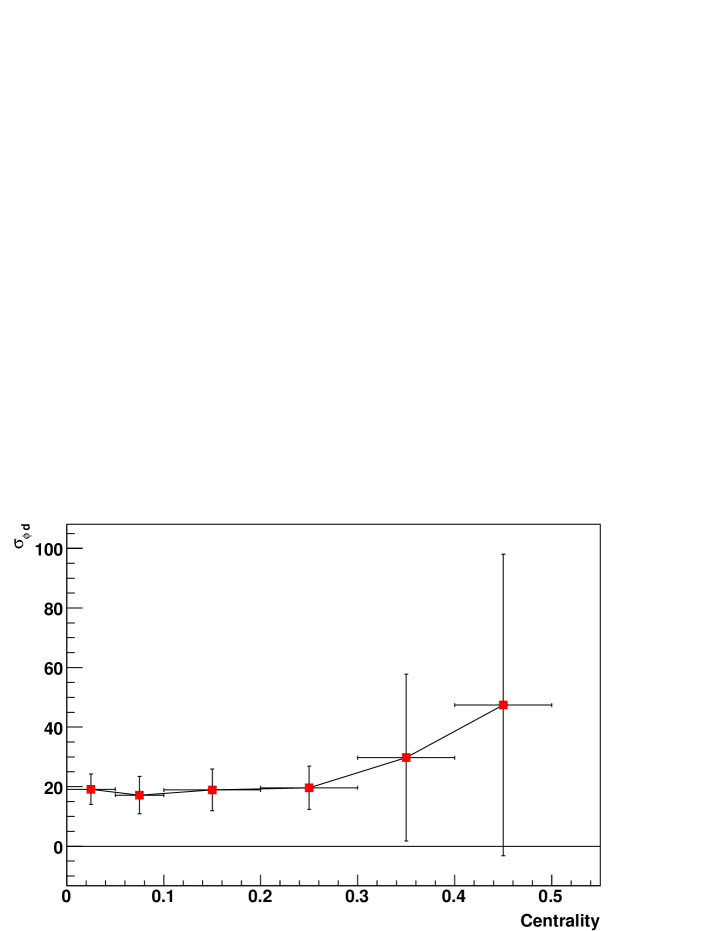
Fig. 19 shows the CD width vs. centrality. Within the errors it is independent of centrality. The comparison with the 2001 central trigger analysis is in good agreement and the 130 GeV analysis is also within the errors.
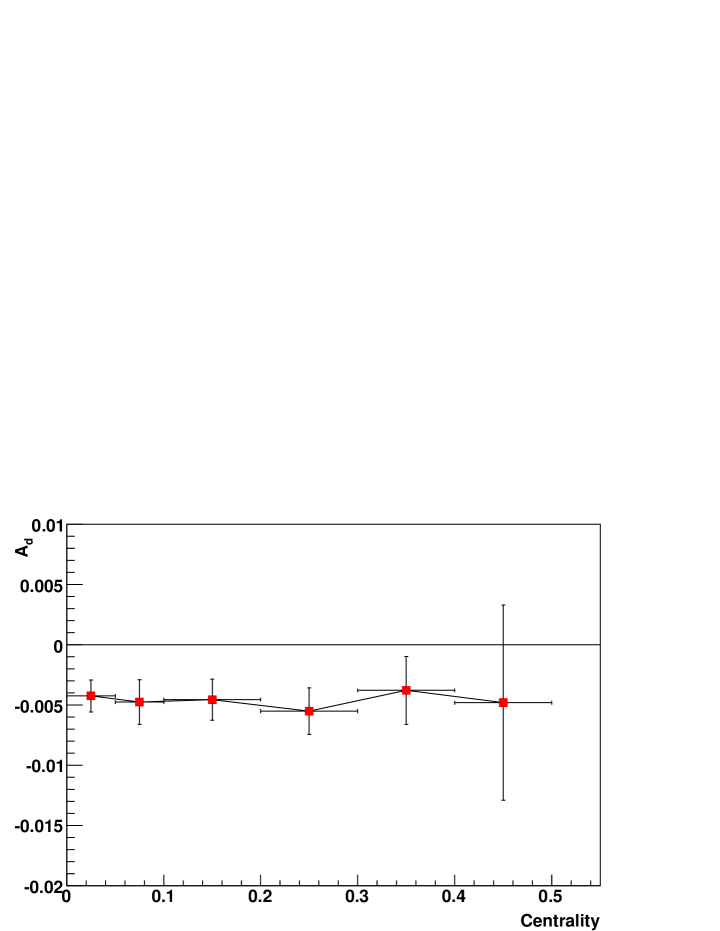
All the present analysis fits for the CD quantities as a function of centrality are consistent with significance. The CD shape parameters do not change much with centrality (Fig. 18-19), and have close to jet-like behavior.
The CD at the time of formation (hadronization) is a measure of the initial average distribution of the correlation between the US particle pairs emitted from the same space time region. This initial correlation distribution is expected to be jet-like and very similar to Pythia pythia and HIJING Wang jets. If there were appreciable interaction with the fireball medium before kinetic freeze-out the initial jet-like correlation observed would be changed. However the observed CD correlation is approximately consistent with Pythia and HIJING jet correlations at all centralities (see Fig. 18-19 and 22). Therefore we can conclude that the emitted pairs have little further interactions after hadronization. Thus surface or near surface hadronization and emission from the fireball both occur in the central region and all other centralities where there is appreciable particle density. In the most peripheral bins the particle density is low enough to allow undisturbed fragmentation and thus no change in the CD correlation. Thus the CD behavior is consistent with a surface emission model such as Ref. PBM .
V Systematic, Parameter, and Fits Errors
Systematic errors were minimized using cuts and corrections. The cuts (see Section II B) were large enough to make contributions from track merging, Coulomb, and HBT effects negligible. Systematic checks utilized analyses which verified that the analysis results did not depend on the magnetic field direction, the vertex z coordinate, or the folding procedures (see Section II ). By removing the tracks with 1.0 we keep the systematic errors of the track angles below about backbegone .
In Section IV of Ref. centralproduction we referred to a simulation in Ref. themodel which estimated that the background resonance contribution to the CD correlation cannot be more than 20% (see appendix B of Ref. centralproduction ). The conclusion was that the effect of these resonances was primarily to increase the amplitude of the CD. From the resonance calculations discussed in appendix B of Ref. centralproduction the background resonance contribution to the US correlation was estimated to be 5%. Both the Parton Bubble model PBM and HIJING Wang only have the background resonance contribution coming from the soft beam jet fragmentation. For the present range model calculations PBM ; Wang we estimated the resonance background contribution is less than 1%.
As we shall see in the next section where we discuss model fits, the data can be well fit by assuming that background resonances are negligible.
In Section VI. Systematic Errors of Ref. centralproduction we concluded based on an extensive investigation for that paper that the increase in the CI correlation width would be about 2% at most. We estimate that in the central region of the present experiment where the width elongation is large this approximately 2% estimate remains the same. As the CI elongation becomes smaller the error estimate is adequate since the CI, CD, US, and LS signals approach the same jet-like shape which has a negligible elongation. The multiplicity scaling errors are estimated to be about 2-3%.
We have used the multi-parameter fitting procedure in the large DOF region probability that we employed in Ref. centralproduction . The reader is referred to Ref. probability from which we quote: “For large n(DOF), the p.d.f. (probability density function) approaches a Gaussian with mean = n and () = 2n.” For n 50-100 this result has been considered applicable, and it remains applicable and becomes more accurate as n increases toward infinity. It is important to note that the above has been proven under the assumption that we do not know the underlying physics which is certainly the case for our analyses and almost all heavy ion analyses at RHIC or elsewhere. In the US and the LS fits (with 521 DOF) an increase in of 32 reduces the fit significance by (). The statistical significance of any data analysis fit in this paper can be obtained by the following procedure: The number of ’s of reduction of a fit significance = value of ( - DOF)/32. The number of ’s refer to the normal distribution curve and give the probability of the fit compared to an ideal fit where = DOF. For large DOF (bins - parameters) fluctuations occur because of the many bins. When one fits the parameters, they will try and describe some of these fluctuations. Therefore we need to check whether the fluctuations in the data sample are large enough to significantly distort the parameter values. This has traditionally been done by using the confidence level tables vs. which allows a reasonable determination of the fluctuations due to binning. The approximation we have used is an accurate extension of the confidence level tables for the high ( 100) DOF region we are analyzing.
Let us consider the method of assigning systematic error ranges to the parameters. Our objective is to obtain systematic error ranges which are not likely to be exceeded if future independent data samples taken under similar conditions are obtained by repetition of the experiment by STAR or others. We allow each parameter, one at a time, to be varied (increased and then decreased) in both directions while all the other parameters are free to readjust until the overall fit degrades in significance by . This corresponds to a change of of 32 for both the US and LS fits. The surface has been observed, and increases very non linearly with small increases of the parameter beyond the error ranges. Thus this is a conservative method of assigning systematic errors to the parameters determined.
The elliptic flow has a reasonably known underlying physics which is charge independent. In the case of the CD elliptic flow effects have been observed to cancel and cause negligible uncertainties. Therefore we used the same large elliptic flow () term for the US and LS fits. Thus our best fit has this same elliptic flow term in the US and LS which cancels out in the CD since it is obtained by subtraction of the LS from US correlation.
The small difference of the terms in the CD correlation constitute a background that must be determined. There are two possibilities for determining the CD signal and background. In the first we defined the CD signal as the difference between the US and the LS signals. Thus the background is the difference between the US and LS backgrounds. This subtraction gives us amplitudes and widths determined by the surface of the US and LS fits. On the other hand we could directly subtract the LS correlation from the US correlation and obtain the CD correlation, which could also be fitted by a Gaussian plus background terms. These two procedures give a very similar result indicating that the small residual background terms are not a problem. We take the average of these two methods to define the CD signal correlation amplitudes and widths. The systematic errors of these measurements are determined by exploring the surface of the direct fit of the CD signal correlation (method 2) plus the extracted measurements from the difference of the LS signal from the US signal using the surface of the US and the LS fits (method 1).
Let us now address the errors due to contamination by including secondary particles arising from weak decays and the interaction of anti-protons and other particles in the beam pipe and material near the beam pipe. These secondary particle backgrounds have been estimated to be about 10-15% starback . In this analysis we are concerned mainly with the angles of the secondary particles relative to the primaries that survive our high cut, not their identity or exact momentum magnitude. Our correlations almost entirely depend on angular measurements of and .
In the range GeV/c we have considered the behavior of weakly decaying particles and other non-primary particles which could satisfy our distance of closest approach to the primary vertex and cuts. Because high secondary particles are focused in the same direction as the primaries, only a fraction of these particles have sufficient change in angle that would cause an appreciable error in our correlations. We utilized the methods developed in Ref. centralproduction to estimate that only 1/4 of the 10-15% secondary particles satisfied our cuts and distance of closest approach. This led to our estimate that there is a systematic error of about 5% due to secondary particles which is mostly an overall scale factor.
VI Discussion and Model Fits.
VI.1 Discussion
The multiplicity scaled CI signal vs. centrality is shown in Fig. 8. as a 2-D perspective plot. The CI signal displays the average structure of the correlated emitting sources at kinetic freeze-out. We anticipate kinetic freeze-out will occur at or near the outer surface of the fireball. The CI characteristics vs. centrality are shown in Fig. 10 (signal amplitude and integral), Fig. 11 ( width), and Fig. 12 ( width).
The CI large elongation, signal amplitude, and signal integral all have their maxima in the most central bin (0-5%) and decrease with decreasing centrality. In the most peripheral bins jet-like angular symmetry is restored and HIJING Wang can be expected to fit. However the central bins strongly reject a HIJING fit due to the elongation which does not have a jet-like angular symmetry which HIJING requires. Thus only the last few peripheral bins are consistent with HIJING. HIJING can not account for the strength of the and correlations in the most central collisions see Ref. PBM .
The CI width remains approximately constant with centrality (). This implies the source we are viewing covers a fraction of the angular range at all centralities in our observed range. This was calculated in Ref. themodel and shown to be so. In our range the limited angular spread of particles in could be due to phase space focusing by flow as considered by Ref. HBT as an explanation of the HBT results. A blast wave fit including all pions gives source sizes which are consistent with the HBT results for Au + Au central collisions at = 200 GeV HBT .
In the blast wave fit used in the PBM the surface of the blast wave is moving with maximum velocity (3c/4) at kinetic freeze-out when the particles are emitted. This phase space focusing of source size in the blast wave surface with the addition of bubble substructure on or near the surface of the blast wave is used in the PBM PBM . This model assumes a bubble substructure of about a dozen similar adjoining spherical bubbles in an 8 fm radius ring at mid-rapidity, perpendicular to and centered around the beam direction, on the surface of the fireball at kinetic freeze-out. The correlation functions used in our analysis and those employed for HBT both add all the bubbles in the ring on top of each other resulting in one average bubble with a source size of 2fm radius. If we were just dealing with flow focusing we would not observe the signal correlations we find in this analysis. One needs regions that produce more particles (bubble) and other regions which produce fewer particles (background) in order to generate the observed signal correlations. In Ref. PBM a detailed QCD inspired model was developed which assumed the bubbles were composed of gluonic hot spots which appeared in the final state of the fireball evolution. The PBM reasonably quantitatively fit the CI and the CD of the prior central trigger analysis of the approximately 0-10% centrality Au + Au at = 200 GeV for the intermediate transverse momenta 0.8 2.0 GeV/c.
VI.2 Model fits for the CI
The characteristics of the present analysis discussed above suggest that the PBM could fit the two most central CI (total correlation) bins and HIJING could fit the most peripheral bins. It appears that the in between bins would require a mixture of the PBM, HIJING, and elliptic flow for a reasonable fit. Future theoretical work is expected to address fitting the in between bins.
Let us first address fitting the two CI (total correlation) most central bins (0-5% and 5-10%) with PBM and the two most peripheral bins (60-70% and 70-80%) with HIJING. For the two CI most central bins we use the Monte Carlo generated PBM events that were used in comparing with the central trigger data centralproduction . The entire CI correlation (signal + background) is used for comparing the analysis results with the model. This eliminates any model dependence on the separation of signal from background. In Ref. PBM the centrality range was 0-10%, while here we must separate the Monte Carlo sample into two pieces (0-5% and 5-10%).
The correlation derived when using all particles to form pairs regardless of their charge sign is equal to CI/2. Since our correlations are normalized to a mean of 1, plotting (CI/2 - 1) provides a more easily understood theoretical comparison in Fig. 20.
We need to use multiplicity scaling in order to compare the different centralities. This comparison was straightforward for exhibiting the 2-D fits of the CI signal vs. centrality (see Fig. 8) but becomes much harder when comparing the total scaled CI with models. For each centrality the CI/2 varies about 1.0. Since it is very hard to compare 2-D correlations we project into a 1-D presentation by dividing 1-D projections into five ranges , , , , and which cover our entire range.
Fig. 20 compares the increasing sequence to the PBM fits (lines) in the two most central bins and to the HIJING fits (dashed lines) in the two most peripheral bins. The horizontal axis is in degrees.
The comparison to HIJING jets is not shown for the two most central bins (0-5%) and (5-10%) because HIJING has a large disagreement with the data. This is due to the large observed elongation (by a factor of 3 see Section IV A) in the CI data which is not contained in HIJING jets. This contradiction of HIJING in the most central bins is shown in Fig. 17 of Ref. PBM where the centrality range is 0-10%.
The away side of the scaled correlation ( = - ) is mainly plus some contribution from () which is close to the entire background. Thus the near side CI signals ( = -) which are the signals we have extracted and analyzed in Section IV A should rise above the value of the away side. This clearly occurs in each bin shown in Fig. 20.


From Fig. 20 it is clear that the PBM fits for the 0-5% and 5-10% bins agree with the CI analysis results within an average of a few percent of the total correlation for all ranges. HIJING fits agree with the analysis results for the CI 60-70% and 70-80% bins within an average of a few % for all ranges. Therefore the entire 2-D analyzed CI correlations, which are the sum of the five ranges, agree with the PBM fits for the 0-5% and 5-10% bins within an average of a few percent of the CI total correlations. The 2-D analyzed CI correlations agree with HIJING fits for the 60-70% and 70-80% bins within an average of a few percent of the CI total correlations. As we shall see in the following subsection the CD of the PBM agrees with the CD analysis results with similar precision (within a few percent of the correlation).
VI.3 Model fits for the CD
We again use the CD (total correlation) for comparison with theoretical models. Fig. 21 shows a comparison of Multiplicity x CD analysis results as a function of (degrees) with the PBM fits (lines) for 0-5% and 5-10% centrality bins for the range . Also shown is a comparison with the HIJING fits (dashed lines) for the 60-70% and 70-80% centrality bins. From the above comparison we observe that the PBM fits for the 0-5% and 5-10% centrality bins agree within a few % with the CD analysis results. The same is also true for the HIJING fits 60-70% and 70-80%.
In Fig. 22 we plot the Multiplicity x CD as a function of (degrees) for 4 bins covering the range . Each of the above four centralities shown was scaled so that the bin for is normalized to 1. We did this to show that the CD shape is approximately independent of centrality. This is consistent with Fig. 18-19 which show the Gaussian rms width in and for the CD signal. One can see in Fig. 22 that the analysis points in each range cluster around the four lines which correspond to each of the four ranges generated by Pythia jets pythia .
Pythia jets are used as the jets in HIJING and Pythia fragmentation is used in the PBM; thus the CD shape is totally given by Pythia and is approximately independent of centrality (see Fig. 18-19 ). If appreciable further interaction with the fireball interior occurred these initial CD correlations would be changed. Therefore we can conclude that the emitted pairs have little further interactions after hadronization. Thus surface or near surface hadronization and emission from the fireball both occur in the central region and all other centralities where there is considerable particle density. In the most peripheral bins the particle density is low enough to allow undisturbed fragmentation and thus no change in the CD correlation. It should be noted that the CD of the PBM in the 0-5% and 5-10% centrality bins is also reasonably consistent (within a few percent of the correlation) with Pythia jets. Thus the CI and the CD of the PBM in the 0-5% and 5-10% centrality bins are in reasonable quantitative agreement with the data analysis.
A theoretical pQCD calculation kajantie concluded that minijets formed with initial parton transverse momenta of around 3 GeV/c (also applicable down to 2 GeV/c) would become thermalized in a 200 GeV/c U + U collision at RHIC and likely not escape from the system. However the incomplete treatment of the fireball medium in this model kajantie could raise some doubt about the calculation. The authors freely admit that they cannot use pQCD for softer minijet calculations. Nevertheless their pQCD calculations show that the minijets formed by initial hard scatterings should be thermalized using reasonable cross sections. Thus the initial correlations from minijets are not expected to survive to the final state.
This minijet model kajantie has been modified and utilized as a qualitative picture to explain STAR correlation data by assuming that the observed correlations are surviving correlations generated by initial hard scatterings that interact with the medium of the fireball interior. The correlations have only been modified (accounting for the change in the CI width see Fig. 11) and not destroyed aya . This minijet model qualitative picture is totally different from the results of the pQCD treatment just discussed which concluded the minijets are thermalized and do not produce the observed correlations.
The fact that in the range 0.8 GeV/c 4.0 GeV/c of this analysis the CD correlation shape is consistent with Pythia jets fragmentation becomes a serious challenge for this minijet model aya . Since the behavior of the CD in our range is consistent with both hadronization and kinetic freeze-out occurring at or near the fireball surface it is clearly implied that initial state hard scattering as assumed in this minijet model aya does not survive to the final state at freeze-out. Therefore we conclude this and likely any minijet model assuming survival of initial hard scattering to the final state correlations fails in our range.
VII Summary and Conclusions
We performed an experimental investigation of particle-pair correlations in and using the main Time Projection Chamber of the STAR detector at RHIC. We investigated Au + Au collisions at = 200 GeV as a function of centrality using 13.5 million events from a minimum bias trigger to select the nine 0-80% centrality bins. In order to allow resolution of the 2fm radii substructures we cut out the lower momentum particles which come from sources that have radii up to 6 fm in size. These lower momentum particles would degrade our resolution of the 2fm sources and add particles which came from interacting in the interior of the fireball. Treatment of such interacting particles is complex. Thus we selected tracks having transverse momenta GeV/c, and . We performed cuts to remove the small angle bins necessary to reduce to a negligible level the effects of track merging, Coulomb, and HBT. Using symmetries of the data in and we were able to fold the four quadrants into one. The entire data set, unlike-sign charge pairs (US) and like-sign charge pairs (LS) for each centrality bin, was fit by a reasonably interpretable set of parameters. These consisted of 13 parameters for the US and 15 for the LS. These parameters are small in number compared to the total number of bins (534 - 536) used in each centrality bin.
One should note that the LS signal consisted of two Gaussians and required only 6 signal parameters. The US signal consisted of one approximate Gaussian which had an additional term in the exponent which depended on the fourth power of . Therefore four parameters were used for the US signal.
In order to fit the background in this precision experiment and represent known and expected physics effects, 9 parameters were required for both US and LS. The background terms are similar but not identical in US and LS as expected. However in order to get the best precision and minimum distortion in the fits they were kept separate. The physical arguments for the necessity of these parameters were given in Section III.
All the fits to the US and LS for all centrality bins had significance consistent with or less. The parameterization used in this analysis was very similar to that successfully used in the prior central trigger analysis centralproduction . The major differences were the removal of the readout sector gap terms and an additional flow term (). Appendix A contains the parameters and their variation with centrality.
The Charge Independent (CI US + LS) and the Charge Dependent (CD US - LS) signals were formed for each of the nine centrality bins. The CI signal displays the average structure of the correlated emitting sources at kinetic freeze-out. Thus the total CI correlation is an unbiased quantitative measure of the particle pair correlation observed in the TPC. The CI signal characteristics are shown and discussed in Section IV A. The most central CI bins have the largest signals and a large elongation. Both the signal and elongation decrease with deceasing centrality till the most peripheral bins where the and correlation distributions are symmetric. The PBM fits the two most central bins very well within an average of a few % of the total correlation. HIJING fits the two most peripheral bins with similar precision (See Section VI B). Future theoretical work is expected to address fitting the intermediate centrality region of the CI and to investigate the source characteristics in these intermediate centrality bins.
Section V discusses systematic errors. From our analysis of the systematic errors we conclude that the conclusions drawn have not been significantly effected by the systematic errors.
An overall interpretation that is consistent with this analysis is:
1) The CD correlation would represent the intial correlation of opposite sign charge pairs emitted from the same space-time region if the emission occurred from, or very near to, the surface of the fireball at kinetic freeze-out. It was shown in Section VI C that the shape of the CD correlation is approximately independent of collision centrality and consistent with HIJING (or Pythia) jets. Thus, we conclude that both hadronization and particle emission are consistent with coming from, or very near to, the surface. At peripheral centralities, the intermediate range charged particles are mainly produced by jets which fragment freely. As the centrality increases, a fireball forms which may be very complex, but the amount of fireball material that the intermediate particles pass through is minimal. The justification for this is the approximate invariance of the shape of the CD correlation with respect to centrality. Furthermore, the Pythia jet shape for the intermediate charged particles is consistent with the measured CD correlation for all centralities.
2) In the most central bins, the simultaneous peaking of the 2-D CI signal amplitude, signal integral, and the large elongation which occurs and the CD are all well fit by the parton bubble model. The PBM fits the two most central bins well within an average of a few percent. The model was developed to be consistent with the HBT observed source size. There is a minijet model based on pQCD calculations for 200 GeV U + U collisions at RHIC which considered minijets formed with partons of transverse momenta of around 3 GeV/c kajantie . The authors concluded that the minijets would become thermalized and likely not escape from the system. In Section VI C we discussed the general characteristics of minijet correlations (details and limitations) originating from hard scatterings which may be observed. The precision analysis of the data as a function of centrality presented in this paper could stimulate other new physics models as possible explanations of the observed correlations.
VIII Acknowledgment
We thank the RHIC Operations Group and RCF at BNL, and the NERSC Center at LBNL and the resources provided by the Open Science Grid consortium for their support. This work was supported in part by the Offices of NP and HEP within the U.S. DOE Office of Science, the U.S. NSF, the Sloan Foundation, the DFG Excellence Cluster EXC153 of Germany, CNRS/IN2P3, RA, RPL, and EMN of France, STFC and EPSRC of the United Kingdom, FAPESP of Brazil, the Russian Ministry of Sci. and Tech., the NNSFC, CAS, MoST, and MoE of China, IRP and GA of the Czech Republic, FOM of the Netherlands, DAE, DST, and CSIR of the Government of India, Swiss NSF, the Polish State Committee for Scientific Research, Slovak Research and Development Agency, and the Korea Sci. & Eng. Foundation.
Appendix A Parameters
The parameterization was similar to that employed in Ref. centralproduction .
There are two basic pairs of particles: unlike-sign charge pairs (US) and like-sign charge pairs (LS). Both were parameterized for each centrality bin independently. The folded after cuts US data as a function of centrality shown in Fig. 1 was parameterized using the US parameterization. The folded after cuts LS data as a function of centrality shown in Fig. 2 was parameterized using the LS parameterization. Thus there were nine independent US and LS sets of parameters.
The significant difference from Ref. centralproduction run 2 parameters were:
1) The sector gap terms were not needed because there was event by event space charge distortion correction for this run (run 4). In Ref. centralproduction we had attributed the necessity of the sector gap corrections to space charge. This explains why they were not necessary in run 4.
2) We found it necessary to include a () flow term in addition to the previously employed () term to obtain good fits.
Parameters fitting requires a mixture of knowledge and experience. One must keep in mind several important points.
a) One must use one’s knowledge and experience to pick realistic parameters which will efficiently and meaningfully describe the data well enough so that the statistical significance of the final fits are good enough to be credible.
b) Experienced data analysts usually require that their fits be consistent with at least a fit compared to an ideal fit in which = degrees of freedom (DOF).
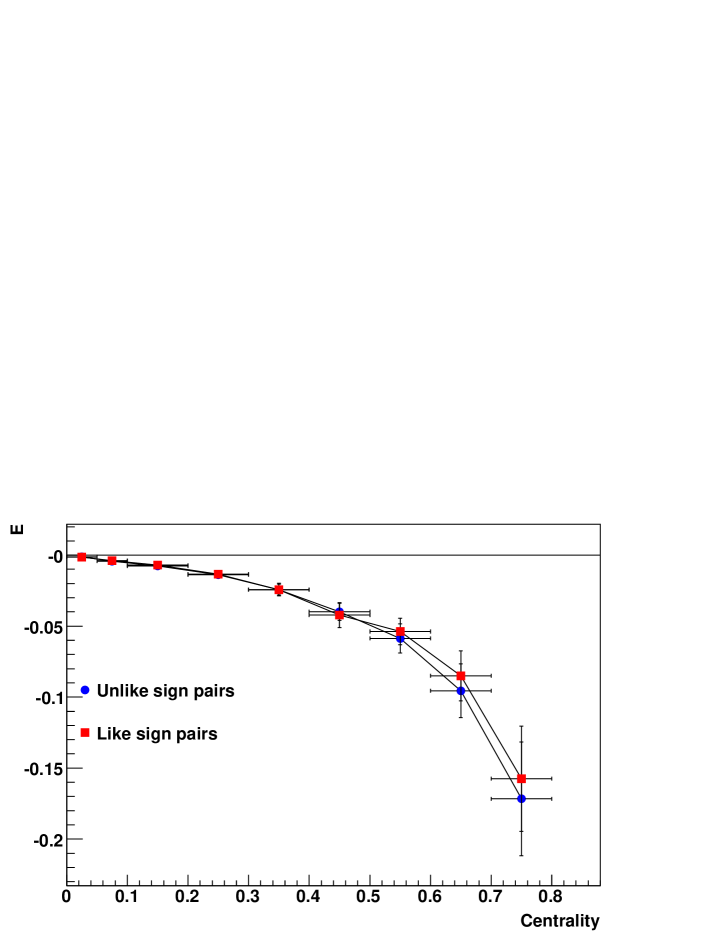
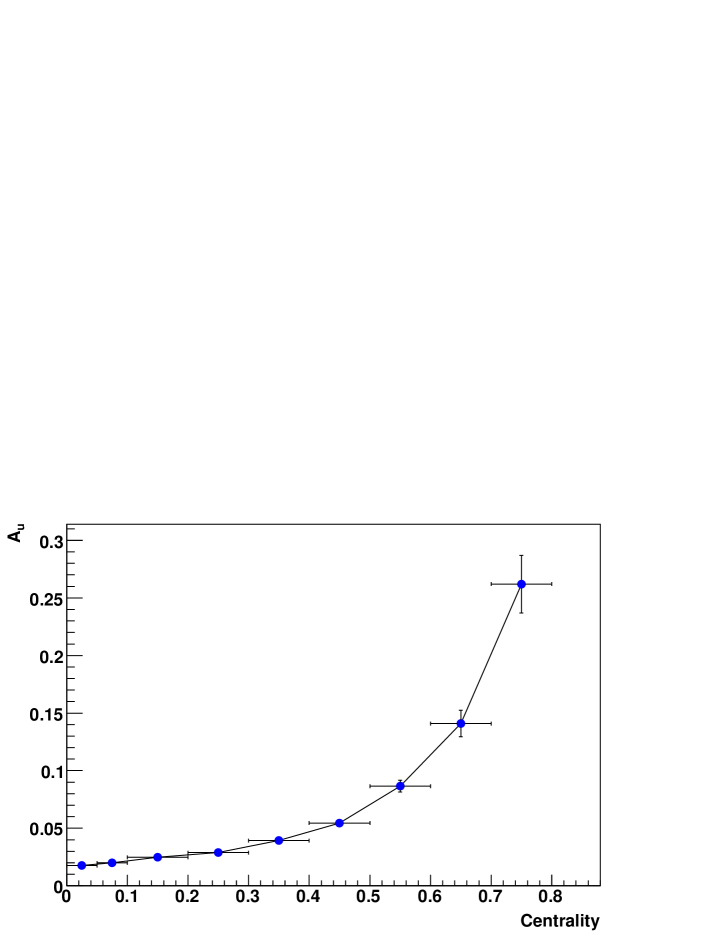
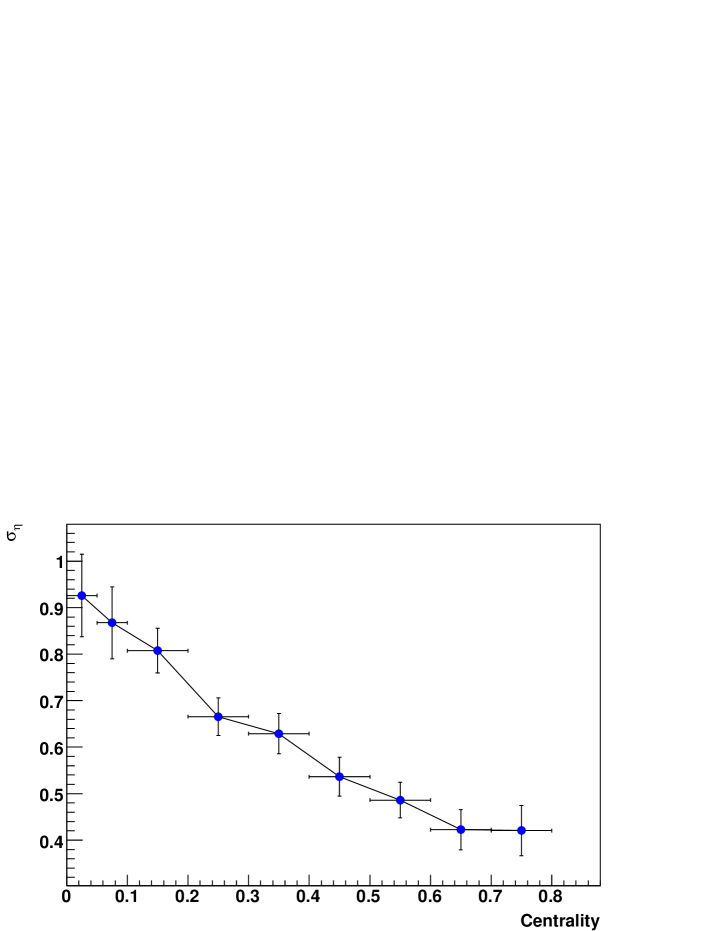
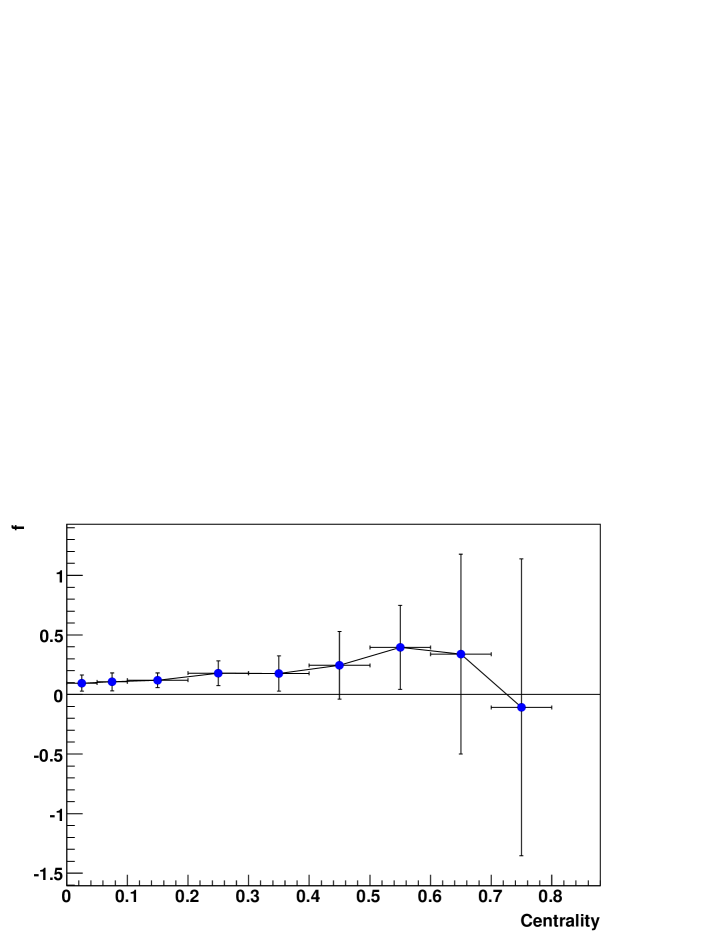
A.1 Parameters of the background terms for US and LS vs. Centrality
The first background term is an overall normalization term of the correlation to a mean of 1 shown in Fig. 23.
Four terms Fig. 24-27 are needed for momentum and charge conservation in order to obtain acceptable fits.
Two terms Fig. 28-29 represent elliptic flow effects and are background parameters as far as this analysis is concerned. No reaction plane is assumed in this analysis.
Fig. 30 is a background term probably due to remaining long range correlation. Long range correlations should be independent like this term and important in the soft particle range which we do not explore in this analysis.
Fig. 31 is a independent small effect which we attribute to losses in the larger tracking in the TPC and perhaps part of a long range correlation not relevant to this analysis. We utilized mixed-event-pairs with a similar -vertex to take into account these losses. Imperfections in this procedure leave a small Gaussian bump near larger . We found that choosing a Gaussian with a fixed center of 1.25 and a fixed width of 1.57 for all centrality bins was adequate.
A.2 Signal Parameters for the US vs. Centrality
Fig. 32 is the US signal amplitude for the approximate Gaussian fit.
Fig. 33 is the US signal width for the approximate Gaussian fit.
Fig. 34 is the US signal additional term in the Gaussian exponent which makes it an approximate Gaussian fit.
Fig. 35 is the US signal width for the approximate Gaussian fit.
A.3 Signal Parameters for the LS vs. Centrality
Fig. 36 is the LS signal amplitude for the large Gaussian in the fit.
Fig. 37 is the LS signal width for the large Gaussian in the fit.
Fig. 38 is the LS signal width for the large Gaussian in the fit.
Fig. 39 is the LS signal amplitude for the dip Gaussian in the fit.
Fig. 40 is the LS signal width for the dip Gaussian in the fit.
Fig. 41 is the LS signal width for the dip Gaussian in the fit.
References
- (1) STAR Collaboration J. Adams et. al., Nucl. Phys. A 757, 102 (2005).
- (2) For an overview see:Quark Matter Formation and Heavy Ion Collisions, Proceedings Biefield Workshop (May 82), Quark Matter 2004, J. Phys. G 30, s633-s1392 (2004).
- (3) Special Issue: The Relativistic Heavy Ion Collider Project RHIC and its Detectors, Nucl.Instrum. Meth. A 499, pp 235-880 (2003).
- (4) J. Adams et al.(STAR Collaboration), Phys. Rev. C 70, 054907 (2004).
- (5) F. Karsch, Nucl. Phys. A 698, 199c (2002).
- (6) J. Adams et al.(STAR Collaboration), Phys. Rev. C 71, 044906 (2005), S. S. Adler et al.(PHENIX collaboration), Phys. Rev. Lett. 93, 152302 (2004).
- (7) J. Adams et al.(STAR Collaboration), Phys. Rev. C 71, 031901(R) (2005).
- (8) J. Adams et. al.,(STAR Collaboration), Phys. Rev. C 73, 064907 (2006), Phys. Lett. B 634, 347 (2006).
- (9) STAR Collaboration J. Adams et. al., Phys. Rev. C 75, 034901 (2007).
- (10) S.J. Lindenbaum and R.S. Longacre, Eur. Phys. J. C. 49, 767-782 (2007) DOI 10.1140 /epjc/ s10052-006-0131-4.
- (11) S.J. Lindenbaum, R.S. Longacre and M. Kramer Eur. Phys. J. C (Particles and Fields) 30, 241-253 (2003). DOI: 10. 1140/epjc/s2003-01 268-3
- (12) L. Van Hove, Hadronization Quark-Gluon Plasma in Ultra-Relativistic Collisions, CERN-TH (1984) 3924, L. Van Hove, Hadronization Model for Quark-Gluon Plasma in Ultra-Relativistic Collisions, Z. Phys. C27, 135 (1985).
- (13) S.J. Lindenbaum and R.S. Longacre, J. Phys. G 26, 937 (2000). This paper contains earlier (85 onward) references by these authors.
- (14) Nucl. Instrum. Meth. A 499,(2003), C. Adler et al., 433-436, K.H. Ackermann et al.(STAR Collaboration), 624-632, M. Anderson et al., 659-678, F.S. Bieser et al., 766-777.
- (15) J. Adams et al.(STAR Collaboration), Phys. Rev. Lett. 91, 172302 (2003).
- (16) K.H. Ackerman et al.(STAR Collaboration), Phys. Rev. Lett. 86, 402 (2001). C. Adler et al.(STAR Collaboration), Phys. Rev. Lett. 90, 032301 (2003), J. Adams et al.(STAR Collaboration), Phys. Rev. C72, 014904 (2005).
- (17) N. Borghini et al. Phys. Rev. C. 62 (2000) 034902.
- (18) S. Edelman et al Phys. Lett B 592, 1 (2004), See 31 Probability, Section 31.4.4 distribution, p 278(REVIEW OF PARTICLE PROPERTIES).
- (19) S. A. Bass, P. Danielewicz and S. Pratt, Phys. Rev. Lett.85, 2689 (2000), S. Chang et al., Phys. Rev. C69, 54906 (2004), P. Christakoglou, A. Petridis and M. Vassiliou, Nucl. Phys. A749, 279c (2005).
- (20) T. Sjostrand, M. van Zijil, Phys. Rev. D 36, 2019 (1987).
- (21) X.N. Wang and M. Gyulassy, Phys. Rev. D 44, 3501 (1991).
- (22) C. Adler et al.(STAR Collaboration), Phys. Rev. Lett. 90, 082302 (2003).
- (23) C. Adler et al.(STAR Collaboration), Phys. Rev. Lett. 87, 112303 (2001), J. Adams et al. (STAR Collaboration), Phys. Rev. Lett. 92, 112301 (2004).
- (24) K. Kajantie, P.V. Landshoff, J. Lndfors, Phys. Rev. Lett.59, 2527 (1987).